
Upwards movement was expected to continue. Today’s higher high and a higher low fits the definition of upwards movement.
Summary: This upwards bounce may continue now to about 2,895 or above. It may last a few more days as intermediate wave (B) or (X) within primary wave 4.
A primary degree correction should last several weeks and should show up on the weekly and monthly charts. Primary wave 4 may total a Fibonacci 8, 13 or 21 weeks. The preferred target for it to end is now about 2,700. Look for very strong support about the lower edge of the teal trend channel on the monthly chart.
Primary wave 4 should be expected to exhibit reasonable strength. This is the last multi week to multi month consolidation in this ageing bull market, and it may now begin to take on some characteristics of the bear market waiting in the wings.
The final target for this bull market to end remains at 3,616, which may be met in October 2019.
New updates to this analysis are in bold.
The biggest picture, Grand Super Cycle analysis, is here.
Last published monthly chart is here, video is here.
ELLIOTT WAVE COUNT
WEEKLY CHART
Click chart to enlarge.
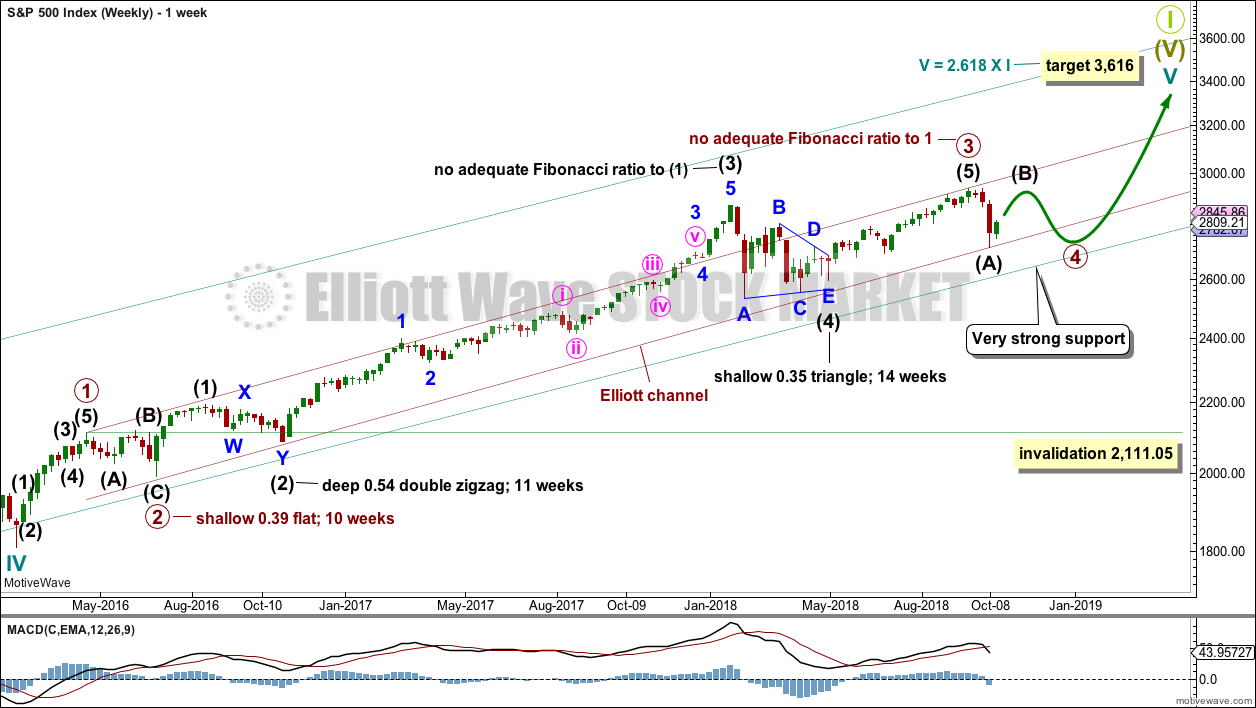
Cycle wave V must complete as a five structure, which should look clear at the weekly chart level and also now at the monthly chart level. It may only be an impulse or ending diagonal. It is clear it is an impulse.
Within cycle wave V, the third waves at all degrees may only subdivide as impulses.
Within primary wave 3, there is perfect alternation and excellent proportion between intermediate waves (2) and (4).
The channel is now drawn about primary degree waves. The first trend line is drawn from the ends of primary waves 1 to 3, then a parallel copy is placed upon the low of primary wave 2. Primary wave 4 may find support about the lower edge of this maroon channel. At the end of last week, that is exactly where price bounced up. The overshoot of the upper edge of this channel by the end of intermediate wave (3) looks typical. For the S&P, its third waves are usually the strongest portion of an impulse; they often exhibit enough strength to overshoot channels.
Fourth waves do not always end within channels drawn using this technique. If primary wave 4 breaks out of the narrow maroon channel, then it may find very strong support about the lower edge of the teal channel. This channel is copied over from the monthly chart and contains the entire bull market since its beginning in March 2009. While Super Cycle wave (V) is incomplete, this channel should not be breached.
Primary wave 4 may not move into primary wave 1 price territory below 2,111.05.
When primary wave 4 may be complete, then the final target may be also calculated at primary degree. At that stage, the final target may widen to a small zone, or it may change.
At this stage, the expectation is for the final target to be met in October 2019. If price gets up to this target and either the structure is incomplete or price keeps rising through it, then a new higher target would be calculated.
DAILY CHART
Click chart to enlarge.
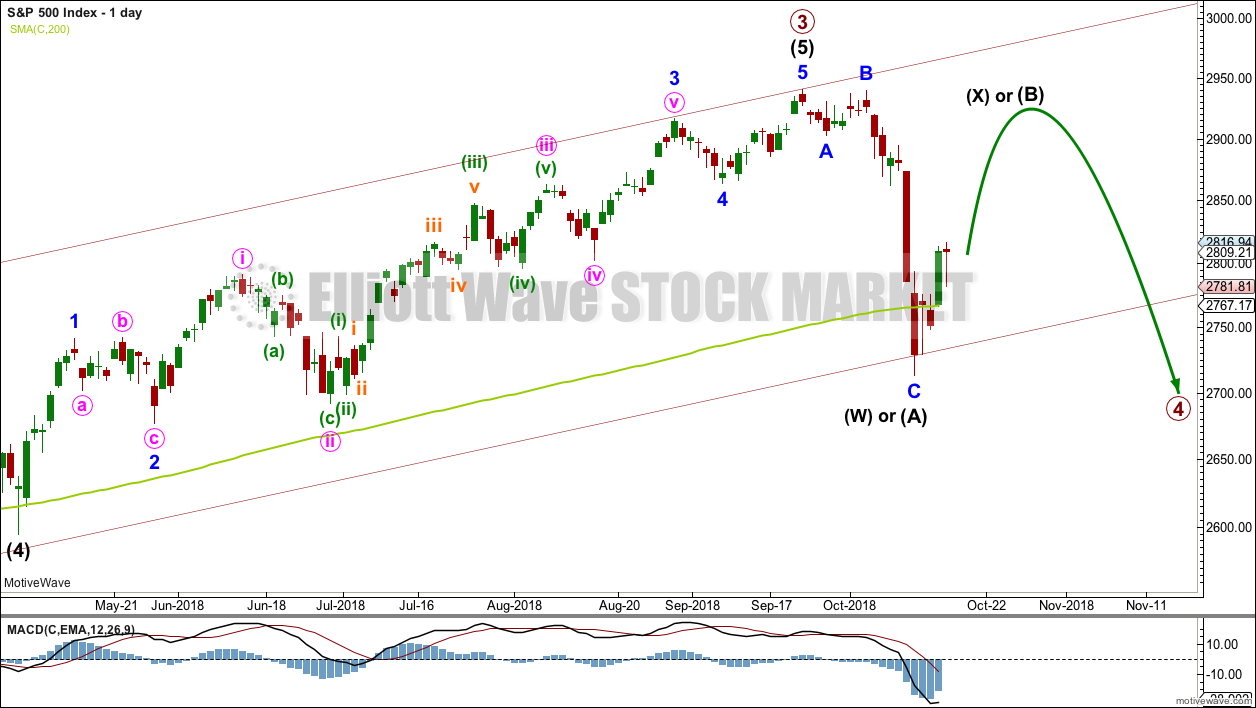
Primary wave 4 would most likely end somewhere within the price territory of the fourth wave of one lesser degree. Intermediate wave (4) has its price territory from 2,872.87 to 2,532.69. Within this range sit two Fibonacci ratios giving two targets. The 0.236 Fibonacci ratio has now been met and passed.
The target for primary wave 4 at 2,578.30 would expect an overshoot of the teal channel. This target may be too low; price may find support at the lower edge of the channel. However, as primary wave 4 should be expected to exhibit reasonable strength, it may be able to overshoot the channel and that would look reasonable.
Primary wave 2 unfolded as a shallow regular flat correction lasting 10 weeks.
Primary wave 4 may have begun with a zigzag downwards. This may be a three wave structure for intermediate wave (A) of a flat or triangle for primary wave 4, with a triangle more likely as that would provide alternation with the flat correction of primary wave 2. The zigzag may also be labelled intermediate wave (W) of a double zigzag or combination for primary wave 4.
All of a flat, triangle, or double combination may include a new high for intermediate wave (B) or (X) as in an expanded flat, running triangle or wave (X) within a combination. There is no upper invalidation point for this reason.
A double zigzag would expect to see a relatively shallow and brief bounce for intermediate wave (X), so that the whole structure of a double zigzag has a strong downwards slope.
Primary wave 4 may not move into primary wave 1 price territory below 2,111.05.
HOURLY CHART
Click chart to enlarge.
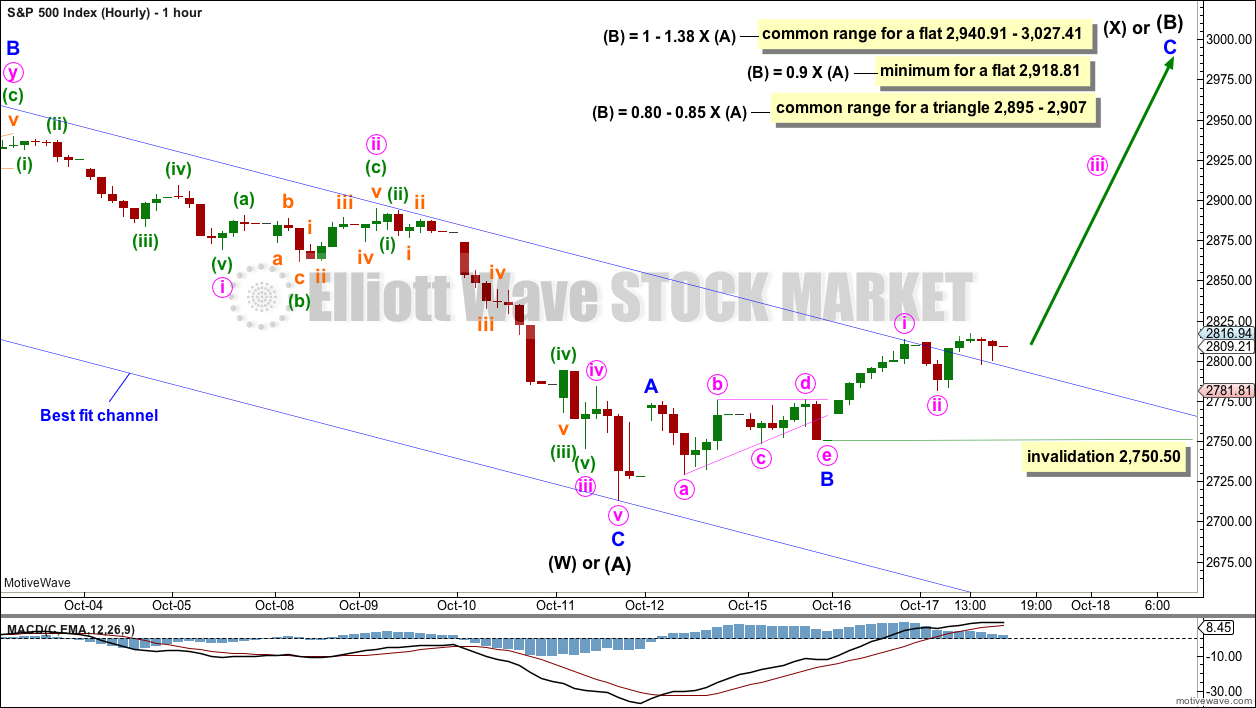
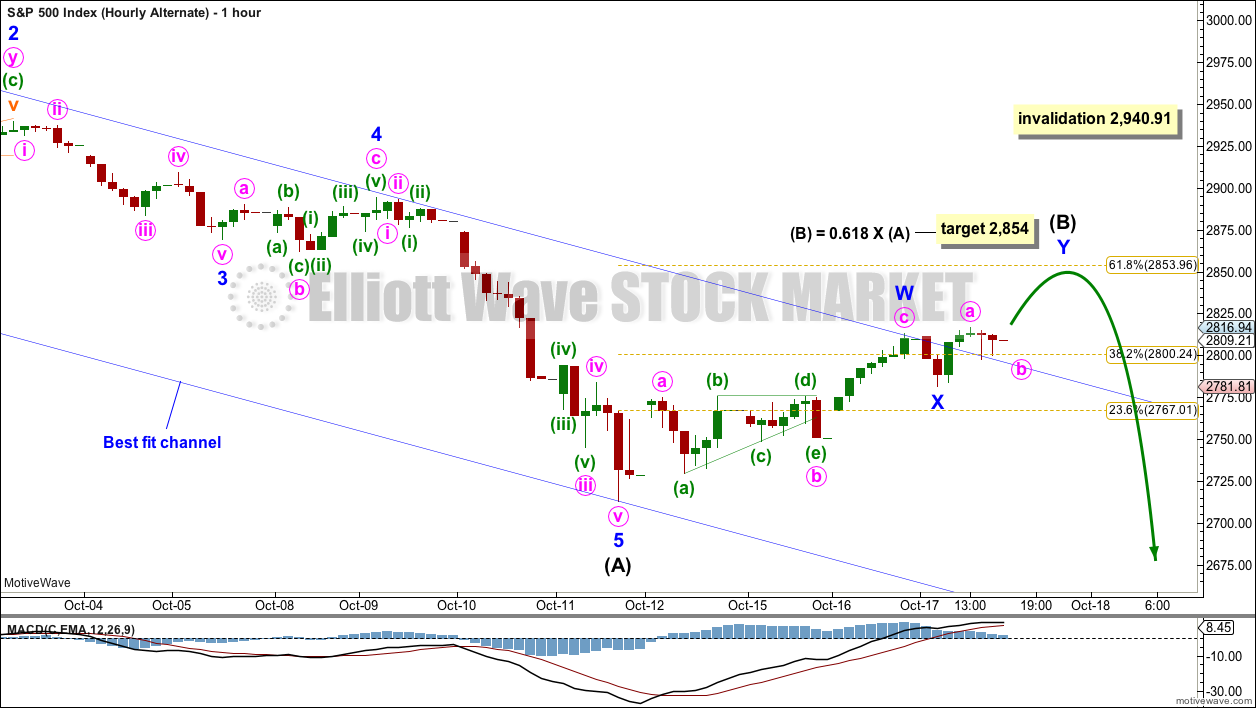
Intermediate wave (A) may be a complete zigzag. Intermediate wave (B) or (X) may be underway as a multi day bounce within primary wave 4.
This chart considers multiple possible structures for primary wave 4: as a triangle, combination, double zigzag or flat (least likely). Within a combination or triangle, there is no minimum length for intermediate wave (B) or (X).
Today’s breach of the blue best fit channel adds a little confidence to the expectation of a multi day bounce to continue here. The upper edge of the channel has provided support for downwards movement within today’s session; this looks like a typical back test.
Minor wave C must subdivide as a five wave structure. Within minor wave C, minute waves i and ii may be complete. If minute wave ii continues lower as an expanded flat or combination, then it may not move beyond the start of minute wave i below 2,750.50.
It is also possible that intermediate wave (X) or (B) may be unfolding higher as a double zigzag as per the labelling on the alternate hourly chart below. Both ideas of a single or double zigzag work for both wave counts.
ALTERNATE DAILY CHART
Click chart to enlarge.
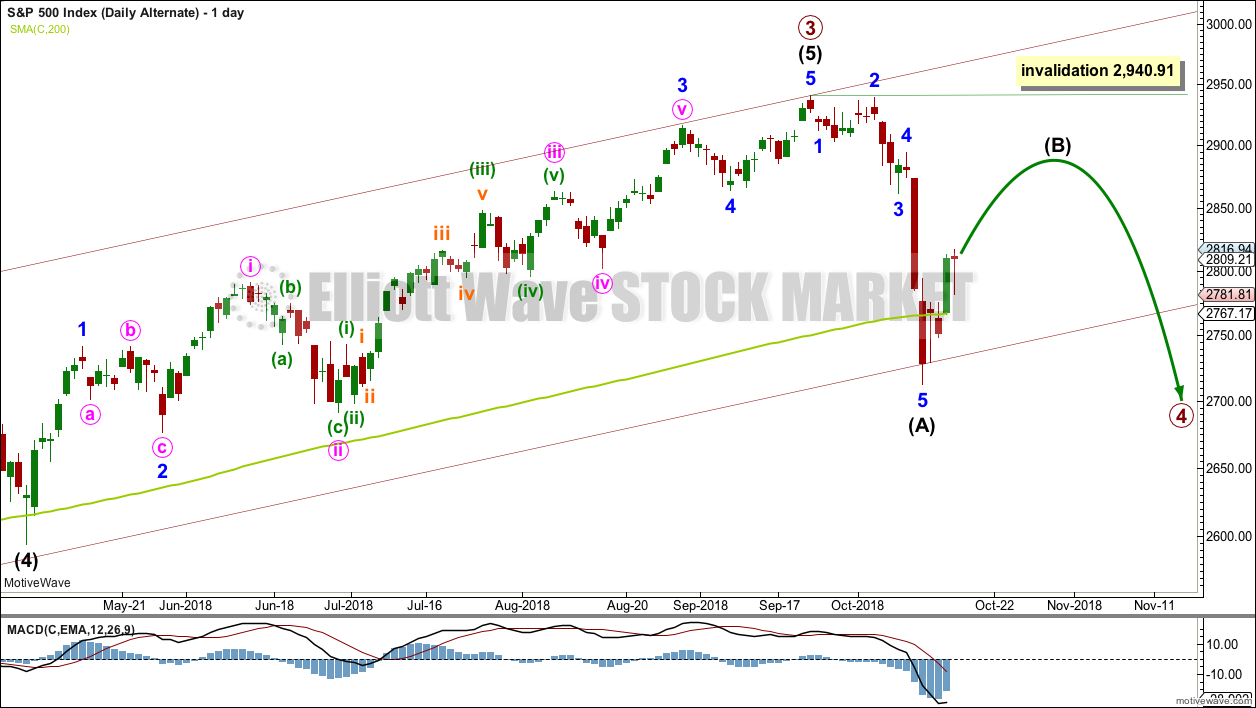
It is also possible to see intermediate wave (A) as a complete five wave structure. This wave count would expect that primary wave 4 may be unfolding as a zigzag, which would provide structural alternation with the flat correction of primary wave 2.
This wave count is judged to have a slightly lower probability than the main wave count due to the disproportion between minor waves 2 and 4 within intermediate wave (A).
If intermediate wave (A) subdivides as a five wave structure, then intermediate wave (B) may not move beyond its start above 2,940.91.
Intermediate wave (B) may unfold as any corrective structure. It is most likely to be a zigzag, but it may also be a flat, combination, triangle or multiple zigzag. It would most likely last several days to a few weeks and may be complicated and time consuming.
ALTERNATE HOURLY CHART
Click chart to enlarge.
At this stage, the degree of labelling within intermediate wave (B) is left as labelled at minor degree. But it must be understood that this may be wrong and that it may need to be moved down one degree if intermediate wave (B) takes longer and turns into a complicated time consuming consolidation.
A double zigzag upwards may be unfolding. The target remains the same at the 0.618 Fibonacci ratio of intermediate wave (A).
When a double zigzag upwards is complete, that may be the whole of intermediate wave (B); or it may only be minor wave A of a flat or triangle.
For this alternate wave count, intermediate wave (B) may be more shallow than the expected bounce for the main wave count. B waves within zigzags are usually more shallow than B or X waves within flats, triangles or combinations.
TECHNICAL ANALYSIS
WEEKLY CHART
Click chart to enlarge. Chart courtesy of StockCharts.com.
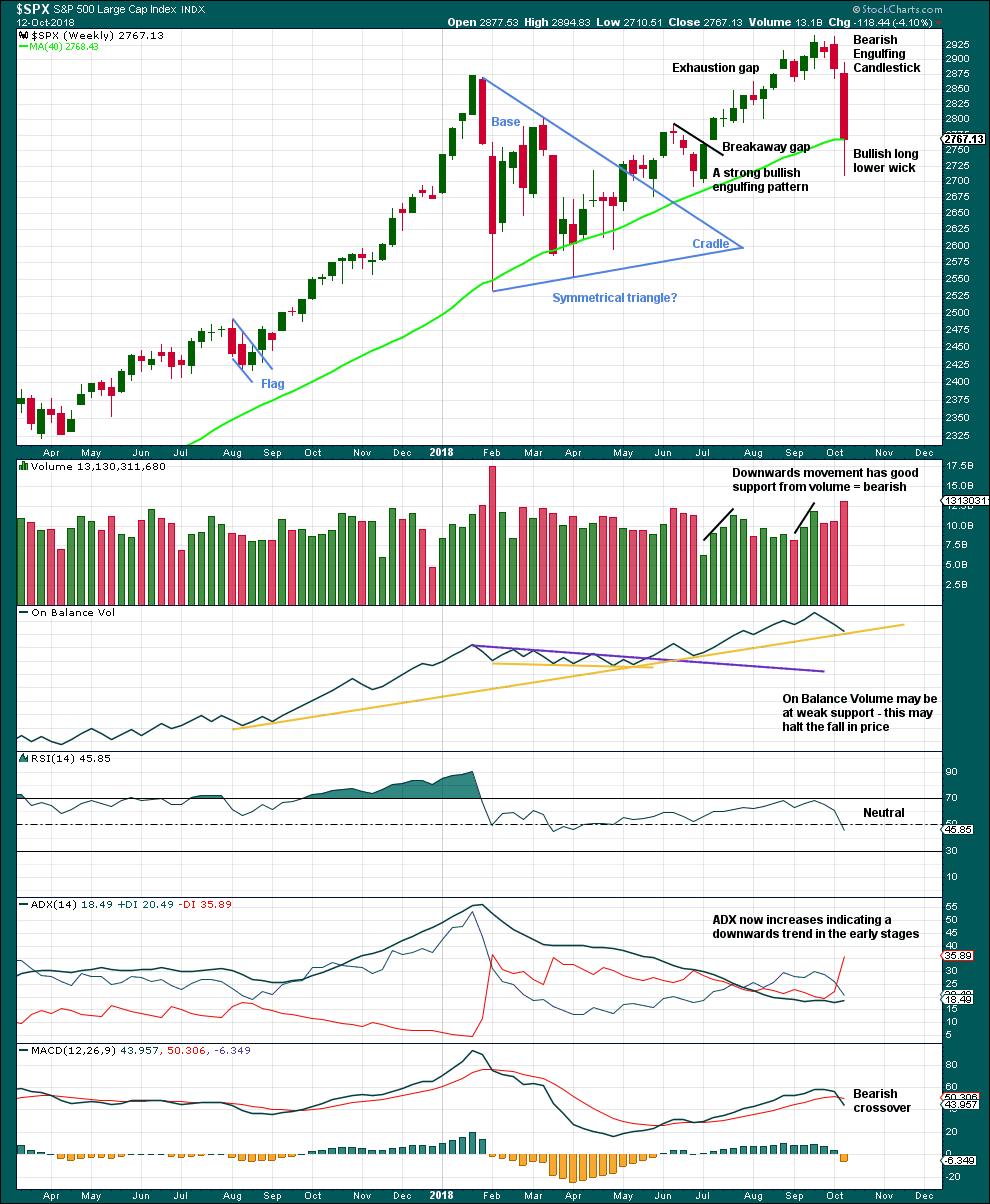
The symmetrical triangle base distance is 340.18. Added to the breakout point of 2,704.54 this gives a target at 3,044.72. This target was not met; it was too optimistic.
The long lower wick on this weekly candlestick suggests a bounce this week.
DAILY CHART
Click chart to enlarge. Chart courtesy of StockCharts.com.
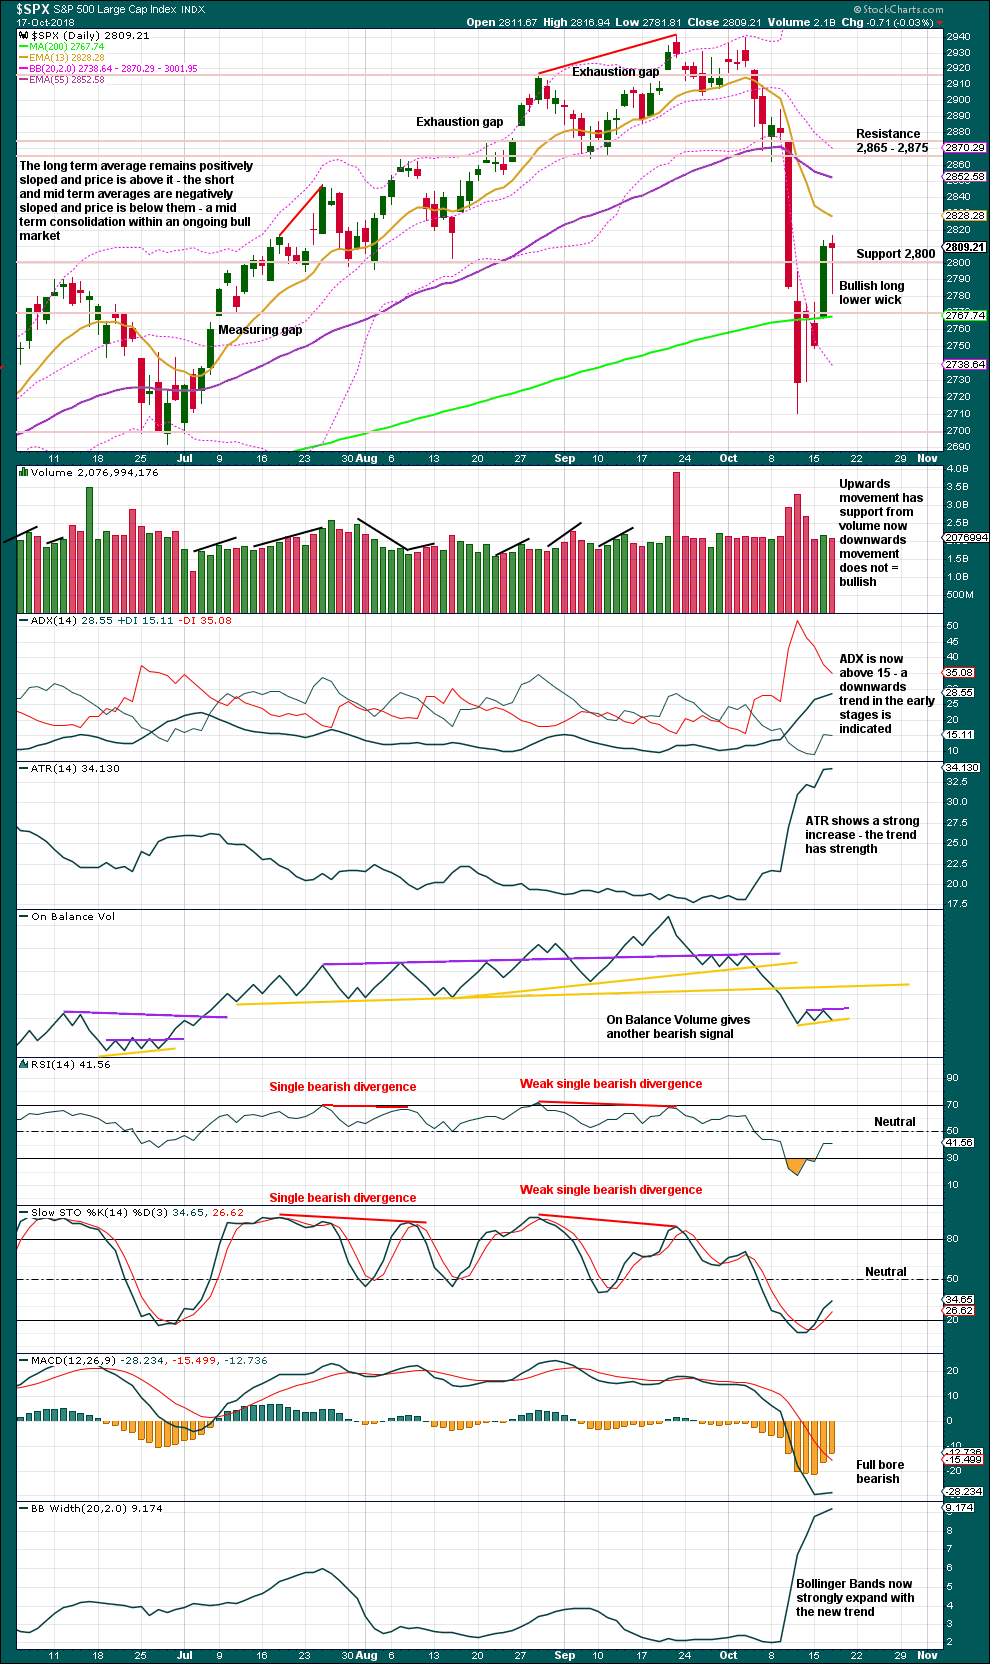
Today’s candlestick may be a Hanging Man reversal pattern, but the bullish implications of the long lower wick require bearish confirmation before it may be read as a bearish reversal pattern. Without bearish confirmation, this candlestick should be read as bullish.
The short term volume profile is bullish.
There is a new small range on On Balance Volume. It will be watched carefully for a signal.
VOLATILITY – INVERTED VIX CHART
WEEKLY CHART

Click chart to enlarge. Chart courtesy of StockCharts.com. So that colour blind members are included, bearish signals
will be noted with blue and bullish signals with yellow.
Primary wave 4 has now arrived and is showing reasonable strength. There is continuing mid term bearish divergence this week with inverted VIX making a new low below the prior swing low of the week beginning 25th June, but price has not yet made a corresponding new low.
As primary wave 4 continues this weekly chart may offer a bullish signal at its end.
DAILY CHART
Click chart to enlarge. Chart courtesy of StockCharts.com. So that colour blind members are included, bearish signals
will be noted with blue and bullish signals with yellow.
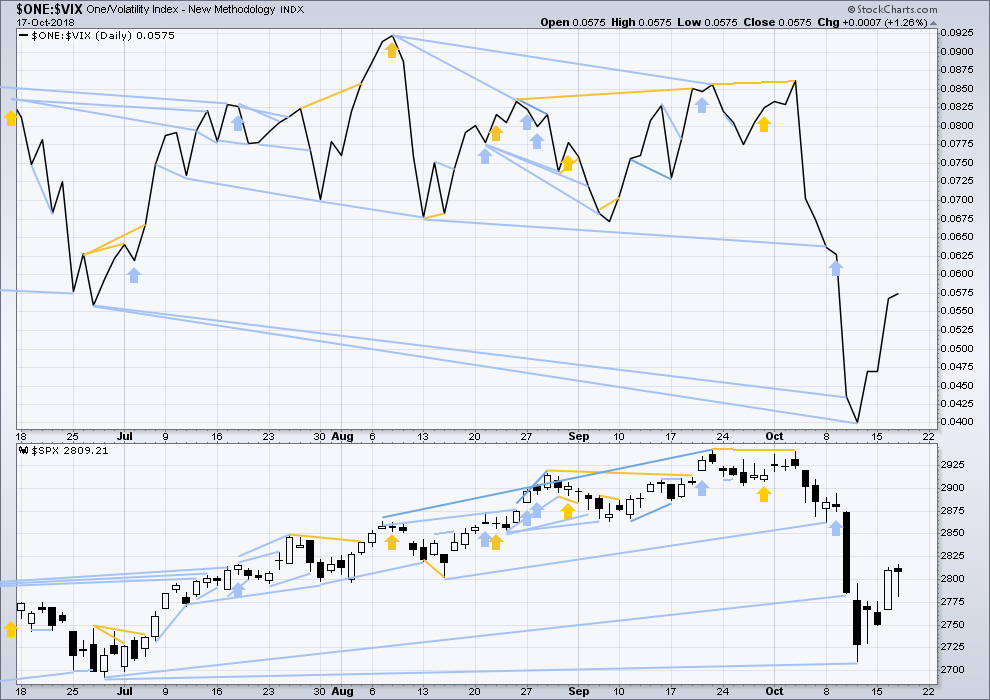
Normally, volatility should decline as price moves higher and increase as price moves lower. This means that normally inverted VIX should move in the same direction as price.
Upwards movement within this session has support from a normal corresponding decline in VIX. There is no new short term divergence.
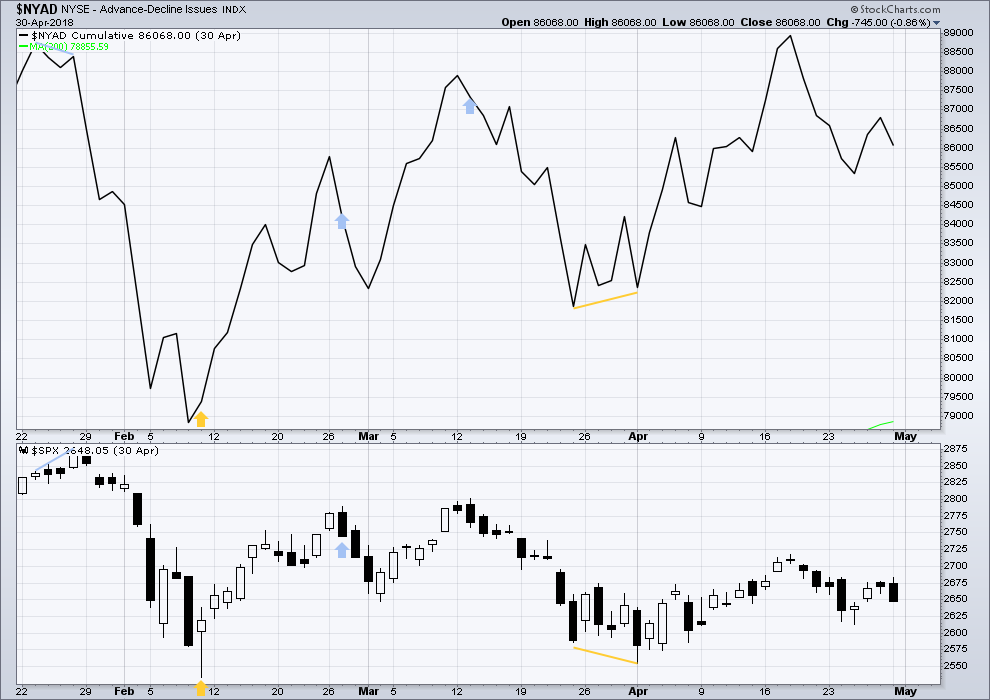
BREADTH – AD LINE
WEEKLY CHART
Click chart to enlarge. Chart courtesy of StockCharts.com.
When primary wave 3 comes to an end, it may be valuable to watch the AD line at the weekly time frame as well as the daily.
Last week the AD line has made a slight new low below the prior swing low of the week beginning 25th June, but price has not. This mid term divergence is bearish, but it is weak.
DAILY CHART
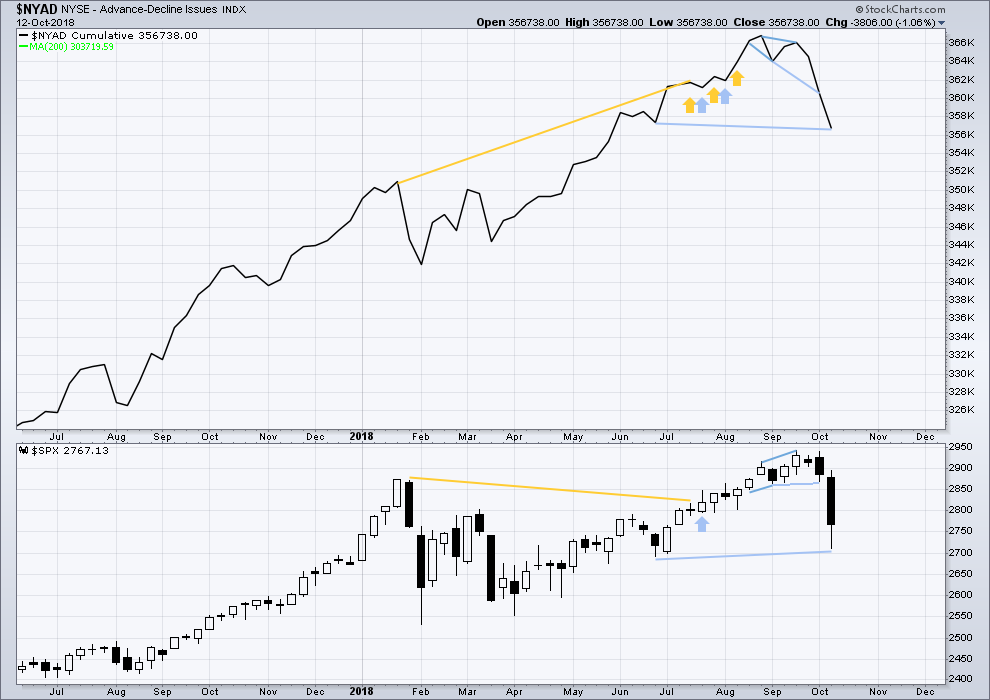
Click chart to enlarge. Chart courtesy of StockCharts.com.
There is normally 4-6 months divergence between price and market breadth prior to a full fledged bear market. This has been so for all major bear markets within the last 90 odd years. With no longer term divergence yet at this point, any decline in price should be expected to be a pullback within an ongoing bull market and not necessarily the start of a bear market. New all time highs from the AD line on the 29th of August means that the beginning of any bear market may be at the end of December 2018, but it may of course be a lot longer than that. My next expectation for the end of this bull market may now be October 2019.
Breadth should be read as a leading indicator.
Today price moved higher although the balance of volume was down and the candlestick was red. Market breadth has declined during this session. This single day divergence is bearish.
Both mid and small caps for Wednesday have long lower wicks. These may be read as Hanging Men, but they both require bearish confirmation first. Prior to that, they should both be read as bullish.
DOW THEORY
The following lows need to be exceeded for Dow Theory to confirm the end of the bull market and a change to a bear market:
DJIA: 23,344.52.
DJT: 9,806.79.
S&P500: 2,532.69.
Nasdaq: 6,630.67.
ANALYSIS OF INTERMEDIATE WAVE (4)
TECHNICAL ANALYSIS
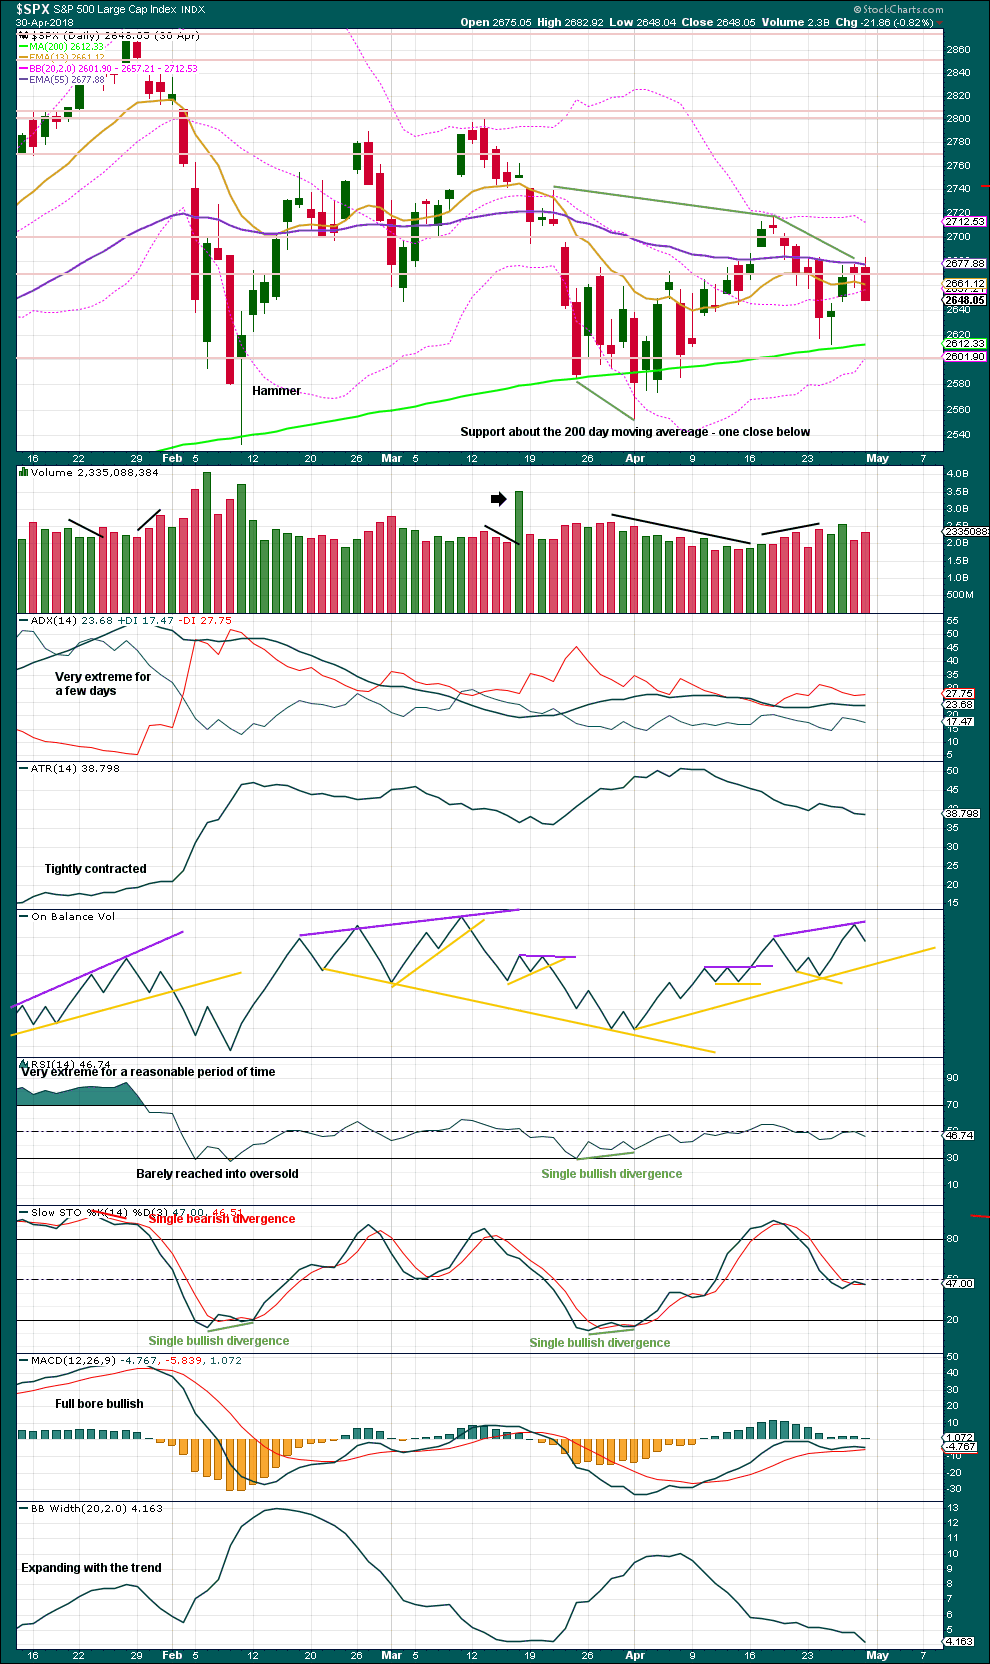
Click chart to enlarge. Chart courtesy of StockCharts.com.
Intermediate wave (4) was a large symmetrical triangle. The deepest wave was the first wave. At its low there was a clear candlestick reversal pattern and bullish divergence between price and Stochastics.
RSI barely managed to reach into oversold.
The current correction for primary wave 4 may behave differently, but there should be some similarities.
It is expected that primary wave 4 may be stronger than intermediate wave (4).
VIX
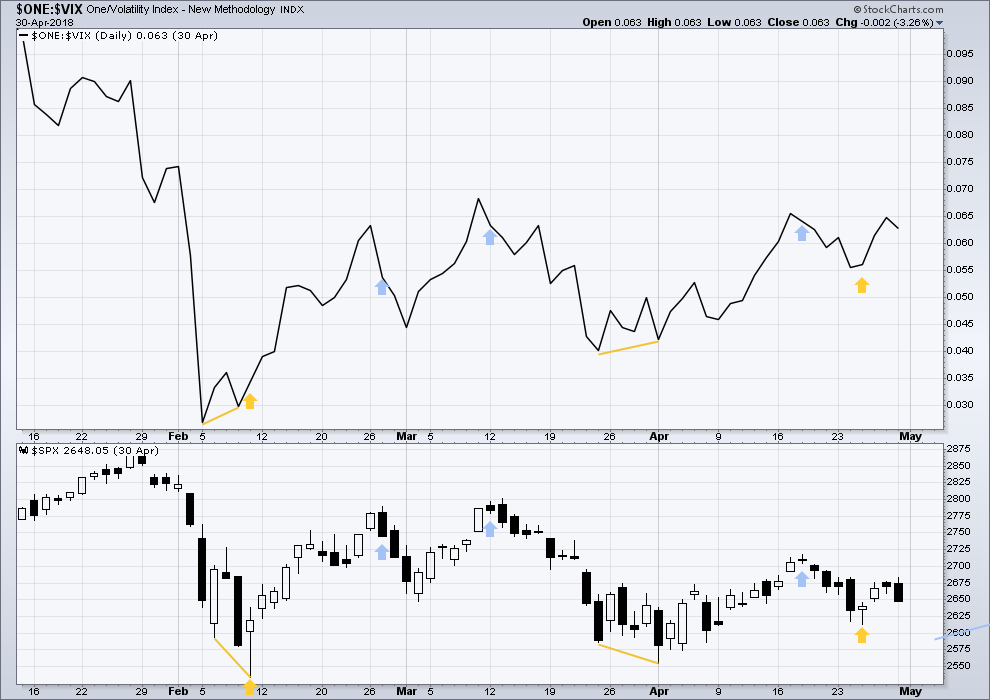
Click chart to enlarge. Chart courtesy of StockCharts.com.
This is a daily chart.
At the two major lows within intermediate wave (4), inverted VIX exhibited single short term bullish divergence.
At highs within intermediate wave (4), inverted VIX exhibited one single day bullish divergence with price.
AD LINE
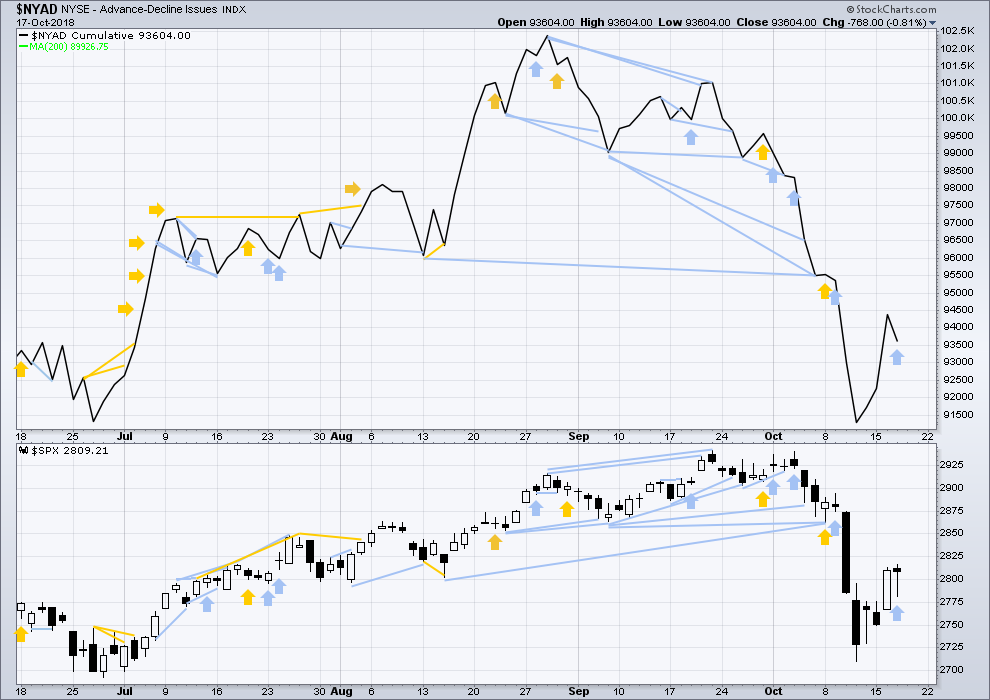
Click chart to enlarge. Chart courtesy of StockCharts.com.
This is a daily chart.
At the two major lows within intermediate wave (4), there was bullish divergence between price and the AD line. At the two major highs within intermediate wave (4), there was each one instance of single day bearish divergence.
Published @ 09:30 p.m. EST.
—
Careful risk management protects your trading account(s).
Follow my two Golden Rules:
1. Always trade with stops.
2. Risk only 1-5% of equity on any one trade.
Note: NASDAQ finished below its 200 day moving average to be added to the list with RUT, NYA and DJTA. SPX finished essentially at its 200 day moving average. DJIA is just above the 200 dma. Can they hold? I think not.
Good morning everybody.
This works. An expanded flat for minute wave ii. But only if price remains above 2,750.50.
When I look at the last small upwards wave from today’s low on a five minute chart it has a count of seven, that’s corrective. And so I suspect this count here is wrong and that price may make another low today.
Lets see how an alternate idea may work…
An alternate idea:
If a double zigzag is unfolding higher, then today’s low may be an expanded flat for wave X.
X waves can move beyond the start of W waves, and sometimes this happens in combinations, but within double zigzags they’re usually relatively shallow. So if a double zigzag is unfolding then wave X should end here or very soon indeed.
Lara, methinks this is the correct count, as the market is designed to destroy as much capital as possible, and this count would certainly do so more than a C wave low near FEB lows. If this is a 3, then the liquidity supernova that has been the last 10 years will certainly surprise us all with its downside ferocity as it is unwound. The rapid deterioration of liquidity is even frightening me a bit as well.
The problem the banksters are now facing is an inability to extend the waves even in the absence of strong selling pressure. Their attempts today failed miserably as a number of long shadows were forcefully rejected. The loss of the 2800 pivot is huge. I think we should now expect surprises to the down-side.
If they are going to try and push it to the 2850 area they are going to have to expend a phenomenal amount of capital in the futures market overnight. Even if they accomplish that, I would expect that move to be spectacularly faded. There is not a trader in his right mind who is going to risk going into the week-end long this market imho…. 🙂
Now that the session is over and I can see StockChart data, I see that volume supports today’s downwards movement and there is a bearish signal from On Balance Volume.
So yes. I expect tomorrow to be another downwards day.
And yes, “surprises to the downside” is a good warning.
Yes Ma’am! 🙂
So, like I said, the bear looked like it was taking it up the …..
But really she is just about to pounce!
Kevin, I gotta thank you for pointing out my lame mental capitulation a couple weeks back, where I literally went all in on the side of my preference with tight trail stops. This has been one of the best profit periods of my 36 years on the plant and 14 years in the business. I believe I top ticked it emotionally, which should have been everyone’s trigger to exit longs and/or short. So, Cheers!!!
I did? I vaguely remember suggesting that you capitulating to the long side must be a contrary indicator…I think.
Congrats on the stellar profits.
This just might create a wash out through Tuesday… then we shall see.
Look for a gap higher in vol instruments…
Bull flag in VX…
A VX move above 19.88 closes a critical leverage induced gap and tells you all you need to know… 🙂
I’ve cited specific candles (1min and 5min mostly) that show that single orders hit the order book 6-10 times the previous, without TWAP, VWAP, or other basic algo execution. Even today, if you look at the micro wave structure, there are two pennant/triangle shapes that try to follow through to the downside, but are met with irregular buy side orders to truncate the formation. The time blocks were 11:45, 12:16, and just recently, where it tried to follow through at 2:01, again at a round number pivot at 2750.
Yep! Yep! Yep! You CANNOT miss it. We of course expected it! 🙂
Thanks Chris. Nice and specific for me.
O.K. people. The battle for SPX 2750 is on!
The bulls had better hold it…or else!! 🙂
If we break 2710.51 today that’s all she wrote!
Love the play by play…… thanks Verne!
Most welcome Peter. We are positioned and calmly watching the play by play.
Good to hang with the forum today! 🙂
Short covering next hour is a chance
I have to say Andy Pancholi has been earning his keep lately. He has been spot on the last few turns! Man that report is expensive!! 🙂
Verne, Francisco invited me to the Quant forum in London. You going?
My daughter tore an Achilles tendon playing soccer and has surgery tomorrow. Gotta go up to Evanston and babysit for a week or two! Wish I could join the party! Let me know how it goes! 🙂
I think it is safe to say either a C or third wave down has arrived…! 🙂
So down to below 2700 ?
I don’t think so yet.
Unless the end of session data gives a bearish signal or has support from volume for today’s downwards movement.
For those of you who have been around awhile, you have to know that when I am expecting a bullish move and Mr. Market goes the other way that is seismic! lol!
Needless to say, exited my short 280 strike puts, holding 279 for the time being…. 🙂
Happy with my $275 avg buy and $280 spy sell now. Lining up buy limits all the way down to $230 currently.
Are those buys with an expectation that SPY goes up for the next week from here? Or buys for a short term (1-2 days max) bounce back up? Just curious. I personally am using pullbacks up to get more short, because Lara’s main count strongly indicates that there’s a lot more down coming soon.
Honestly, either or. If it does ramp up pretty nicely, I will sell them.
I do trust Lara’s counts and I am not much of a sniper and cannot stare at charts all day. Buy limits help me get positioned regardless of the outcome. I don’t mind taking losses at $275 if I am filling plenty more at $250, etc.
My options account, however, has been ‘closed’ for the past few weeks. Premium is out of control across the board.
Nice! Don’t forget to trail your stops….! 🙂
2763-2765 likely to hold this sell off temporarily, anyway. 50% and 78.6% overlapped fibo’s there.
Bounce ?
Kevin, my apologies for being short yesterday. I took the comments personally. While I’m not going to spend the time broadcasting some of our IP to explain the “manipulation,” I did want to highlight today’s systematic selling that began occurring when price hit the short term moving average at 10:57am at 280.07 on the spy. Notice on the entire decline the slope and speed was consistent and well defined with no interruption. It was not until the next round number pivot was approach at 276 that some “kissing” as we call it came in. That whole move is a great example of how algos work, and it further speaks to the lack of the liquidity in the market as well as the absence of strong big money hands.
Great example of comity Chris.
I also used to get so frustrated talking about central bank machinations as I could not understand why folk did not see it, especially active traders. David Einhorn of Greenlight Capital once gave a talk about how the Treasury issues buy orders to the exchanges, especially during a crisis, and it was a real eye opener. Even without any inside info, it seems to me if you are simply looking at the price action, even if you are not actually trading the moves, you cannot help but notice the unusual price action that so often occurs. The sad fact is that the vast majority of people do not seem to notice, and in fact tend to emphatically deny that any such market intervention exists. Not worth loosing sleep over bud. We trade those moves! 🙂
Thank you Verne, while I did not get to where I’m at by being courteous, Kevin deserved more respect than I afforded him yesterday, and I try to get better everyday. I only exude the effort to help others so they hopefully learn and loose less than they otherwise would.
That’s why we’re here bud! 🙂
That’s why I’m here. That’s why I try to provide specific’s and examples of why and how I strive to get edge.
Still waiting for the same on on this subject of “bankster manipulation”. Without that…????
BTW, Chris’s explanation is completely reasonable: the big$ money manipulates the market at micro-tf’s to support their positions in very low tf trades. That’s as old as market have existed. Begs the question above. How to identify in real time and use to get edge?
I’m all eyes and ears here. I love edge…
Thank you very much Chris. I greatly appreciate the decency and camaraderie shown here.
Thanks Chris. No harm, no foul, as the great Chick Hearn used to say.
When one of you can explain what I’m looking for re: “bank intervention”, and how I use that to get an edge, I’m interested. Go ahead, raise my intelligence. Examples and contra examples please.
You know what, I’m going to open myself up to potential embarrassment here and admit that I don’t see it either.
I see when price moves strongly seemingly without any opposition to it’s movement, but I’m not seeing clear instances of bank intervention.
I would also be very interested in being educated on this. But for me to learn I need very clear and specific examples, pointed out on a chart. I’m a very visual learner.
The thing I’m getting stuck on is the difference in candlestick appearance between a normal buying hour or so, and bank intervention. I just don’t see the difference.
And I’m also factoring in the very light volume (going on for years now). I reason that with light volume any larger players placing large orders are going to have a big effect on the markets. Which may make price move quickly. I’m guessing that’s what you are referring to Verne and Chris?
You don’t know how grateful I am for that admission Lara. “Gee, I’m not the only one!”.
Thank you.
I’m also approaching this from a perspective of considering banks buying and selling in this market as just another large player. And one of a declining number of large players.
As a bull market nears it’s end in a fifth wave, volume does normally decline. The third wave has stronger volume, fifth waves usually have weaker volume and can be identified by their volume.
And so with much weaker volume the activities of large players may be more pronounced.
That’s my two cents worth. So what I may be seeing as a normal part of a fifth wave may be interpreted as bank intervention?
From an EW perspective, I see the bank involvement as a normal part of the end of a Grand Supercycle wave. There should be something off and wrong towards the end of this wave. This intervention may be one of those things.
The DJTA, NYA, and RUT are all below their 200 day moving averages. DJIA, SPX, and NASDAQ are holding just above. DJTA has made a classic move below the 200 day ma and return to just tag it now it is falling away again. None of these circumstances / patterns give me confidence in any long lasting rally. We are not that far from the February 2018 lows. If these major averages do so, it could be ‘look out below’ time.
Have fun. Make money. Be careful.
This photo says it all. The Polar Bear is the most powerful land mammal in the world. Right now momma looks like she might be taking it up the ……. However, she is on the prowl and ready to pounce on the unsuspecting victim of her wrath.
Da story of Da Bears
Yes indeed Sir Rodney….the long “kiss” good-bye…! 🙂
For the immediate bullish case, 2780 has to hold imho….
A move below and I exit short leg of bull put spreads….
Verne, you see all the margin calls that will occur below 2700? That occurrence alone will send it to 2400 range me thinks.
Yes indeed Chris. You know what else? All the ETFs that are going to have to re-balance and unload the FANG cohort. This could get VERY ugly people!
Look for them to defend 2750 with some serious cash dumps…
Equal weighted FAANGM ticker, hourly. Scribbled over the 61.8% and has turned, at least temporarily and hourly trend back to neutral. But it’s looking a bit “complete” to me. Dropping below the 38% line would seal the deal in my book. These are the vastly valued “market leaders” generally and the ones it is said the central banks have poured their money into, so they bear (yuck yuck) watching.
I am reminded of my previous T shirt order, “I hate B waves.”
I am changing that order to a T shirt that reads on the front, “B Waves Are Frustrating” and on the back, “C Waves Are Money Waves”.
I am continuing to sit on the sidelines similar to my approach throughout Intermediate Wave 4. This time, however, I may try to catch this next C wave down because I think it will go below that last low of 2710. If I miss it, so be it. I will catch the next wave up to SPX 3600 for all its worth. That is a 29% move up from current levels. I am hoping Primary 4 ends closer to 2600.
Possible targets are 2700, 2550, and 2350. We might get a clue as to which of those levels will hold by looking at the reaction of RUT to corresponding levels. Considering P2 was relatively shallow, I think at least 2550 is in play.
Expect the 2800 pivot battle to continue to rage. I do think the bears already lost it short term owing to yesterday’s close above it, and the failure to take out that level in futures. Probably just sound and fury this morning ahead of move higher…. 🙂
I tend to agree, the current high point in this SPX swing up is in no-man’s land. The 50% and 62% beckon overhead. I’d guess Friday we get another strong day up to one of those levels, and that completes this overall B/X wave. But it’s only an informed guess. If price breaks the last hourly swing low at 2782 (which is right at a minor swing 50% fibo as well), then my bias switches fairly strongly to “B/X is over”. That’s a key level to watch imo.
We have a Pancholi turn date today so I would be surprised if we do not in fact get an interim top today. I suspect not too many traders are going into this weekend long the market. A high tomorrow would be quite an opportunity to get positioned cheap….
The move above the 2800 pivot points to higher prices. Note how the decline in futures so far remains above that pivot. There is a reason for that. The thrust upward from the triangle was one of the most ferocious Ihave ever seen . How often have you seen a 500 point ramp in the DJIA?
Exactly!
They are rare, and point to something quite unusual, and typical of bear markets. In fact, some refer to them as bear market rallies, or dead cat bounces. Another common explanation is short covering. While all these may be the case, is that all that is going on?
If you believe that, you might want to look into Treasury orders tendered directly to the exchanges. What we saw this week was the violent arrest of an impulsive decline that morphed a possible fourth wave triangle into what could be some kind of expanded flat in a classic ambush of any trader expecting a downward break, and not alert to the possibility of a sharp upward thrust to produce an ABC correction. The wave principle includes the behaviour of the banksters, whether you see and understand it or not. It cannot be explained. It can only be observed. And any observant and intelligent person trading these markets the last few years could not possibly fail to observe the relentless intervention. Bottom line?
The ABC is probably not done, and we could see around 2850 or thereabouts to complete the c wave of the upward B.
The subsequent C wave down will be impulsive, banksters or not. It will take out 2800 on the first wave down and do so with authority. I think it will fall farther and faster than people expect, and probably be done by next Friday, ahead of the final wave up to end ths bull market.
Happy Trading!
Hi Verne
I always find your dialogue measured and thorough.
From a novice being me you mention the downswing being done by next Friday ( tomorrow ? They are crazy swings. Which would imply the Dow to push up say 500 points and down again by somewhat a larger move ?
I’m just trying to get my head around these daily ranges of 50 points
Thankyou again
Sorry about that. I meant Friday next week.
Friday week 2700 ? Thankyou again
At the very least imho….
Geez
Ping.
Pong.
Pong !
Thank you for all you contribute Kevin .
Over hand smash! I love ping-pong. However, after playing it almost every working day for about 18 months back in 2009-2011…I developed severe tendonitis in my peroneal tendons in my feet. I had to stop, it was painful just to walk. Six months later I was fine. No more ping pong for me.
You’re welcome Fred.