
Upwards movement indicates an alternate Elliott wave count looks more likely.
Today two Elliott wave counts are again presented as options.
Summary: This upwards bounce may continue now to about 2,895 or above. It may last a few more days as intermediate wave (B) or (X) within primary wave 4.
A primary degree correction should last several weeks and should show up on the weekly and monthly charts. Primary wave 4 may total a Fibonacci 8, 13 or 21 weeks. The preferred target for it to end is now about 2,717 but this may be a little too low. Look for very strong support about the lower edge of the teal trend channel on the monthly chart.
Primary wave 4 should be expected to exhibit reasonable strength. This is the last multi week to multi month consolidation in this ageing bull market, and it may now begin to take on some characteristics of the bear market waiting in the wings.
The final target for this bull market to end remains at 3,616, which may be met in October 2019.
New updates to this analysis are in bold.
The biggest picture, Grand Super Cycle analysis, is here.
Last published monthly chart is here, video is here.
ELLIOTT WAVE COUNT
WEEKLY CHART
Click chart to enlarge.
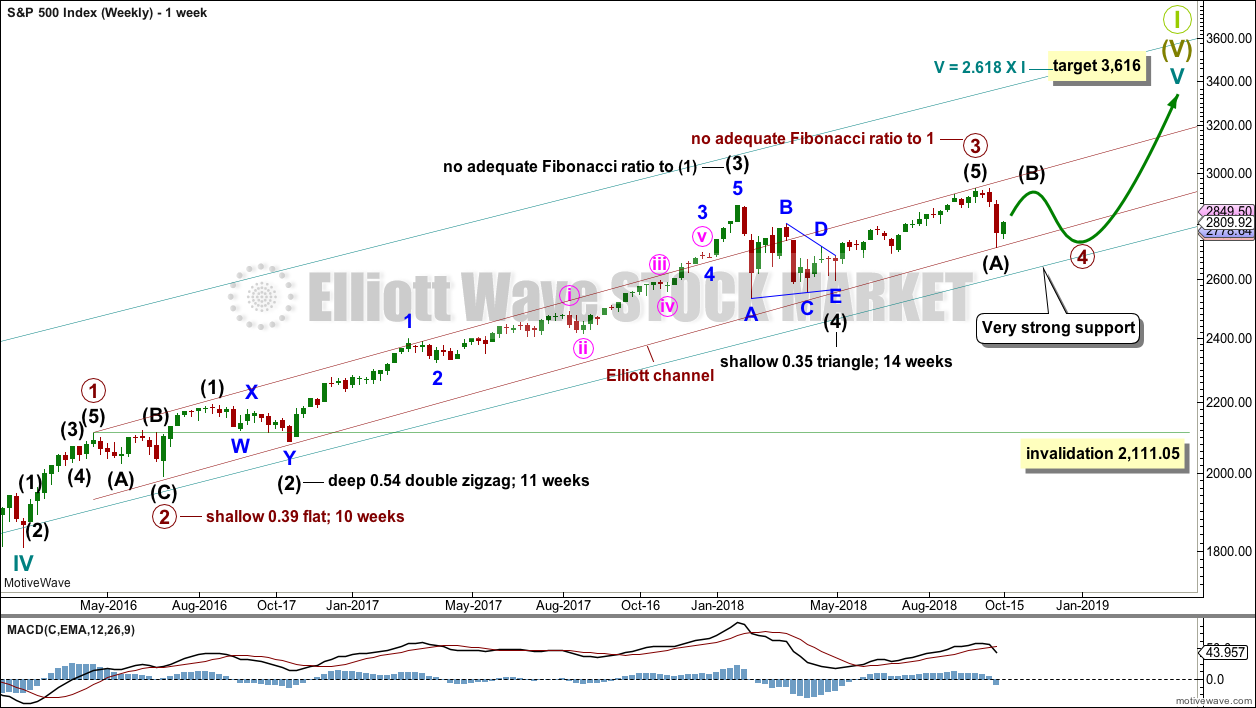
Cycle wave V must complete as a five structure, which should look clear at the weekly chart level and also now at the monthly chart level. It may only be an impulse or ending diagonal. At this stage, it is clear it is an impulse.
Within cycle wave V, the third waves at all degrees may only subdivide as impulses.
Within primary wave 3, there is perfect alternation and excellent proportion between intermediate waves (2) and (4).
The channel is now drawn about primary degree waves. The first trend line is drawn from the ends of primary waves 1 to 3, then a parallel copy is placed upon the low of primary wave 2. Primary wave 4 may find support about the lower edge of this maroon channel. At the end of last week, that is exactly where price bounced up. The overshoot of the upper edge of this channel by the end of intermediate wave (3) looks typical. For the S&P, its third waves are usually the strongest portion of an impulse; they often exhibit enough strength to overshoot channels.
Fourth waves do not always end within channels drawn using this technique. If primary wave 4 breaks out of the narrow maroon channel, then it may find very strong support about the lower edge of the teal channel. This channel is copied over from the monthly chart and contains the entire bull market since its beginning in March 2009. While Super Cycle wave (V) is incomplete, this channel should not be breached.
Primary wave 4 may not move into primary wave 1 price territory below 2,111.05.
When primary wave 4 may be complete, then the final target may be also calculated at primary degree. At that stage, the final target may widen to a small zone, or it may change.
At this stage, the expectation is for the final target to be met in October 2019. If price gets up to this target and either the structure is incomplete or price keeps rising through it, then a new higher target would be calculated.
DAILY CHART
Click chart to enlarge.
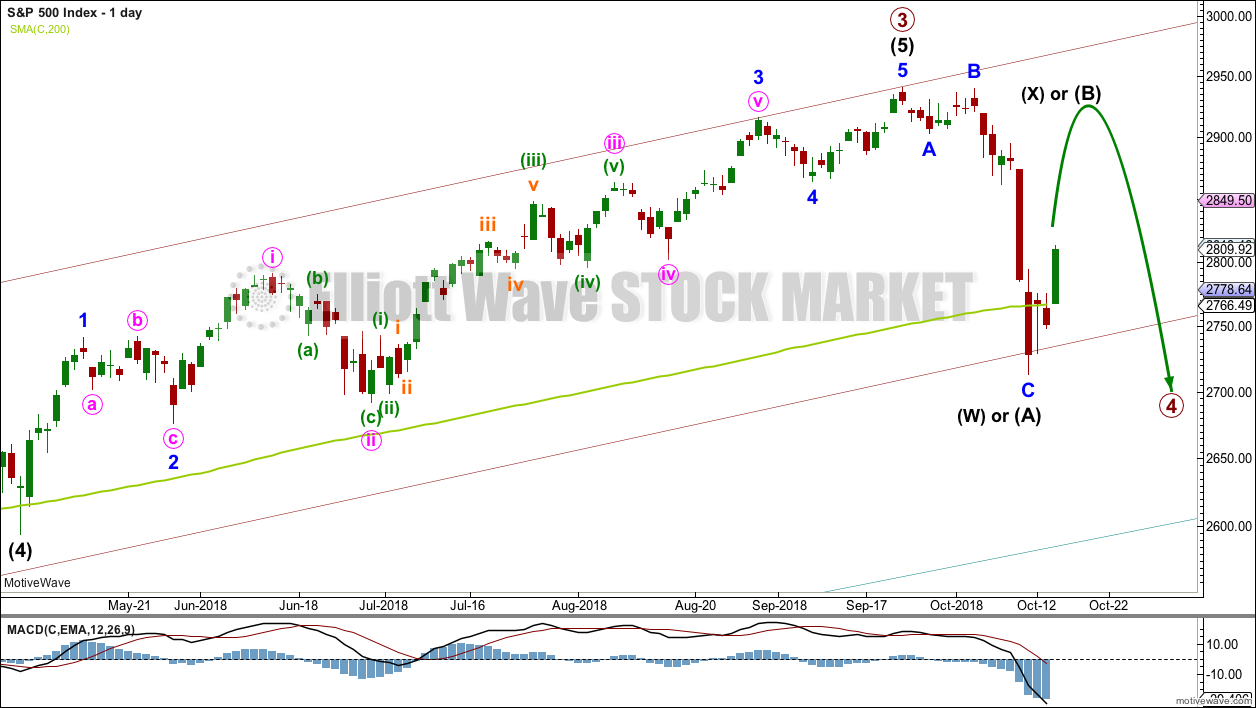
Primary wave 4 would most likely end somewhere within the price territory of the fourth wave of one lesser degree. Intermediate wave (4) has its price territory from 2,872.87 to 2,532.69. Within this range sit two Fibonacci ratios giving two targets. The 0.236 Fibonacci ratio has now been met and passed.
The target for primary wave 4 at 2,578.30 would expect an overshoot of the teal channel. This target may be too low; price may find support at the lower edge of the channel. However, as primary wave 4 should be expected to exhibit reasonable strength, it may be able to overshoot the channel and that would look reasonable.
Primary wave 2 unfolded as a shallow regular flat correction lasting 10 weeks.
Primary wave 4 may have begun with a zigzag downwards. This may be a three wave structure for intermediate wave (A) of a flat or triangle for primary wave 4, with a triangle more likely as that would provide alternation with the flat correction of primary wave 2. The zigzag may also be labelled intermediate wave (W) of a double zigzag or combination for primary wave 4.
All of a flat, triangle, or double combination may include a new high for intermediate wave (B) or (X) as in an expanded flat, running triangle or wave (X) within a combination. There is no upper invalidation point for this reason.
A double zigzag would expect to see a relatively shallow and brief bounce for intermediate wave (X), so that the whole structure of a double zigzag has a strong downwards slope.
Primary wave 4 may not move into primary wave 1 price territory below 2,111.05.
HOURLY CHART
Click chart to enlarge.
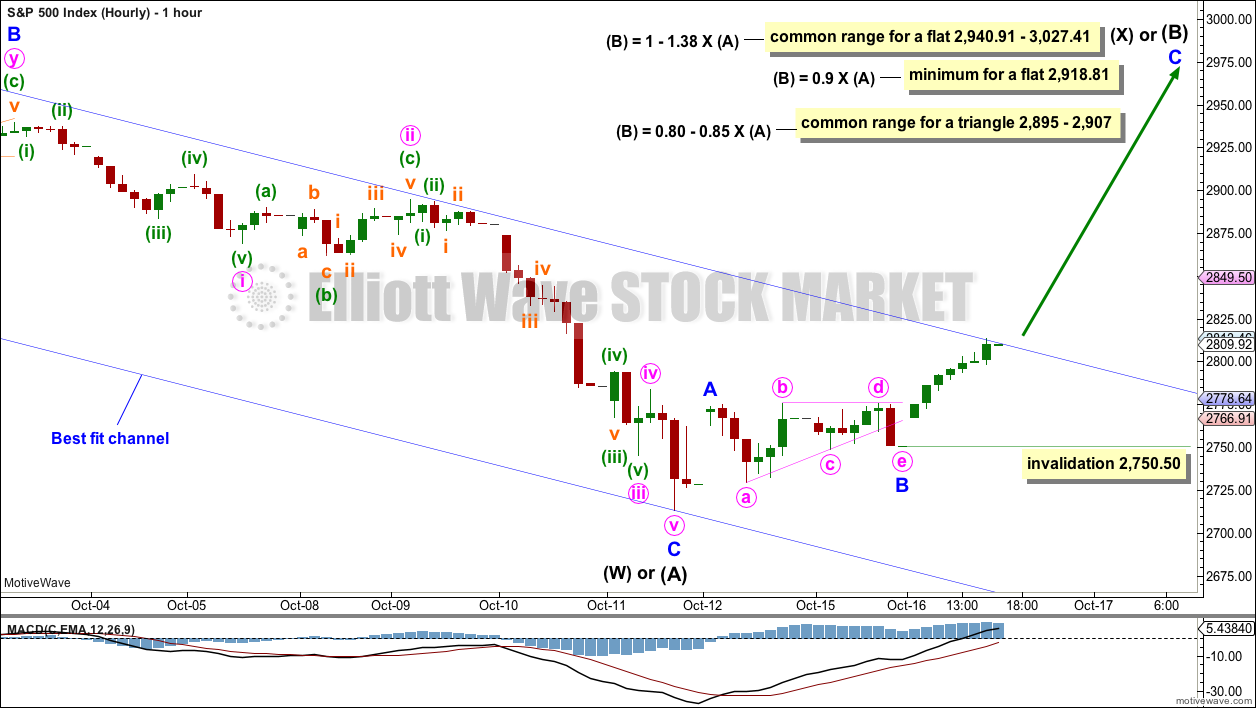
Intermediate wave (A) may be a complete zigzag. Intermediate wave (B) or (X) may be underway as a multi day bounce within primary wave 4.
This chart considers multiple possible structures for primary wave 4: as a triangle, combination, double zigzag or flat (least likely). Within a combination or triangle, there is no minimum length for intermediate wave (B) or (X).
The blue channel is slightly adjusted today. Draw the first trend line from the end of minor wave A (seen on the daily chart), then place a parallel copy up to contain all of minor wave B. The upper edge is about where upwards movement ended for this session. If price continues to move higher when markets open tomorrow, then the upper edge of this channel may provide support. A breach of this channel would add confidence to this main wave count.
Within minor wave C, no second wave correction may move beyond the start of its first wave below 2,750.50.
ALTERNATE DAILY CHART
Click chart to enlarge.
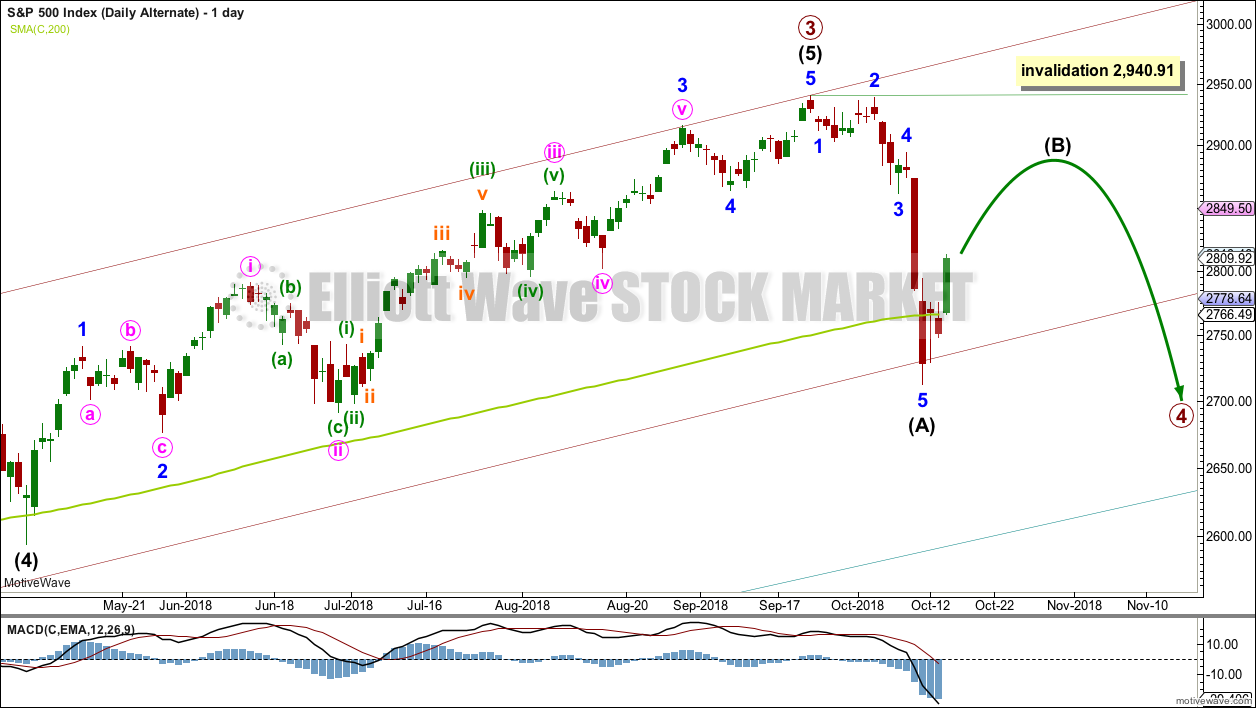
It is also possible to see intermediate wave (A) as a complete five wave structure. This wave count would expect that primary wave 4 may be unfolding as a zigzag, which would provide structural alternation with the flat correction of primary wave 2.
This wave count is judged today to have a slightly lower probability than the main wave count due to the disproportion between minor waves 2 and 4 within intermediate wave (A).
If intermediate wave (A) subdivides as a five wave structure, then intermediate wave (B) may not move beyond its start above 2,940.91.
Intermediate wave (B) may unfold as any corrective structure. It is most likely to be a zigzag, but it may also be a flat, combination, triangle or multiple zigzag. It would most likely last several days to a few weeks and may be complicated and time consuming.
ALTERNATE HOURLY CHART
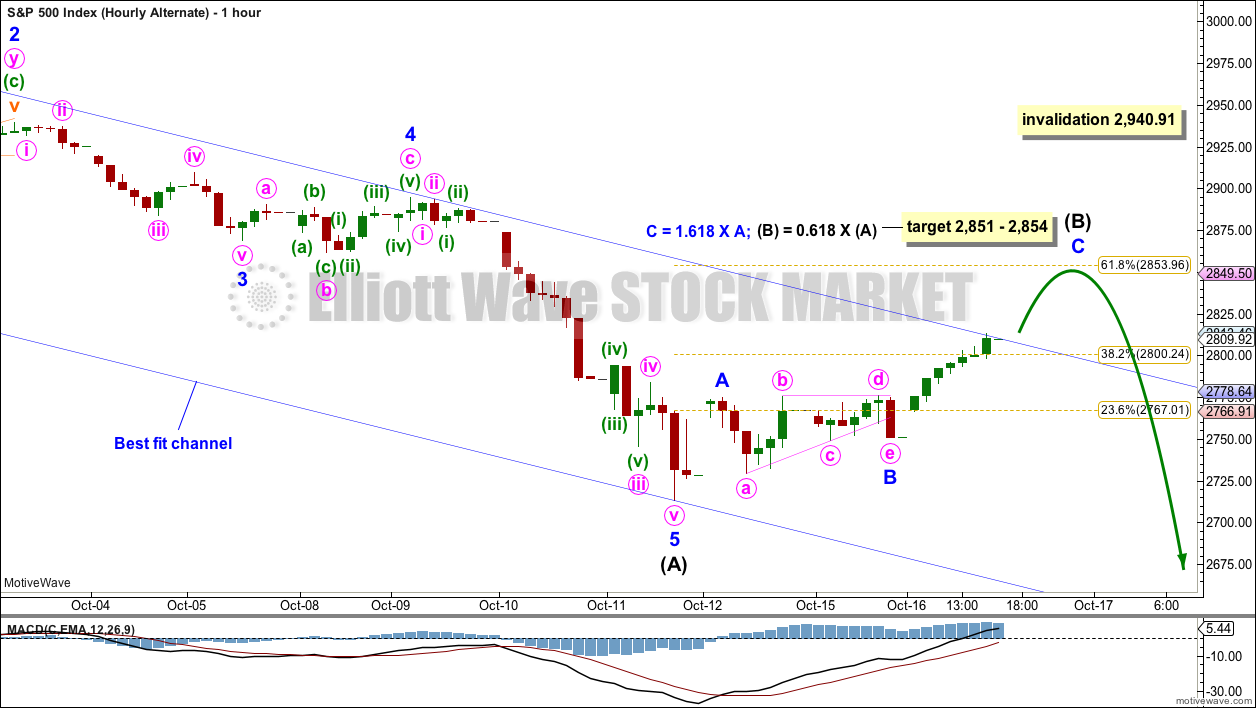
Click chart to enlarge.
At this stage, the degree of labelling within intermediate wave (B) is left as labelled at minor degree. But it must be understood that this may be wrong and that it may need to be moved down one degree if intermediate wave (B) takes longer and turns into a complicated time consuming consolidation.
A zigzag upwards may be unfolding. A target is calculated at two wave degrees giving a reasonable probability. If this target is met quickly, then the degree of labelling within intermediate wave (B) should be moved down one degree.
When a zigzag upwards is complete, that may be the whole of intermediate wave (B); or it may only be minor wave A of a flat or triangle, or minor wave W of a combination or double zigzag.
TECHNICAL ANALYSIS
WEEKLY CHART
Click chart to enlarge. Chart courtesy of StockCharts.com.
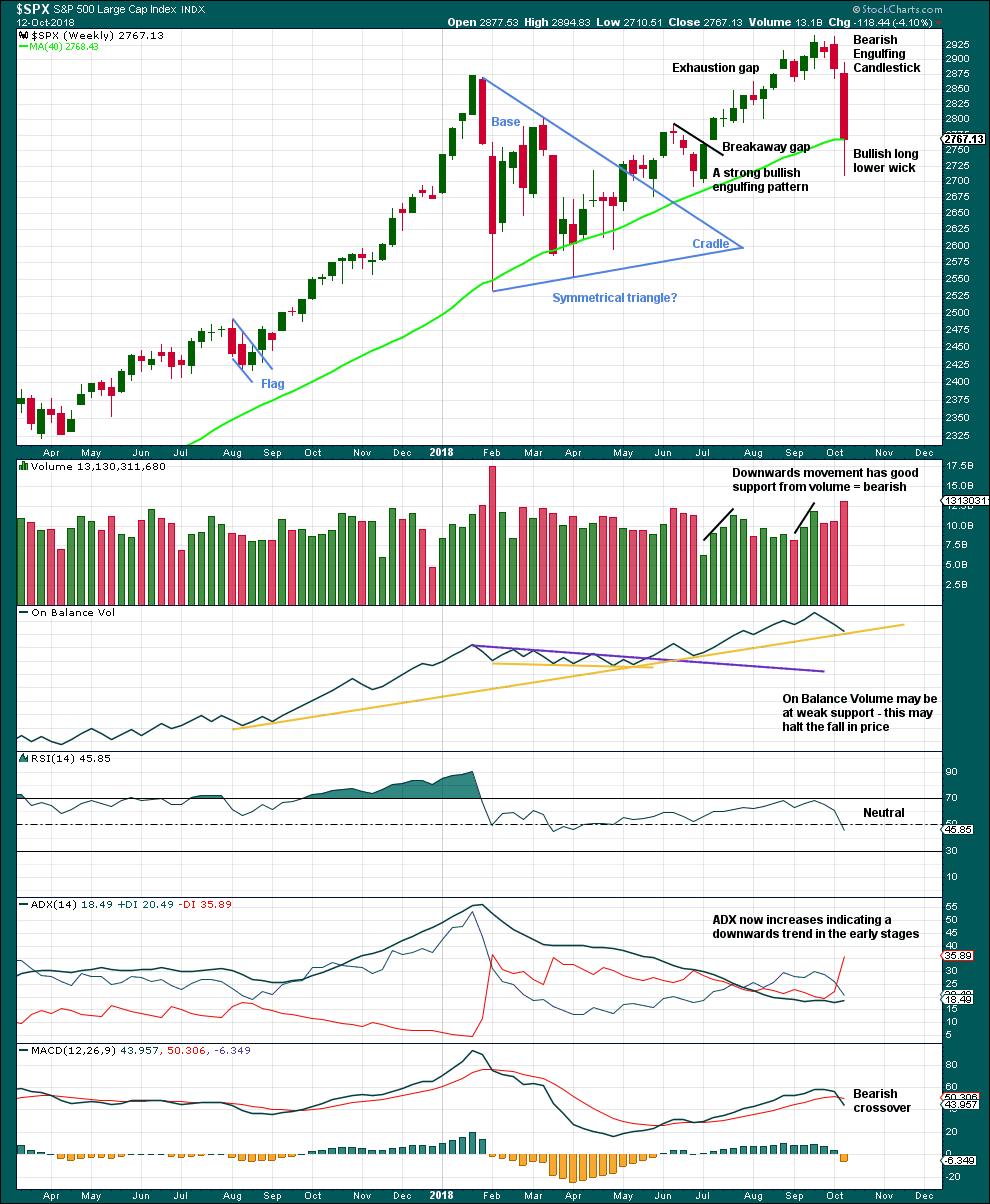
The symmetrical triangle base distance is 340.18. Added to the breakout point of 2,704.54 this gives a target at 3,044.72. This target was not met; it was too optimistic.
The long lower wick on this weekly candlestick suggests a bounce this week.
DAILY CHART
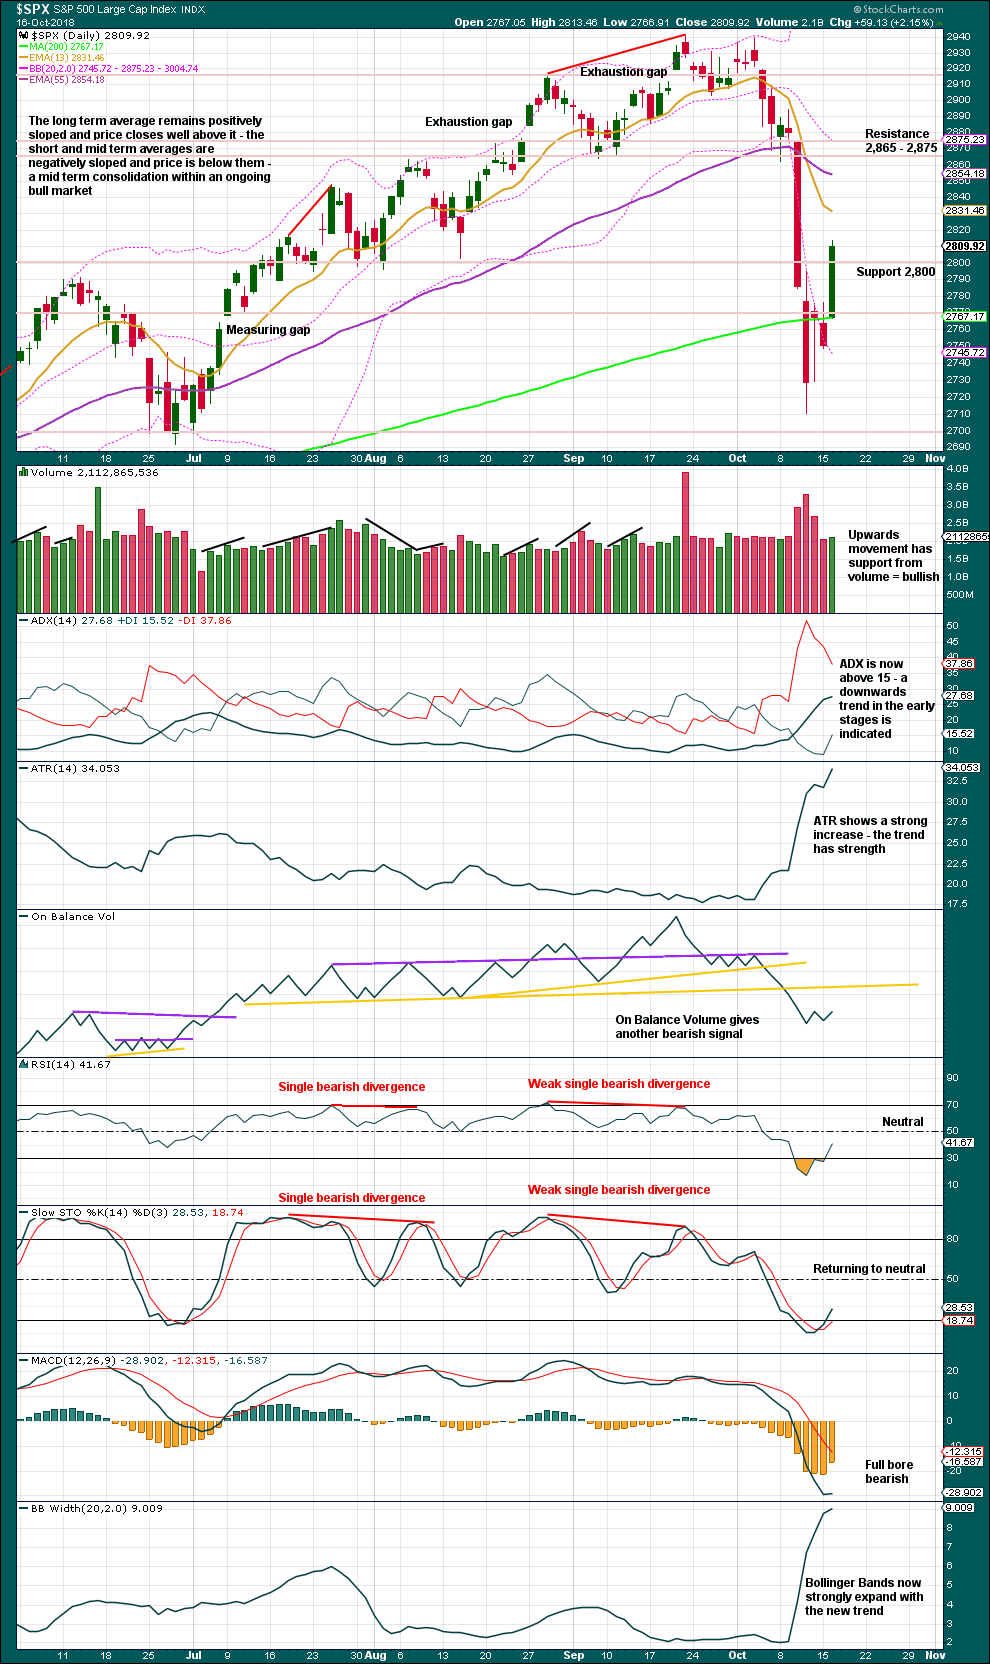
Click chart to enlarge. Chart courtesy of StockCharts.com.
A strong upwards day is fairly bullish. Despite no bullish signals at the low, this upwards day indicates a stronger bounce has most likely arrived. Price has closed fairly close to the high for this session and volume supports today’s upwards movement. It looks like tomorrow may see upwards movement continue. Next resistance is about 2,865 – 2,875.
If upwards movement continues to resistance and Stochastics reaches overbought, the bounce may end there. This bounce may not move in a straight line; it may be choppy and overlapping.
VOLATILITY – INVERTED VIX CHART
WEEKLY CHART

Click chart to enlarge. Chart courtesy of StockCharts.com. So that colour blind members are included, bearish signals
will be noted with blue and bullish signals with yellow.
Primary wave 4 has now arrived and is showing reasonable strength. There is continuing mid term bearish divergence this week with inverted VIX making a new low below the prior swing low of the week beginning 25th June, but price has not yet made a corresponding new low.
As primary wave 4 continues this weekly chart may offer a bullish signal at its end.
DAILY CHART
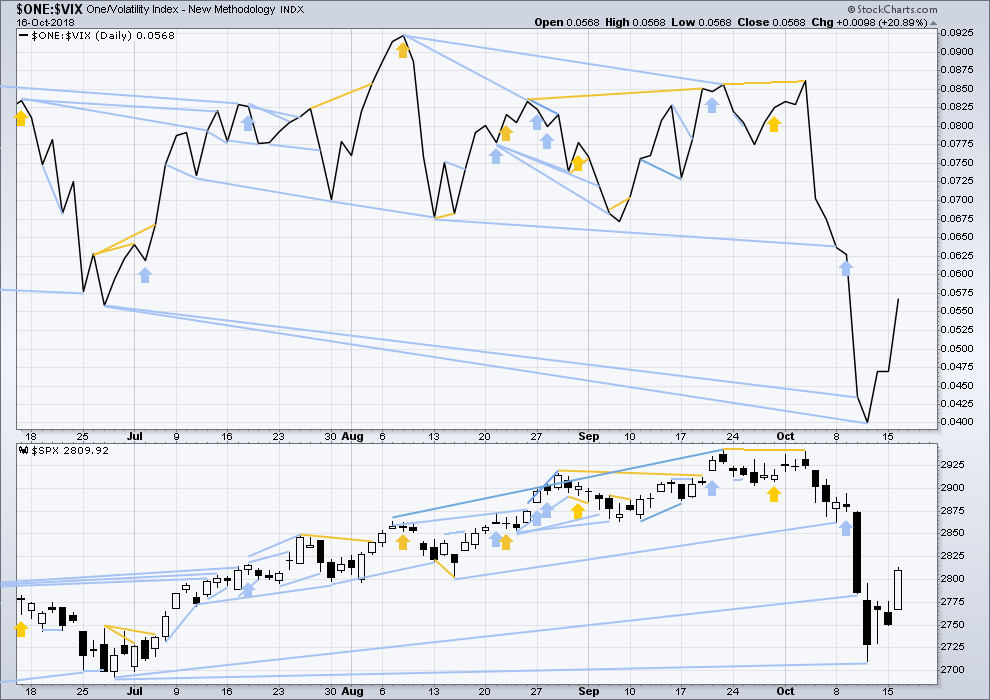
Click chart to enlarge. Chart courtesy of StockCharts.com. So that colour blind members are included, bearish signals
will be noted with blue and bullish signals with yellow.
Normally, volatility should decline as price moves higher and increase as price moves lower. This means that normally inverted VIX should move in the same direction as price.
Today price has moved higher and VIX has shown a normal corresponding decline in volatility. There is no new short term divergence.
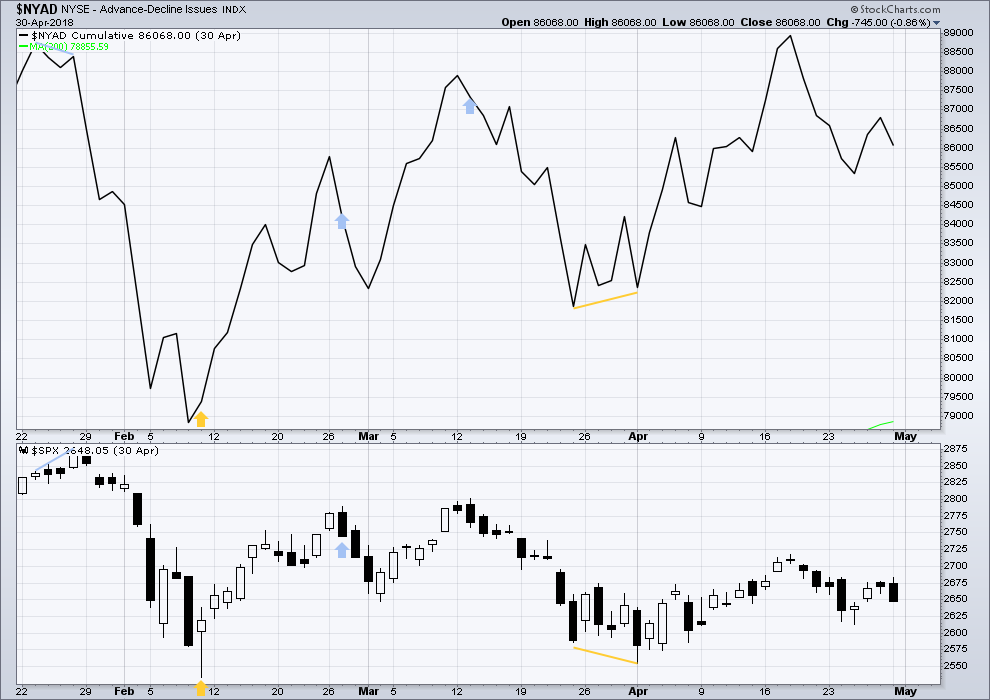
BREADTH – AD LINE
WEEKLY CHART
Click chart to enlarge. Chart courtesy of StockCharts.com.
When primary wave 3 comes to an end, it may be valuable to watch the AD line at the weekly time frame as well as the daily.
Last week the AD line has made a slight new low below the prior swing low of the week beginning 25th June, but price has not. This mid term divergence is bearish, but it is weak.
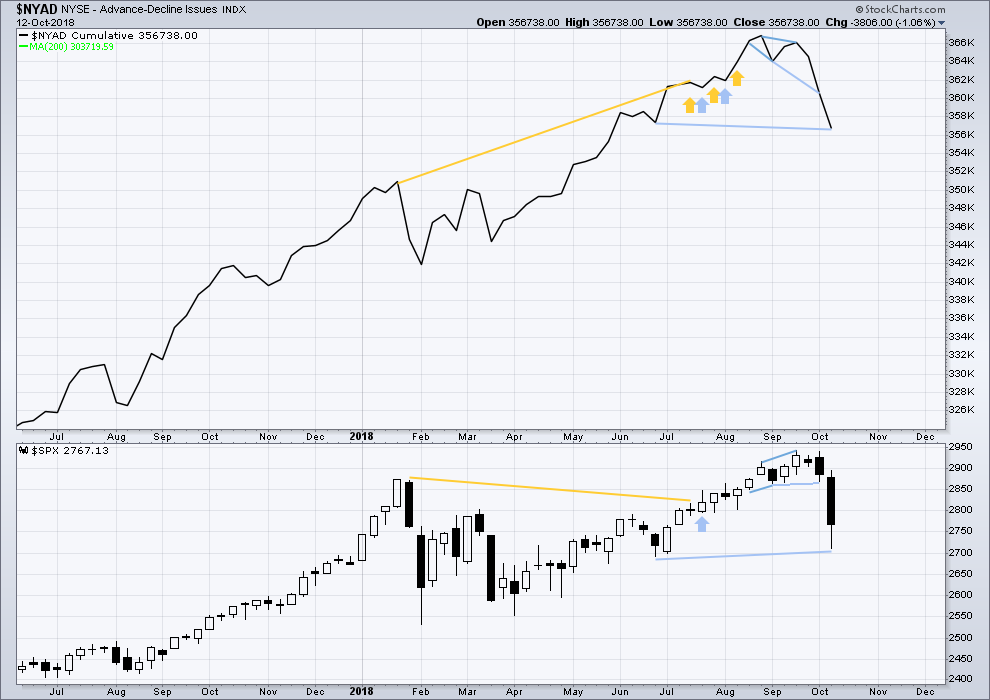
DAILY CHART
Click chart to enlarge. Chart courtesy of StockCharts.com.
There is normally 4-6 months divergence between price and market breadth prior to a full fledged bear market. This has been so for all major bear markets within the last 90 odd years. With no longer term divergence yet at this point, any decline in price should be expected to be a pullback within an ongoing bull market and not necessarily the start of a bear market. New all time highs from the AD line on the 29th of August means that the beginning of any bear market may be at the end of December 2018, but it may of course be a lot longer than that. My next expectation for the end of this bull market may now be October 2019.
Breadth should be read as a leading indicator.
Upwards movement today has support from a reasonable rise in market breadth. There is no new divergence.
Both mid and small caps for Friday have long lower wicks. This may indicate a small bounce to continue for a very few days.
DOW THEORY
The following lows need to be exceeded for Dow Theory to confirm the end of the bull market and a change to a bear market:
DJIA: 23,344.52.
DJT: 9,806.79.
S&P500: 2,532.69.
Nasdaq: 6,630.67.
ANALYSIS OF INTERMEDIATE WAVE (4)
TECHNICAL ANALYSIS
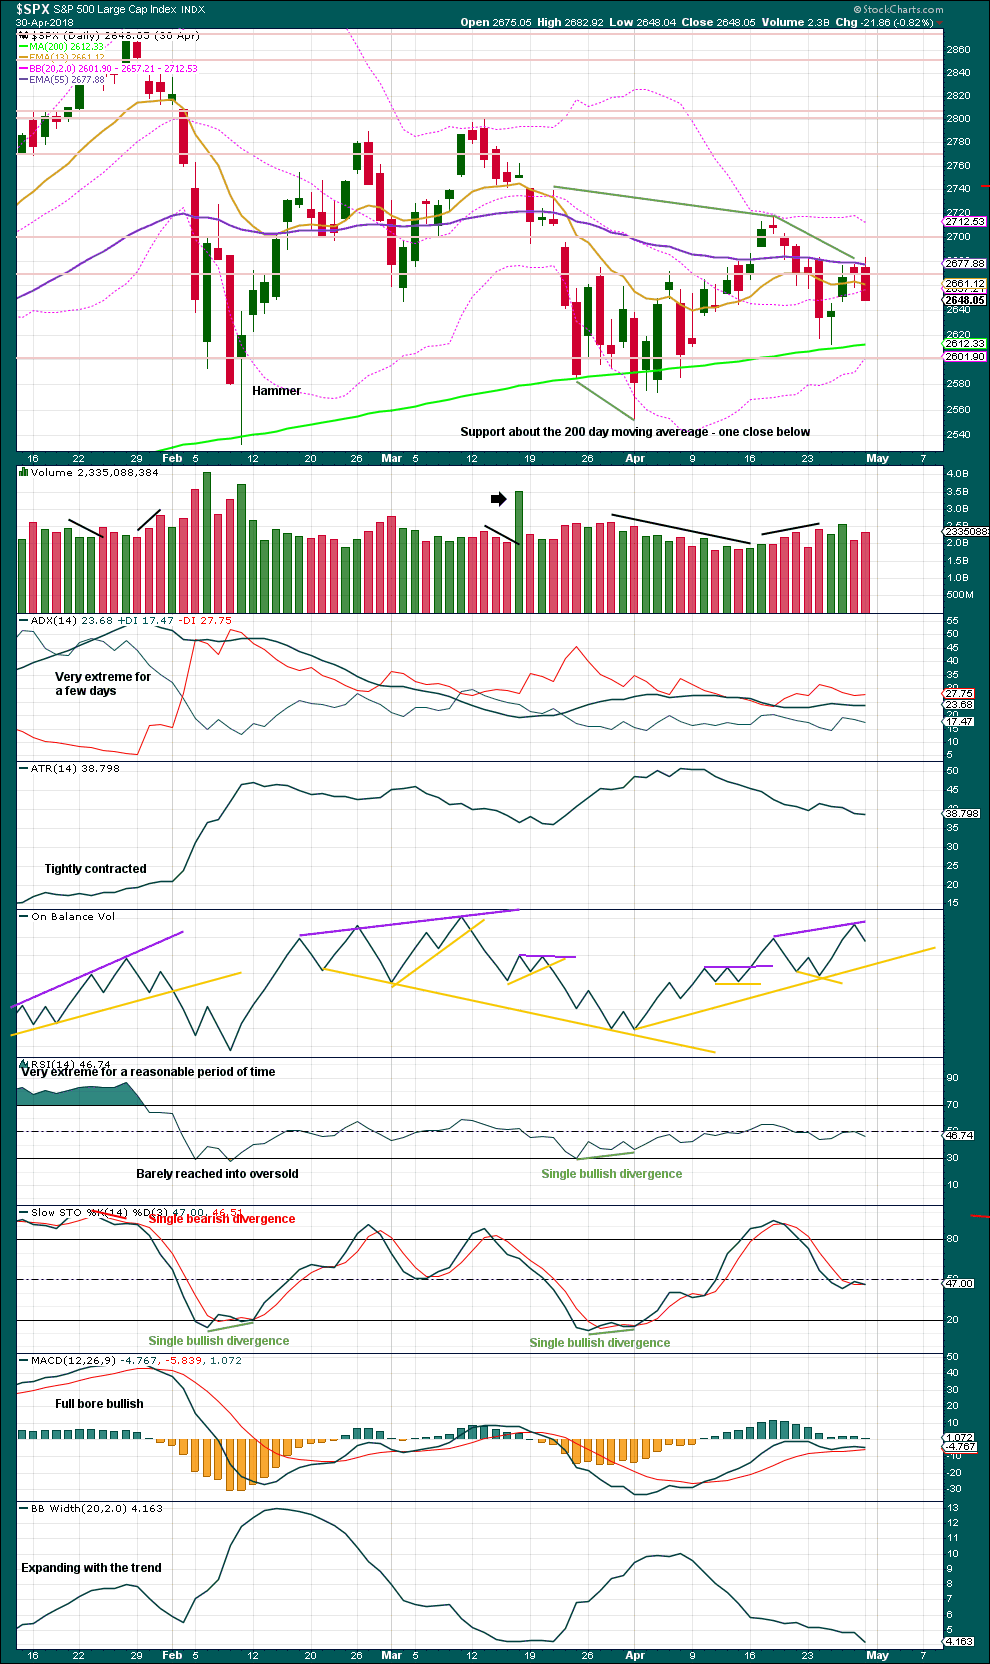
Click chart to enlarge. Chart courtesy of StockCharts.com.
Intermediate wave (4) was a large symmetrical triangle. The deepest wave was the first wave. At its low there was a clear candlestick reversal pattern and bullish divergence between price and Stochastics.
RSI barely managed to reach into oversold.
The current correction for primary wave 4 may behave differently, but there should be some similarities.
It is expected that primary wave 4 may be stronger than intermediate wave (4).
VIX
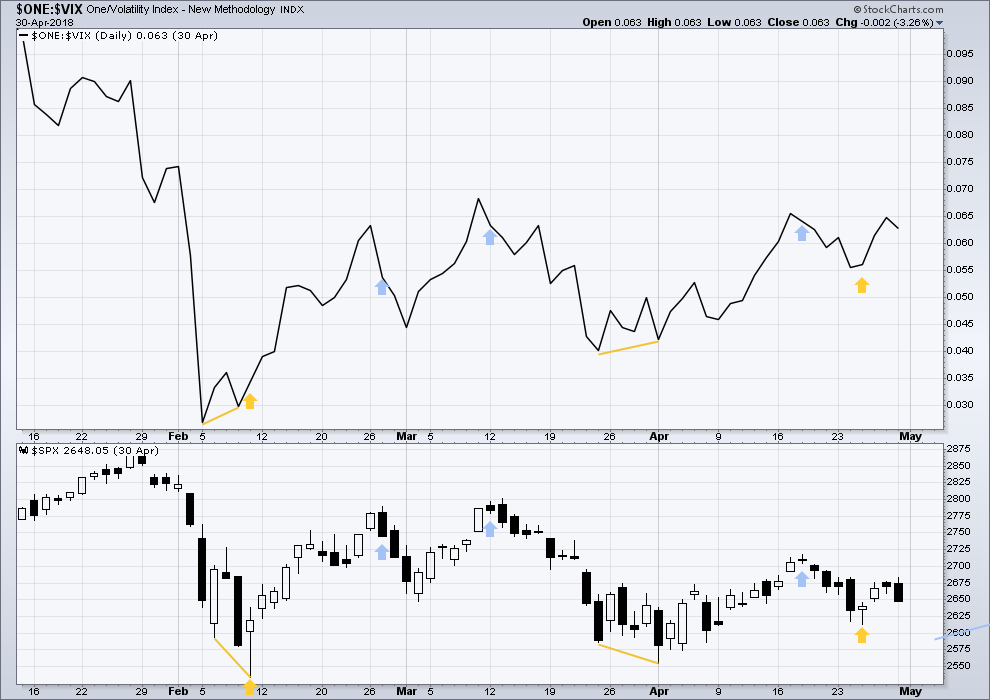
Click chart to enlarge. Chart courtesy of StockCharts.com.
This is a daily chart.
At the two major lows within intermediate wave (4), inverted VIX exhibited single short term bullish divergence.
At highs within intermediate wave (4), inverted VIX exhibited one single day bullish divergence with price.
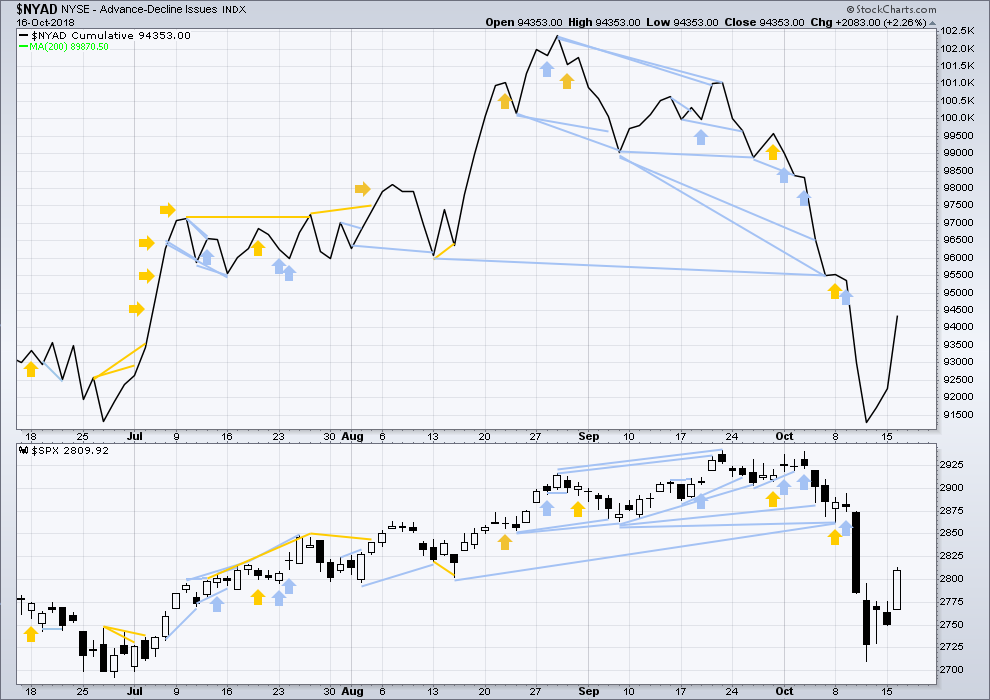
AD LINE
Click chart to enlarge. Chart courtesy of StockCharts.com.
This is a daily chart.
At the two major lows within intermediate wave (4), there was bullish divergence between price and the AD line. At the two major highs within intermediate wave (4), there was each one instance of single day bearish divergence.
Published @ 07:44 p.m. EST.
—
Careful risk management protects your trading account(s).
Follow my two Golden Rules:
1. Always trade with stops.
2. Risk only 1-5% of equity on any one trade.
Sorry for being late guys. I’m having some issues with Motive Wave 🙁
This is the main hourly (I know, the label on the chart is wrong, that’s an issue)
If a zigzag is unfolding higher, then it may be ready to move into a third wave tomorrow.
And for the alternate, if intermediate (A) was a five down and now there is intermediate (B) up, it could be a double zigzag. Which may move to it’s end tomorrow.
Thank you. To confirm, is the main hourly still within Primary 4?
Which way does it break, up or down?
How are the /NQ futures down .86% and QQQ positive?
Maybe because NQ’s represent over 3,000 companies and Q’s comprise of the top 100?
The issuers of some of these ETFs are commom criminals, engaging in outright fraud.
SVXY and UVXY are supposed to be exact inverse instruments. Look at the glaring difference in price action yesterday.
The SEC is asleeo at the switch!
Lol, Verne. Exact, hahahahahaha.
You noticed too! 🙂
Thought I was going to be rich holding a chunk of UVXY that last big move down but the SOBs used some gotcha legal maneuvering to not pay up. Don’t know why they are still in business–should be in jail.
No question about it. The VIX leveraged instruments, particularly SVXY and UVXY are managed by crooks at Pro-Shares. They change the rules in the middle of the game, manipulate the stated correlation of the instruments to the actual movement of VIX and each other, and in my view in some cases absolutely fabricate the readings seen on the charts. The failure of UVXY to correspondingly match the spectacular collapse of SVXY with a similar upside move during the February “Volocaust” exposed these instruments for the fraudulent scam that they really are. I no longer trade them, neither should any one else imho.
NQ trades until 4pm, where QQQ trades until 3pm. Yesterday due to Netflix earnings, NQ jumped from 3 to 4 pm and closed much higher than QQQ’s close at 3pm. So today QQQ is up while NQ is down. Hope that helps
yeah I screwed that up. You’re right, fair value separation.
AMTD had bounced off a 50% and squeezed for many (10+) hours in a box (49.4 to 51), and is just breaking up out of the box…
Watching oil. Is it going to hold $69 or go down to $62. I think if B wave is over oil heads to 62. If B wave is yet to come I think oil can hold 69. I know they are different markets but it seems like they have some reasonble correlation most of the time except for when they done;.)
—— when they don’t;.)
I have very significant fibo support at 69 in /CL, both a 61.8% and a 78.6%. It may not hold but if price turns off it, I think the potential for holding is there, for at least some level of rally.
The advance/decline ratios across SPX, NDX and RUT continue to be very ugly. For me, that cast’s a lot of doubt on any little intra-day rally here. Though the numbers can change of course as a rally develops. Just a sea of decliners, overall.
Dude, massive bankster candle at 10:47am. They are getting super smart, they stay out when risk parity, var, global macro, and CTAs are systematically selling, and once that’s over they ramp it. Insane…..
So for one minute they took control of the market? Is that what you are saying? And if so…how does one minute of buying enable “them” to control the market? Why did they choose that particular minute? And did they conspire, as in, multiple banks are coordinating down to the minute/second what they are going to do? What actual data do you have about who exactly was buying during that single minute? Or are you just projecting what “must have happened”, by nature of the candle itself? Maybe if you could show a chart and explain what it is that you see that is so unique and revealing of “bankster manipulation”?
Look at the depth of the order book and do some work your self…..it’s as plain as day. And don’t be so GD offensive with the “conspiracy” bs. It ain’t no conspiracy. Apologies for triggering you again, I’ll keep my thoughts and informational data points to myself while continuing to churn out gains.
I didn’t use the word “conspiracy”. I used the word “manipulation”, and I thought the heart of your issue is that “banksters are manipulating the market”.
If that’s not correct, what IS a bankster bar, and why and how is it significant?
You didn’t “trigger ” me any more than I am continuously “triggered”, meaning, when someone makes statements about the market I don’t understand, I ask questions.
My expectation about statements about the market is that such will be supported with some combination of data, explanation, examples…something. Simply saying “X is true and do you own work” doesn’t float my boat. In this case it’s even more challenging: I don’t even understand what exactly “X” is supposed to be.
Chris my friend, you are wasting your time….
Be nice please people.
Remember, the Grandmother rule. Especially when someone says something you find annoying.
Is the B wave over or yet to come?
Per the daily chart above, SPX is still operating within the B or X wave up. Whether it’s complete now is the trading question of the day, I suppose. It’s current high water mark isn’t close to a fibonacci retrace level. That makes it suspect in my book. If price gets above yesterday’s high, I’ll be watching for possible turns at 2826.3 and/or 2853.5, the 50% and 61.8% retrace levels of the entire down move from the ATH.
Looks we may have a small 5-wave impulse down. Revisit of 2800 and then…?
Or not?
I think this original wave count from Lara could still be valid. Maybe Lara could verify that? Or strike it down?
The formal triangle may have been invalidated but the coiling action has not imho. I have never seen a thrust from this price pattern that was not a terminal move, ultimately resulting in a reversal and lower low. Of course there is a first for everything! 🙂
Well, technically, yes. Except now for minute c it doesn’t look like a good five today.
The reason why I discarded it is minor 4 is now too deep, too much of a breach of the channel. It just doesn’t look very right.
But yes, technically still a valid option and one I’m still following, and would again publish if it shows itself to be true.
Just listened to a vendor hustling elliott wave based trading advice (specific trades), who is on CNBC every week or more. His macro level SPX count is completely erroneous, indicating that the current action is still part of a massive 4 that started with last January’s move down. Beware folks: there aren’t many people on the planet with the chops required to get this stuff right. Which is one of the reasons EW gets such a bad name: 99% of the practicioners get it wrong! Lara’s the ace and the benchmark for all others, afaiac.
You are so right. I got caught up with EWI, elliottwave international. I think they know all the Elliot rules, but they have such a bearish bias that they always get the bullish times wrong. It’s like they have a bias to what they think is happening and make a wave count to justify there position. Unfortunately, that happens when you watch the news. Lara, I think she said doesn’t even watch news. She seems to be able to ignore all the biased information that the world provides and she knows her shit, which makes her unique. We are very lucky!
Yup. In trying to do my own wave counts different from hers and having them always proven wrong, I’ve realize that she is leveraging years and years of doing this analysis every day, giving her a vast wealth of experience and knowledge of the “I’ve seen this before, I know how it works, I know the right count and why” type that you just can’t get from reading books and doing a few wave counts, or even from doing “casual” wave counts for years.
Yeah, I’ve been doing this every day now for over 10 years I think.
I’m still making mistakes, and I’m still learning.
I do think that my CMT gives me a massive advantage. When finished reading all the textbooks, I had a new depth of understanding. They all sit on my bookshelf and I refer to them regularly (okay, except Kaufman which can be rather… difficult to understand).
I do read the news, but very little and mostly local New Zealand stuff. Only the things that affect me and my family.
The only other technical analysis I follow is Chris Ciovacco and Lowry’s. Literally, that is it. And not even every week.
The banksters may try and bamboozle bearish traders again today with a long lower shadow by ferocious buying into the close and I would not fall for it. They must close the gap and hold the 2800 pivot to be credible. I think any close below signals they lost that fight and that the recent lows will be taken out….
Pivots are important because that is where the heavy hitters tangle. The outcome of those contests generally control price for many successive sessions. Expect a furious battle around 2800 today.
The reclaim of the 2800 pivot may be significant. A close above it today means we go higher from here, and how high is an open question imho. Still, the move yesterday has the charactetistics of a C wave and typical of a short covering induced rally. The PPT is clearly buying as can be seen from money flows so anything is possible and traders have to be nimble.
Thankyou Verne
🙂
What is the best way to see the money flows?
Good call Verne…
If that’s correct, why did the “PPT” allow the 6% sell off in the first place? Or is it not in fact a “plunge protection team”, but in fact a “trade the market for fun and profit for the banks” team? Just wondering aloud again.
Thank you, Lara! This is excellent work. I appreciate it very much!
I’m looking to sell the pullback in the down trend. IWM hourly.
Lara/Kevin
Verne posted something yesterday that it was counter intuitive to short or long in a counter trend.
I have too say it was a lesson for me yesterday.
As for today and I get what your saying about social mood ( Elliott Wave ) the trend being down but as it’s earnings season we probably will see a bounce to levels as you guys mention too at least Fibo 61.8 which is around 2856.
Is it a concern too go long with a stop below present levels. I don’t want to miss the bounce considering it’s another 60 points or more from where we are now.
Yes it’s a concern. But then, it’s always a concern. The market can turn and go the “other way” any time, so you always have to be defensive.
If you are trading intraday (by which I mean monitoring the market most of the time during the trading session), then by focusing on trading at the 5 minute and 1 hour chart level, obviously right now those timeframes are in up trends and are tradable long. I would recommend focusing on the hourly level to decide where to stop, and I’d also recommend an approach of taking 1/2 your position out with a small profit that represents about what you’d lose on the 2nd half if the stop was later hit; derisk the trade as quickly as possible. Particularly since our EW knowledge says sooner or later here, price is coming back down!
That all said, given the weekly and daily timeframes are decidely in DOWN trends…for more positional (multi-day to multi-week) trades, you can look at the market as “setting up” for a strategic short. In which case it’s about patience. Anytime yesterday was “too soon”, and we’ll see about today.
And of course you can do both…good luck Amigo!
The single most important aspect of trading is risk management.
This is why on every single post I have my two rules stated. If you learn nothing else from me but those two rules, I would have done a good job.
Always trade with stops. Trading without stops exposes your entire account to risk of being completely wiped out. That is a novice mistake that almost all traders make at the beginning of their trading careers, and it is the mistake that sees many abandon trading entirely.
If you don’t have a hard stop placed on the account and you’re using a mental figure, then you absolutely must stay watching the trade. Don’t ever step away without placing a stop on it. Slippage is a problem for sure, but at least the trade would be closed if it goes against you and your account would be left to see another day.
The second rule is based upon math. The Theory of Runs. Risk only 1-5% of equity on any one trade. This means that your account can sustain the worst case scenario, a series of 10 losses in a row, and still have enough equity to continue.
For less experienced traders, sit in the lower end of 1-5%.
This may mean that the size of your trades is small if you do not have much equity. That’s okay. Stick to the rule.
And finally, for newer members (we have a few this week) I am very serious about the first rule re stops. Any members who are found to be not trading with stops may see their membership cancelled and they may be blacklisted. I am not prepared to be held responsible for losses on accounts when the market moves in an unexpected direction and a member has a losing trade they then do not exit.
You’re welcome Curtis 🙂 Always great to hear my work is appreciated. It always makes me smile, and want to work harder for you all.
Catching the FIRST wave…
Stylin’…