
A little upwards movement was expected to begin the new week, which is what has happened.
Summary: It is possible the small correction could be over. Look for another wave down to support about 2,700. It is also possible that price may continue sideways for a few days first.
Look for a candlestick reversal pattern, or an instance of bullish divergence between price and RSI or the AD line, before downwards movement may end and a bounce to last more than just a couple of days may begin.
A primary degree correction should last several weeks and should show up on the weekly and monthly charts. Primary wave 4 may total a Fibonacci 8, 13 or 21 weeks. The preferred target for it to end is now about 2,717 but this may be a little too low. Look for very strong support about the lower edge of the teal trend channel on the monthly chart.
Primary wave 4 should be expected to exhibit reasonable strength. This is the last multi week to multi month consolidation in this ageing bull market, and it may now begin to take on some characteristics of the bear market waiting in the wings.
The final target for this bull market to end remains at 3,616, which may be met in October 2019.
New updates to this analysis are in bold.
The biggest picture, Grand Super Cycle analysis, is here.
Last published monthly chart is here, video is here.
ELLIOTT WAVE COUNT
WEEKLY CHART
Click chart to enlarge.
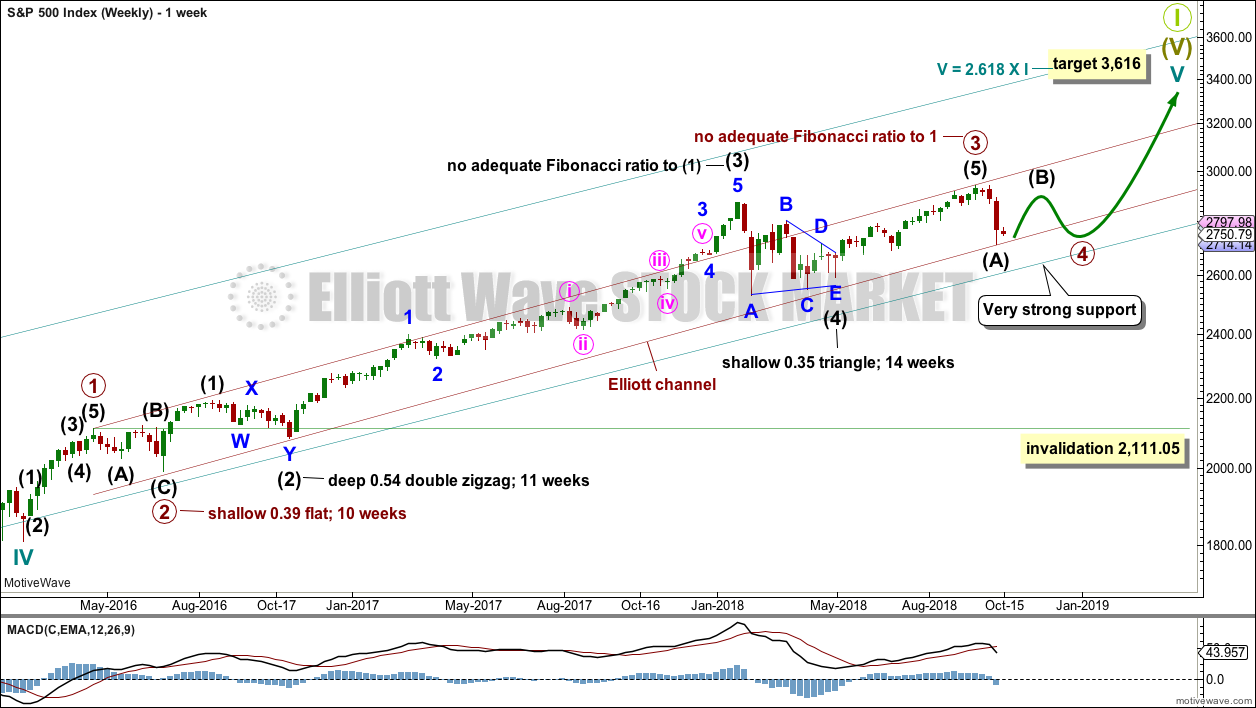
Cycle wave V must complete as a five structure, which should look clear at the weekly chart level and also now at the monthly chart level. It may only be an impulse or ending diagonal. At this stage, it is clear it is an impulse.
Within cycle wave V, the third waves at all degrees may only subdivide as impulses.
Within primary wave 3, there is perfect alternation and excellent proportion between intermediate waves (2) and (4).
The channel is now drawn about primary degree waves. The first trend line is drawn from the ends of primary waves 1 to 3, then a parallel copy is placed upon the low of primary wave 2. Primary wave 4 may find support about the lower edge of this maroon channel. At the end of last week, that is exactly where price bounced up. The overshoot of the upper edge of this channel by the end of intermediate wave (3) looks typical. For the S&P, its third waves are usually the strongest portion of an impulse; they often exhibit enough strength to overshoot channels.
Fourth waves do not always end within channels drawn using this technique. If primary wave 4 breaks out of the narrow maroon channel, then it may find very strong support about the lower edge of the teal channel. This channel is copied over from the monthly chart and contains the entire bull market since its beginning in March 2009. While Super Cycle wave (V) is incomplete, this channel should not be breached.
Primary wave 4 may not move into primary wave 1 price territory below 2,111.05.
When primary wave 4 may be complete, then the final target may be also calculated at primary degree. At that stage, the final target may widen to a small zone, or it may change.
At this stage, the expectation is for the final target to be met in October 2019. If price gets up to this target and either the structure is incomplete or price keeps rising through it, then a new higher target would be calculated.
DAILY CHART
Click chart to enlarge.
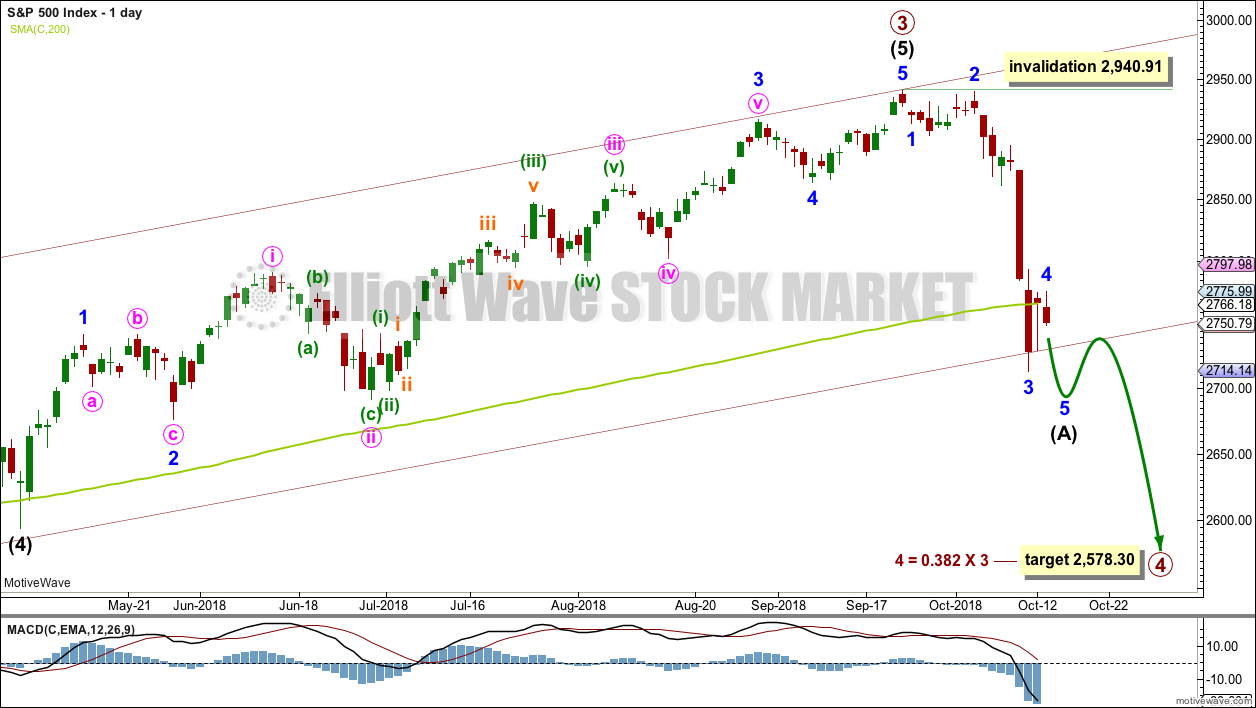
Primary wave 4 would most likely end somewhere within the price territory of the fourth wave of one lesser degree. Intermediate wave (4) has its price territory from 2,872.87 to 2,532.69. Within this range sit two Fibonacci ratios giving two targets. The 0.236 Fibonacci ratio has now been met and passed. The 0.382 Fibonacci ratio may now be used as a final target for primary wave 4 to end.
The target for primary wave 4 at 2,578.30 would expect an overshoot of the teal channel. This target may be too low; price may find support at the lower edge of the channel. However, as primary wave 4 should be expected to exhibit reasonable strength, it may be able to overshoot the channel and that would look reasonable.
Primary wave 2 unfolded as a shallow regular flat correction lasting 10 weeks. Primary wave 4 may exhibit alternation in structure and may most likely unfold as a zigzag, triangle or combination. Primary wave 4 may last a Fibonacci 8 weeks at the earliest, and more likely a Fibonacci 13 or 21 weeks in total. A zigzag would be the most likely structure as these are the most common corrective structures and would provide the best alternation with primary wave 2. A zigzag would see intermediate wave (A) unfold as a five wave structure.
Intermediate wave (A) may be an almost complete five wave impulse. It is possible today that minor wave 4 may be complete and may now be followed by another downwards wave for minor wave 5.
Primary wave 4 may not move into primary wave 1 price territory below 2,111.05.
HOURLY CHART
Click chart to enlarge.
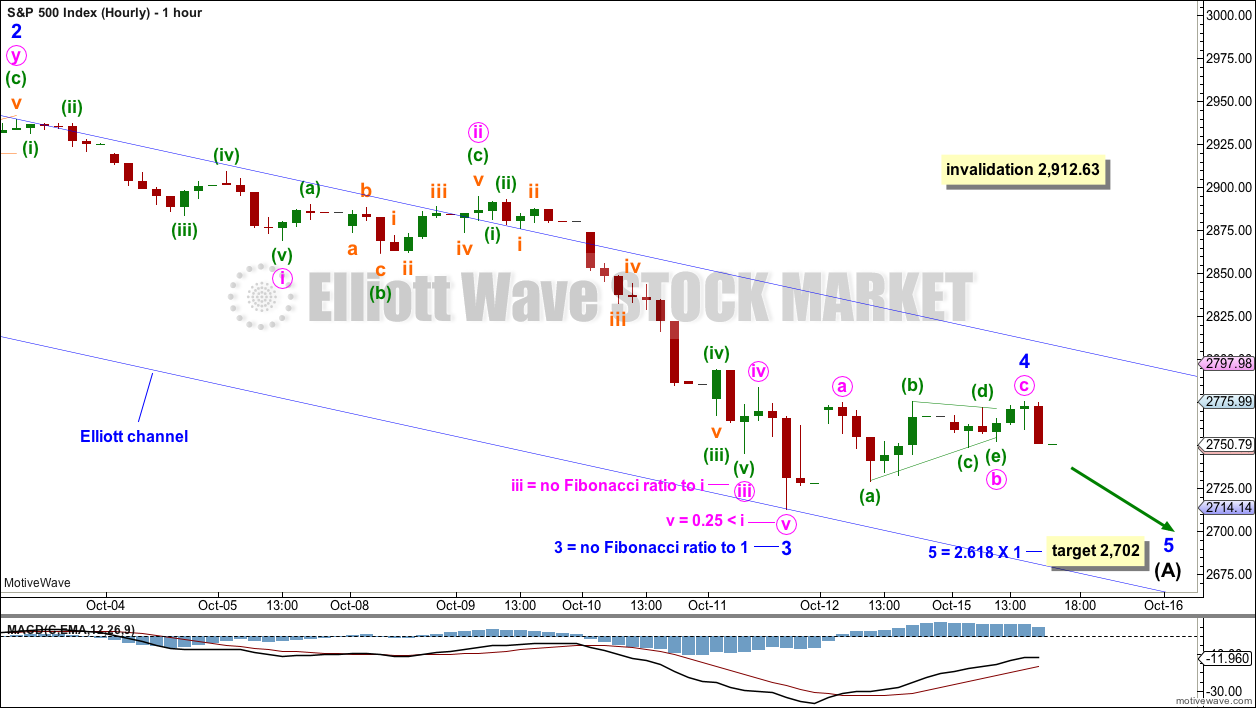
Minor wave 4 may now be a complete zigzag. It may be very shallow at only 0.28 the depth of minor wave 3; this would exhibit perfect alternation with the deep 0.96 combination of minor wave 2.
It is also possible that the degree of labelling within minor wave 4 may be moved down one degree; only minute wave a may have completed today as a zigzag. If the zigzag is only minute wave a, then minor wave 4 may continue sideways for a few more sessions as a very shallow triangle or flat correction.
Minor wave 4 may not move into minor wave 1 price territory above 2,912.63.
Minor wave 5 would be most likely to move below the end of minor wave 3 at 2,713.29 to avoid a truncation. Minor wave 5 may find support about 2,700; the target calculated expects this.
ALTERNATE DAILY CHART
Click chart to enlarge.
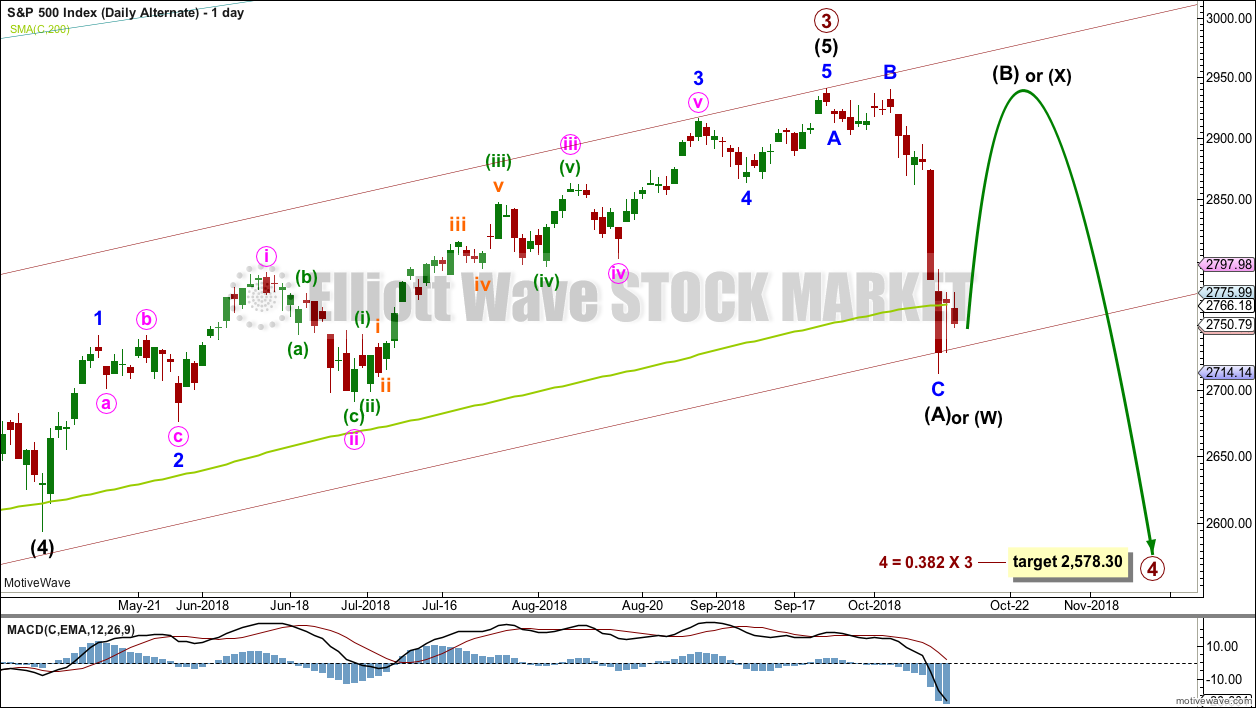
It is also possible that primary wave 4 may sub-divide as a triangle or flat correction, although a flat would not offer structural alternation with primary wave 2. It is also possible that primary wave 4 may unfold as a combination.
If primary wave 4 unfolds as a triangle or a flat, then within it intermediate wave (A) must sub-divide as a three wave structure, most likely a zigzag. It is possible that intermediate wave (A) is a completed zigzag.
If primary wave 4 unfolds as a combination, then the first structure in a double may now be a completed zigzag labelled intermediate wave (W).
Intermediate wave (B) or (X) may make a new price extreme above the start of intermediate wave (A) or (W) as in an expanded flat, running triangle or wave X within a combination. There is no upper invalidation point for this wave count at the daily chart level for this reason.
At the end of last week, this alternate wave count does not have support from classic technical analysis. For a major low within primary wave 4 there should be one or more of the following:
– a candlestick reversal pattern
– bullish divergence between price and Stochastics
– bullish divergence between price and RSI
– bullish divergence between price and the AD line
At this time, none of these conditions are yet met.
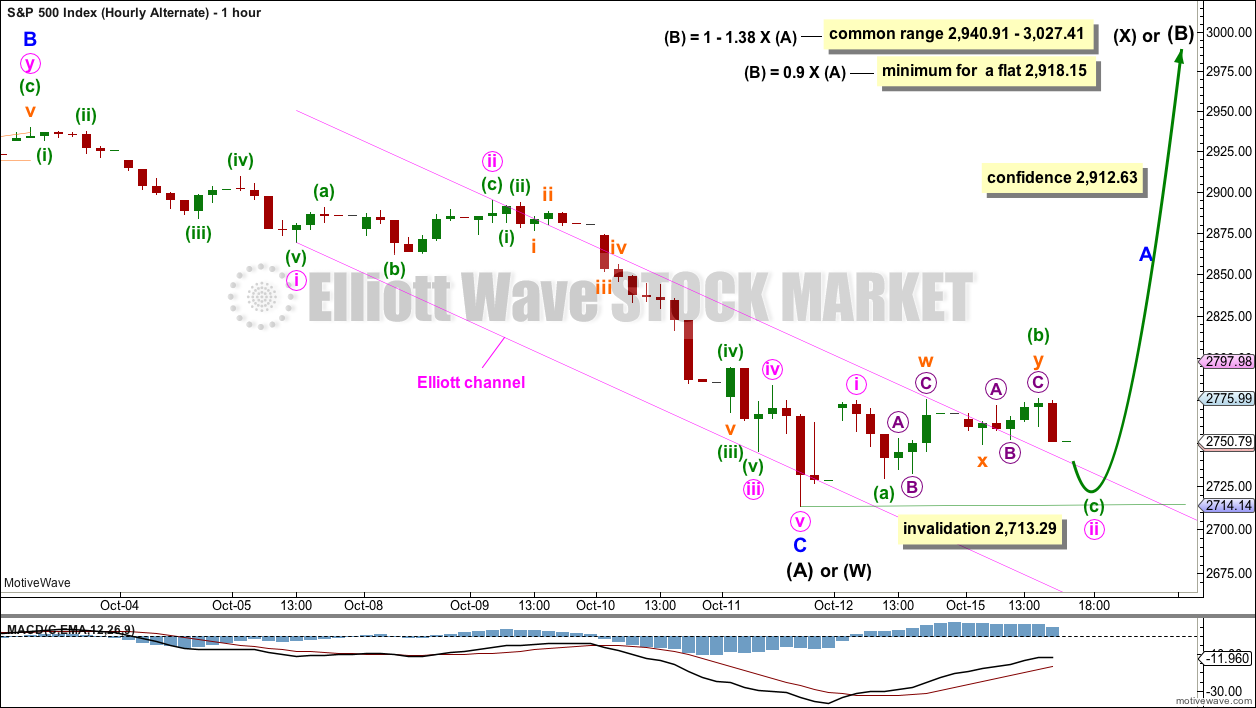
ALTERNATE HOURLY CHART
Click chart to enlarge.
A zigzag sub-divides 5-3-5, exactly the same as waves 1-2-3 of an impulse. The subdivisions within this downwards movement are seen in the same way for both wave counts.
If a bounce moves above 2,912.63, then expect upwards movement to very likely continue to 2,918.15 or above.
If primary wave 4 unfolds as a flat correction, then within it intermediate wave (B) must retrace a minimum 0.9 length of intermediate wave (A), and would most likely end within the common range of 1 to 1.38 times the length of intermediate wave (A).
If primary wave 4 unfolds as a triangle, then there is no minimum required length for intermediate wave (B); it only needs to subdivide as a corrective structure, most likely a zigzag.
If primary wave 4 unfolds as a combination, then there is no minimum nor maximum required length for intermediate wave (X), and intermediate wave (X) may also make a new price extreme beyond the start of intermediate wave (W). X waves within combinations are usually fairly deep.
TECHNICAL ANALYSIS
WEEKLY CHART
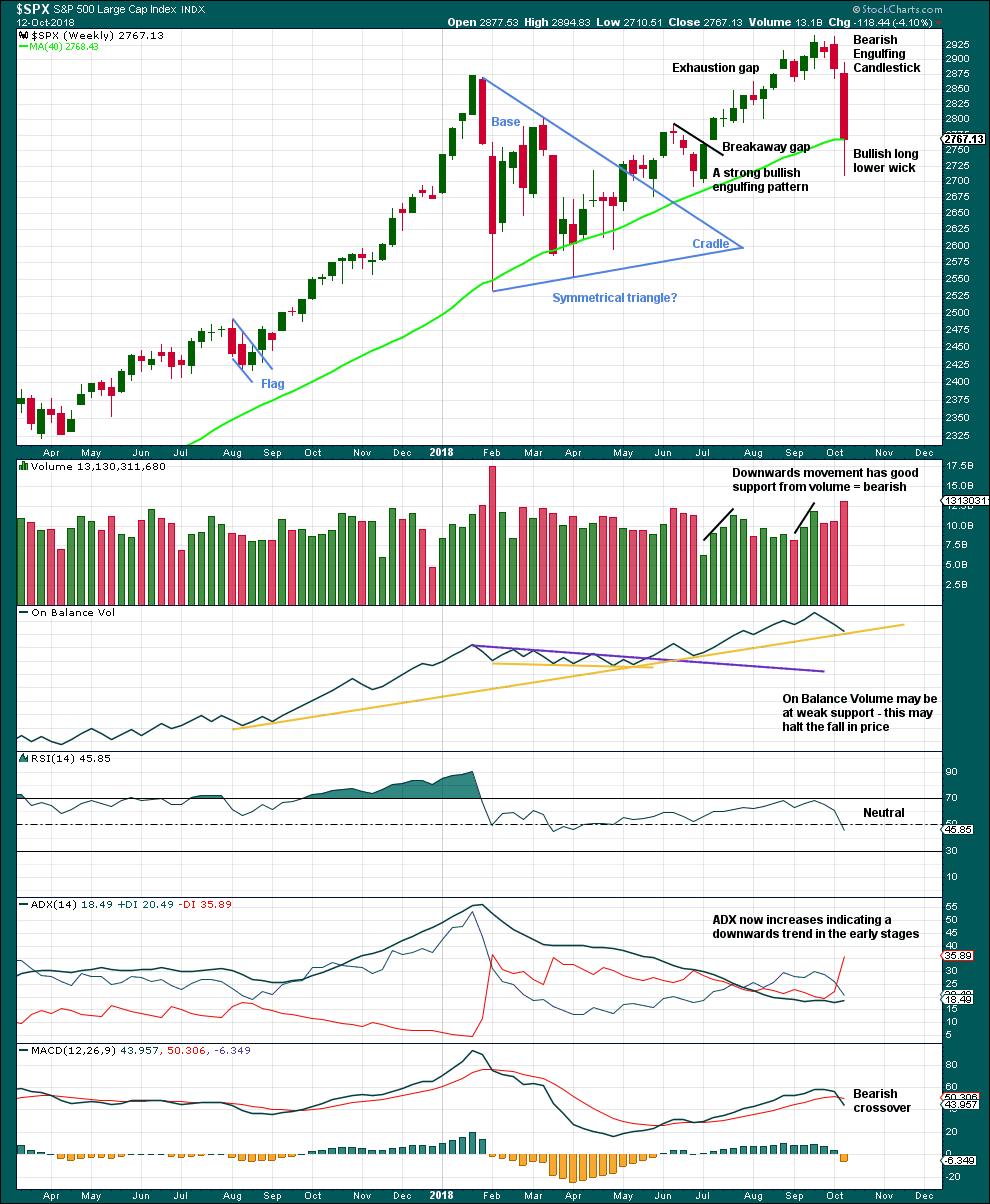
Click chart to enlarge. Chart courtesy of StockCharts.com.
The symmetrical triangle base distance is 340.18. Added to the breakout point of 2,704.54 this gives a target at 3,044.72. This target was not met; it was too optimistic.
The long lower wick on this weekly candlestick suggests a bounce this week.
DAILY CHART
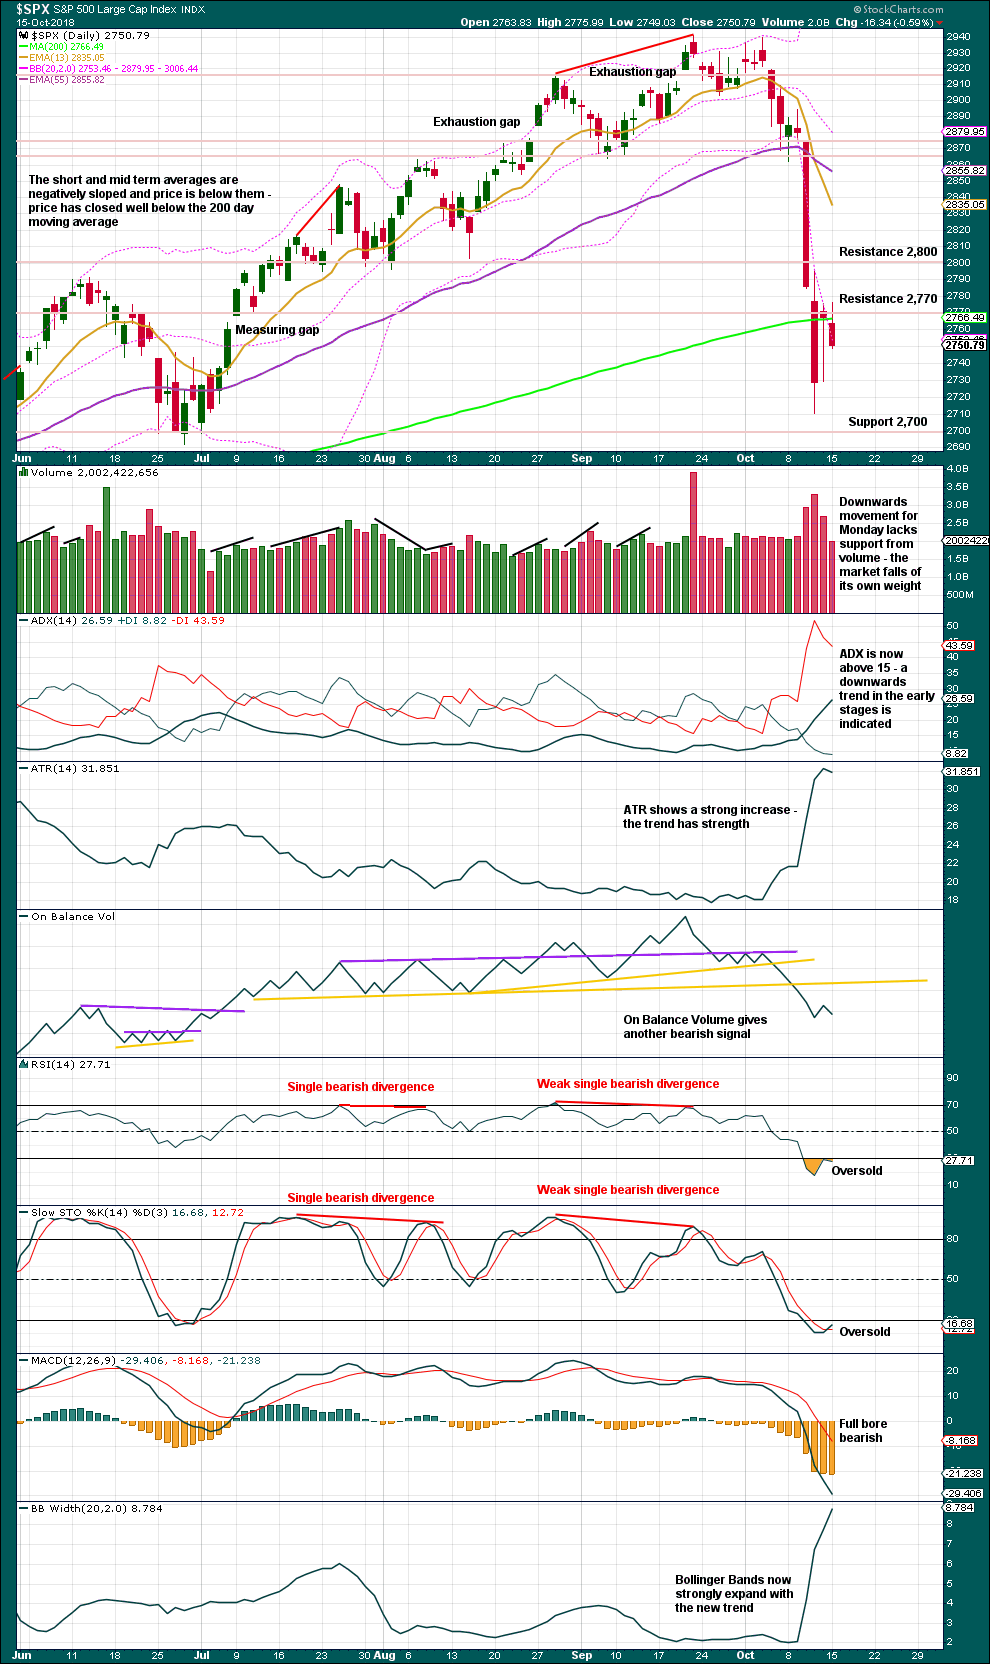
Click chart to enlarge. Chart courtesy of StockCharts.com.
Next support is about 2,700. RSI is now fairly oversold.
There is as yet no bullish divergence between price and either of RSI, Stochastics or On Balance Volume. Nor is there a candlestick reversal pattern. If any of these signals occur, then a bounce may be expected.
The long upper wick on Monday’s candlestick is bearish. Price may either continue sideways a little longer here to resolve extreme conditions, or a new low may exhibit some weakness.
VOLATILITY – INVERTED VIX CHART
WEEKLY CHART

Click chart to enlarge. Chart courtesy of StockCharts.com. So that colour blind members are included, bearish signals
will be noted with blue and bullish signals with yellow.
Primary wave 4 has now arrived and is showing reasonable strength. There is continuing mid term bearish divergence this week with inverted VIX making a new low below the prior swing low of the week beginning 25th June, but price has not yet made a corresponding new low.
As primary wave 4 continues this weekly chart may offer a bullish signal at its end.
DAILY CHART
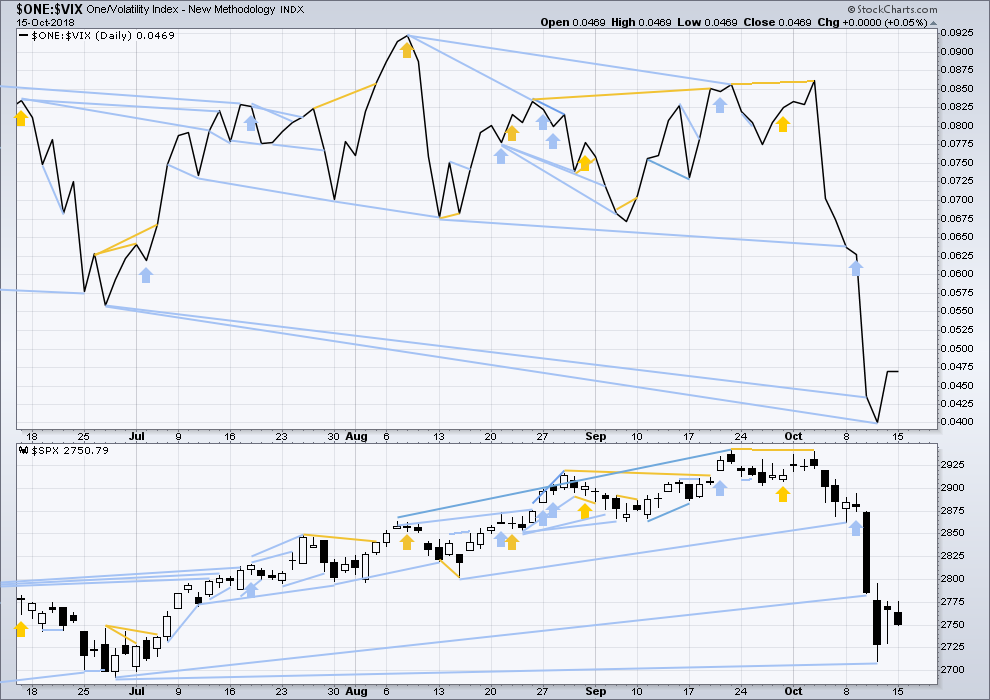
Click chart to enlarge. Chart courtesy of StockCharts.com. So that colour blind members are included, bearish signals
will be noted with blue and bullish signals with yellow.
Normally, volatility should decline as price moves higher and increase as price moves lower. This means that normally inverted VIX should move in the same direction as price.
There is mid term divergence with a new all time high from price not supported by a corresponding new all time high from inverted VIX. This divergence is bearish.
There are now two days in a row of long term bearish divergence between the low for inverted VIX and the prior swing low of the 27th/28th June. Inverted VIX has made new lows, but price has not.
For Monday price moved higher, but the candlestick closed red and the balance of volume was down. Inverted VIX is flat. There is no new short term divergence.
BREADTH – AD LINE
WEEKLY CHART
Click chart to enlarge. Chart courtesy of StockCharts.com.
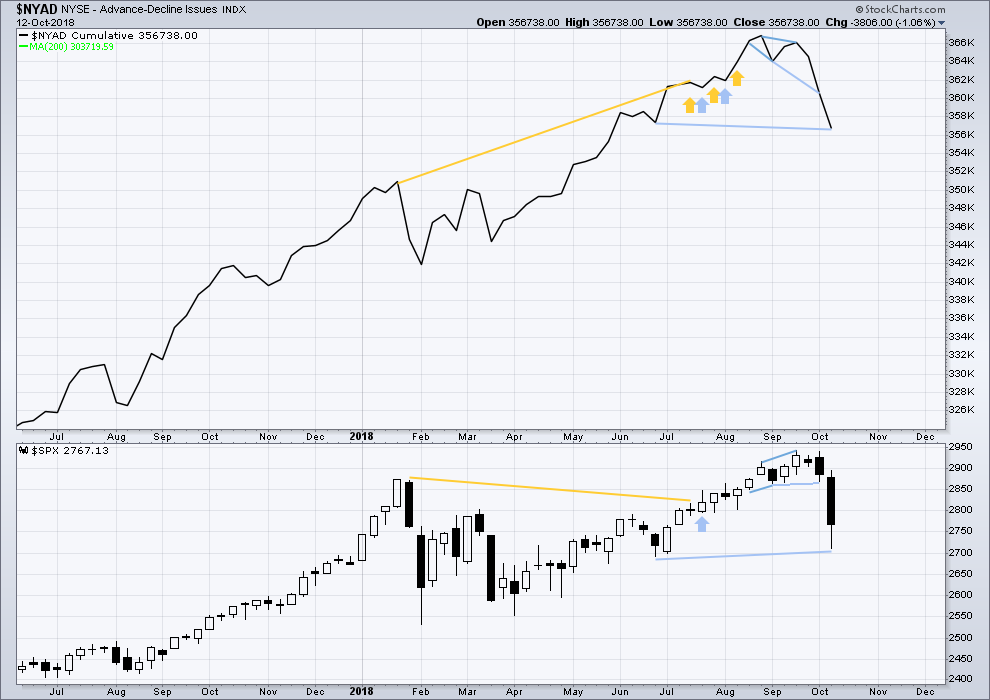
When primary wave 3 comes to an end, it may be valuable to watch the AD line at the weekly time frame as well as the daily.
Last week the AD line has made a slight new low below the prior swing low of the week beginning 25th June, but price has not. This mid term divergence is bearish, but it is weak.
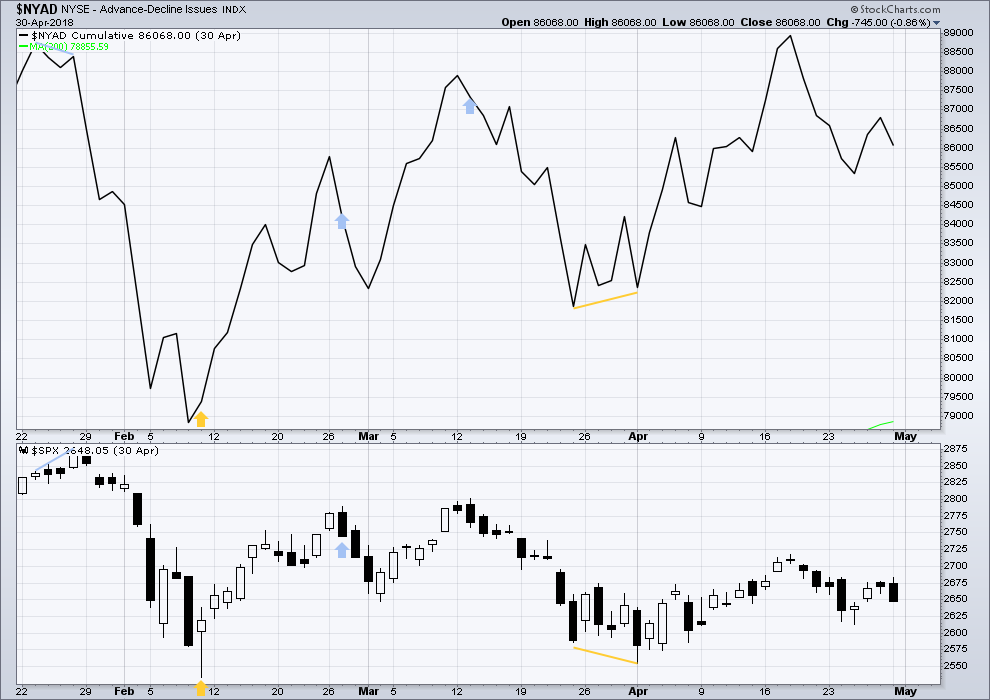
DAILY CHART
Click chart to enlarge. Chart courtesy of StockCharts.com.
There is normally 4-6 months divergence between price and market breadth prior to a full fledged bear market. This has been so for all major bear markets within the last 90 odd years. With no longer term divergence yet at this point, any decline in price should be expected to be a pullback within an ongoing bull market and not necessarily the start of a bear market. New all time highs from the AD line on the 29th of August means that the beginning of any bear market may be at the end of December 2018, but it may of course be a lot longer than that. My next expectation for the end of this bull market may now be October 2019.
Because there is less than 4 months of bearish divergence between price and the AD line, the current strong fall in price is expected to be only a primary degree correction and not the start of a bear market. The conditions for a full fledged bear market do not yet exist.
Breadth should be read as a leading indicator.
For Monday price moved higher with a higher high and higher low although the balance of volume was down and the candlestick closed red. Upwards movement has support from a rise in market breadth during this session; this is bullish for the short term and indicates a continuation of minor wave 4 for another few days.
Both mid and small caps for Friday have long lower wicks. This may indicate a small bounce to continue for a very few days.
DOW THEORY
The following lows need to be exceeded for Dow Theory to confirm the end of the bull market and a change to a bear market:
DJIA: 23,344.52.
DJT: 9,806.79.
S&P500: 2,532.69.
Nasdaq: 6,630.67.
ANALYSIS OF INTERMEDIATE WAVE (4)
TECHNICAL ANALYSIS
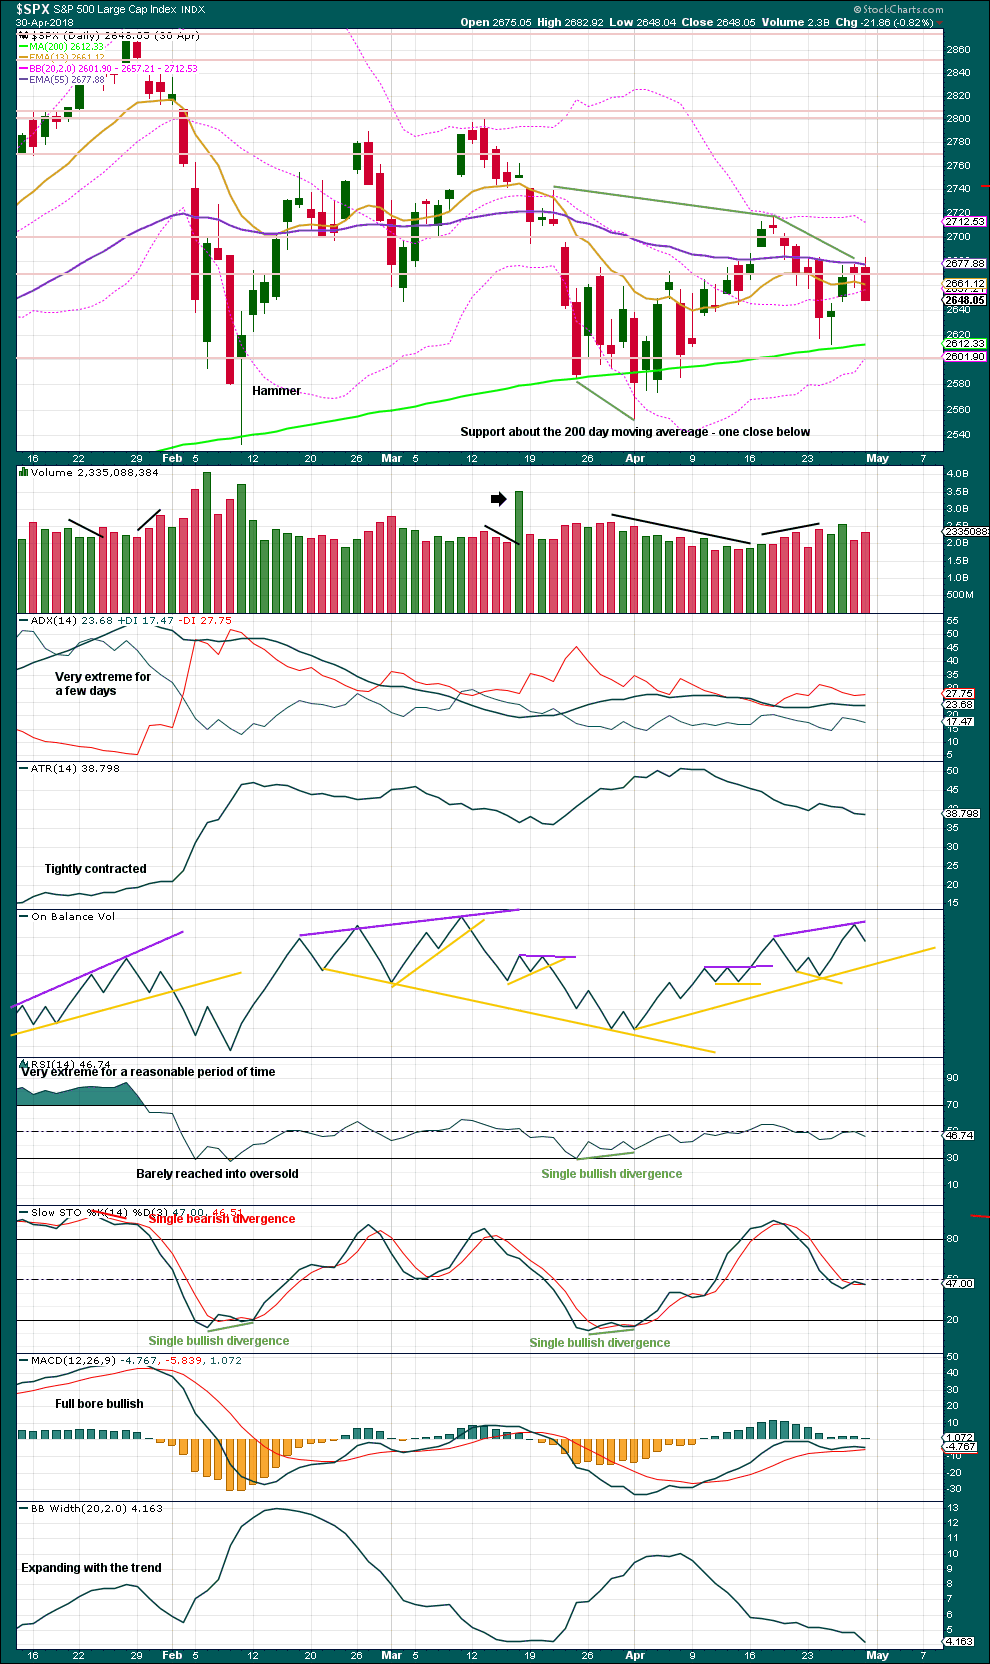
Click chart to enlarge. Chart courtesy of StockCharts.com.
Intermediate wave (4) was a large symmetrical triangle. The deepest wave was the first wave. At its low there was a clear candlestick reversal pattern and bullish divergence between price and Stochastics.
RSI barely managed to reach into oversold.
The current correction for primary wave 4 may behave differently, but there should be some similarities.
It is expected that primary wave 4 may be stronger than intermediate wave (4).
VIX
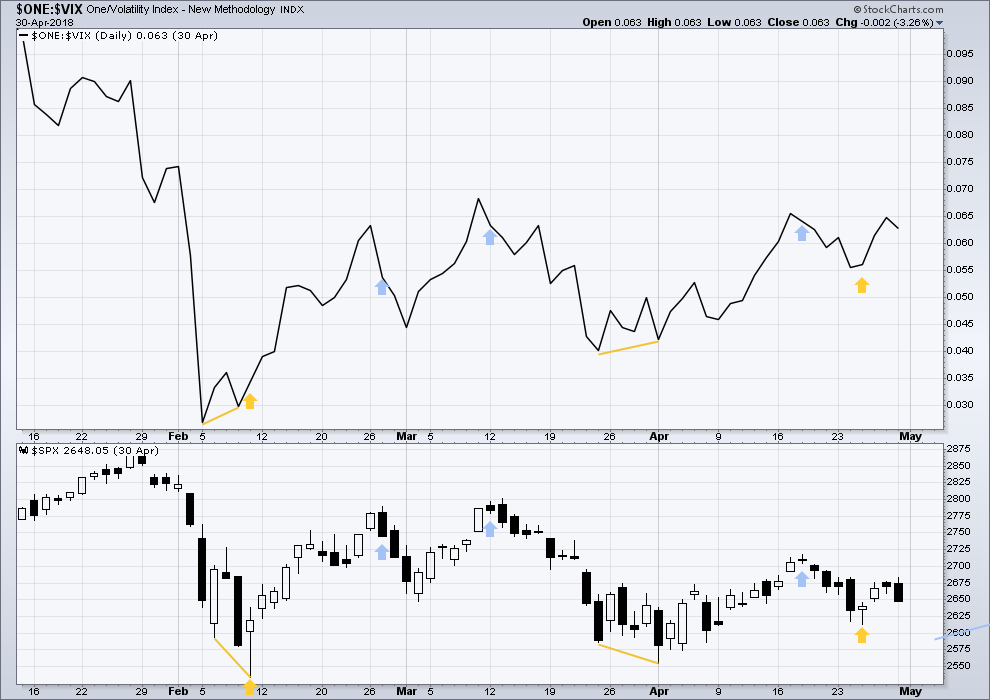
Click chart to enlarge. Chart courtesy of StockCharts.com.
This is a daily chart.
At the two major lows within intermediate wave (4), inverted VIX exhibited single short term bullish divergence.
At highs within intermediate wave (4), inverted VIX exhibited one single day bullish divergence with price.
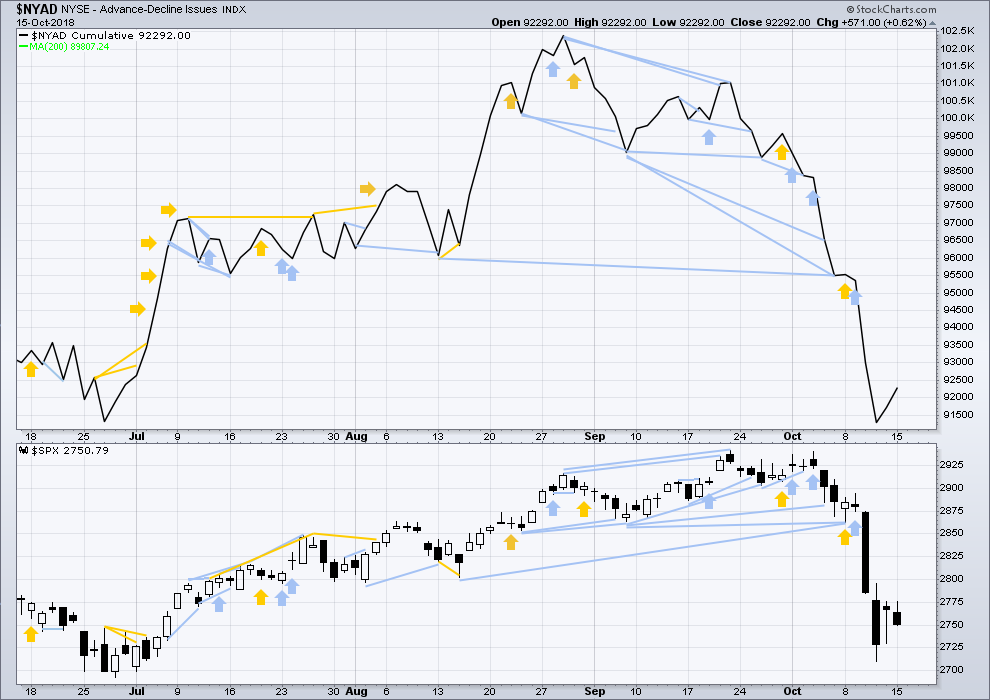
AD LINE
Click chart to enlarge. Chart courtesy of StockCharts.com.
This is a daily chart.
At the two major lows within intermediate wave (4), there was bullish divergence between price and the AD line. At the two major highs within intermediate wave (4), there was each one instance of single day bearish divergence.
Published @ 08:04 p.m. EST.
—
Careful risk management protects your trading account(s).
Follow my two Golden Rules:
1. Always trade with stops.
2. Risk only 1-5% of equity on any one trade.
Both wave counts remain valid, but this alternate is looking slightly more likely today. If this upwards movement has support from volume and there are any bullish signals today from On Balance Volume, VIX or the AD line, then this count may be preferred.
Main hourly count updated:
Within minor 4, minute b may have been a running barrier triangle. Interestingly my research is showing so far that barrier triangles are most often running rather than regular.
Minor 4 is now slowing about the upper edge of the channel. If it reverses here there would be only a tiny breach. If price continue higher here then the breach would be larger and so the probability of this count would be slightly reduced.
Only slightly though, because fourth waves do not always sit neatly within these channels and this channel is not perfect anyway; minute ii within minor 3 breaches it.
I’ll let classic TA guide today as to which count is more likely.
Went long $275 avg on SPY, just sold at $279.50. Awaiting a return to the depths, should it come.
Symmetric projections of the recent moves up indicate this one may be very close to complete.
Hope it too the downside as quick as we went up
The multi-hour squeeze in both NDX and SPX have turned off now with today’s strong up move.
Kevin
Did you mention 2853 this week. Good lord
I didn’t. My chart did though. 61.8% retrace of the whole A (or W) down. It may not get up there. If it does, it’s a place to watch for a turn; a turn there is more likely to hold than at a random price (in my opinion and experience). Also watch the 50% level at 2826.4.
Thankyou
SPX indicating it is breaking up out of it’s hour time frame squeeze. Maybe it reverses first and goes south…but right now A/D for SPX is 432-71!!
So all indications are up for a bit. I’ll be watching for a turn at one of the fibo levels and sell triggers to add to my growing pile of positional shorts.
Kevin
Last night I think you posted something g about the bounce and if the SPX got through a wave of resistance. I noted it was around 2780. Bang on buddy.
I have shorts but I am trying too learn what size of contract to order at times.
Does anyone have a rough rule.
Nino: your question is a bit ill-defined (what does “size” mean? You mean at what strike relative to current price? Or how many options to buy? etc…).
Even if your question was precise, there’s no “right answer”, because every options trade is a set of trade offs. There’s never any “right” way to trade with options, just lots and lots and lots of choice.
As I got into options, I spent a few introductory $ to become a member of “theotrade”. I did that because they have an extensive education video library on options trading, using all types of techniques. Once a member for an introductory period for pretty cheap…you can quickly go through lots of them and get educated rather well. One approach I would recommend to anyone new to options; it worked pretty well for me. And no, I don’t continue to subscribe to their service: no elliott wavers there, from my perspective, they trade blind. (Yes, I’m harsh.)
Good luck!
I like harsh buddy. Old school I am.
My question is more to how many options or contracts for difference would one buy and how do you gauge it.
Thankyou for the reference on education. I need it believe me. I want to speak Elliot wave like everyone else.
Nothing is more counter-intuitive than shorting counter-trend rallies in a down-trend. They are furious in bear markets and find even fewer takers than the reverse during bull runs. Human nature never changes.
Today they are “Shaking The Trees”.
Savvy traders are eyeing that coil…. 🙂
Late yesterday and today, we are witnessing what can make triangles so difficult, the false breakout. The drop in price late yesterday appeared to be a breakout to the downside. It may have stopped out many who were anticipating an upside breakout. Now the reversal comes and SPX followed with a breakout to the upside negating yesterday’s downside action. This is the one scenario that can be a nightmare to triangle traders especially those Bermuda Triangle Traders!
Haha! Funny. But true. However, not at all surprising when you grok bankster psychology!
Do you think we have one more push past SPX 2780 or is the wedge complete and we go down from here?
2699 (call it 2700) is the 38% and it lines up with the pivot high from 6/13 as well. That should prove to be resistance, and possibly the turn level. Right now SPX is in no man’s land IMO, hence, I expect it to continue to elevate incrementally here to at least 2699. It could very well go up to the 62% before the push up is complete at 2853.5 (later this week). Just have to wait and see what level it finally turns at is how I view it. Not predictable…but a turn at one of those fibo levels following by some sell triggers will get me pounding the keyboard to add shorts.
Well, I am answering your question with the SPX now at 2784, so Yes. I think we are seeing the last wave up in this correction. Perhaps 2800.
Thanks guys. Yeah looks like 2800 is at least in the cards
I’m not sure if I understood correctly. But it looked like a five up and so I took a quick long position and am enjoying it.
Why is shorting counter-trend rallies in a downtrend counter-intuitive?
Because you would have to enter short right as price is moving up. It feels like entering against the trend.
It really is easier to do when there is a resistance line which has been tested at least twice before. If price comes up to it, then a short can be entered with the stop a little above the line so reducing risk.
To do it on the first bounce is much more difficult and more risky. Is it a bounce? Or has the trend changed?
Guys
In everyone opinion is 2775 very strong to get through
Could it be that minor 4 could be a complete triangle in itself and not just minute 4 within Minor 4?
A model of what’s up. I’m suspicious the v down about to launch here might be much longer than implied by the short nature of the i down. I’ve got two “likely” targets for it to complete, each aligned with significant prior support/resistance price levels. The lower target is aligned with the symmetric projection of the A wave of the intermediate 4 (vertical white line). Those are the only two “obvious” levels I see for an (A)wave bottom (of course it could be any level, but when it turns at the obvious level…you have edge). I’ve got guesstimates for the (B) and (C)/P4 pivots, and yes I think the bottom of this P4 could be quite a bit lower than Lara’s current target levels. I believe 2434 or close to it is the most likely bottom zone (i.e > 50% probability), and the 127% at 2423 is within reason and a very common level for such a correction that is expected to be “larger”. That’s a total correction size range of 13.8% to 17.6% (vs. the 11% for the intermediate 4) for those two target fibo levels.
what first?