Yesterday’s analysis expected a bounce for Tuesday’s session. This is what has happened.
Summary: Because of a new swing low, it now looks like there may have been a trend change. Primary wave 4 may now be in its very early stages.
For the very short term, tomorrow may begin with a little downwards movement to 2,871.84 or below, and then price may turn up for a small swing. A small consolidation may complete this week for minor wave 4 that should then be followed by more downwards movement.
A primary degree correction should last several weeks and should show up on the weekly and monthly charts. Primary wave 4 may total a Fibonacci 8, 13 or 21 weeks. The preferred target for it to end is now about 2,717.
The final target for this bull market to end remains at 3,616, which may be met in October 2019.
New updates to this analysis are in bold.
The biggest picture, Grand Super Cycle analysis, is here.
Last historic analysis with monthly charts is here, video is here.
MAIN ELLIOTT WAVE COUNT
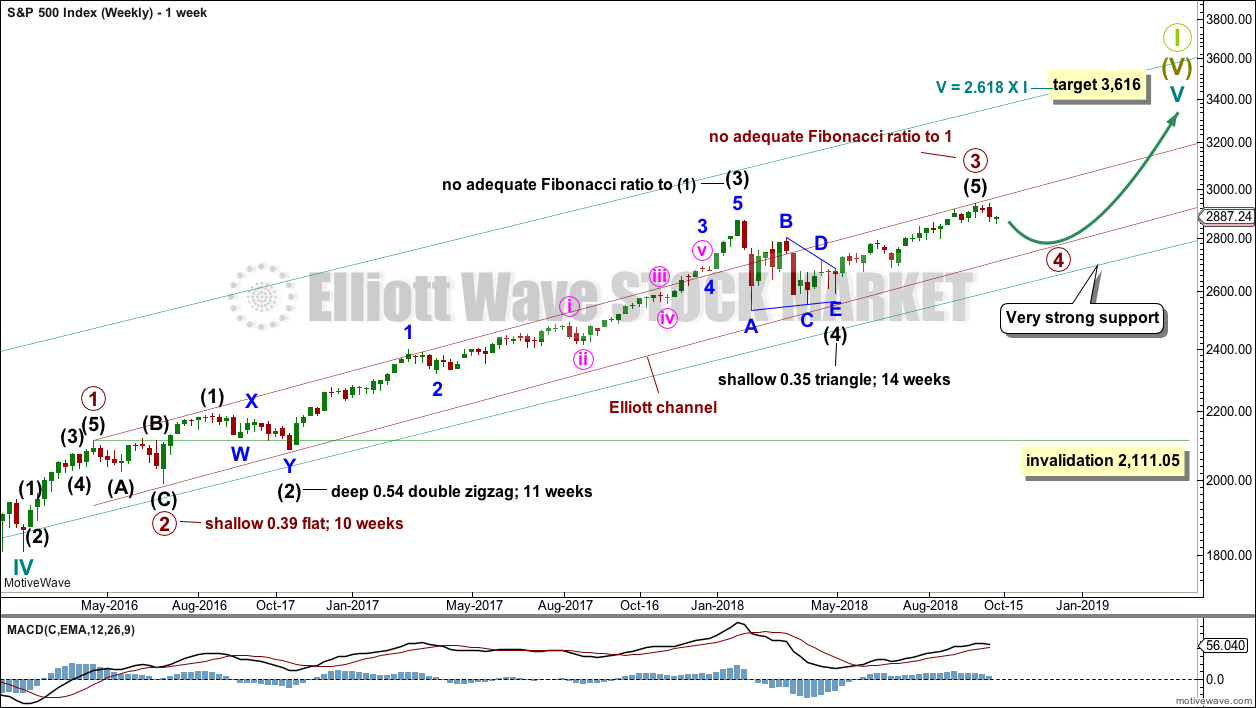
WEEKLY CHART
Cycle wave V must complete as a five structure, which should look clear at the weekly chart level and also now at the monthly chart level. It may only be an impulse or ending diagonal. At this stage, it is clear it is an impulse.
Within cycle wave V, the third waves at all degrees may only subdivide as impulses.
Primary wave 3 may now be complete. Within primary wave 3, there is perfect alternation and excellent proportion between intermediate waves (2) and (4).
The channel is now drawn about primary degree waves. The first trend line is drawn from the ends of primary waves 1 to 3, then a parallel copy is placed upon the low of primary wave 2. Primary wave 4 may find support about the lower edge of this maroon channel. The overshoot of the upper edge of this channel by the end of intermediate wave (3) looks typical. For the S&P, its third waves are usually the strongest portion of an impulse; they often exhibit enough strength to overshoot channels.
Fourth waves do not always end within channels drawn using this technique. If primary wave 4 breaks out of the narrow maroon channel, then it may find very strong support about the lower edge of the teal channel. This channel is copied over from the monthly chart and contains the entire bull market since its beginning in March 2009. While Super Cycle wave (V) is incomplete, this channel should not be breached.
Primary wave 4 may not move into primary wave 1 price territory below 2,111.05. However, it is not expected to get anywhere near this invalidation point as it should remain above the lower edge of the teal channel.
When primary wave 4 may be complete, then the final target may be also calculated at primary degree. At that stage, the final target may widen to a small zone, or it may change.
At this stage, the expectation is for the final target to be met in October 2019. If price gets up to this target and either the structure is incomplete or price keeps rising through it, then a new higher target would be calculated.
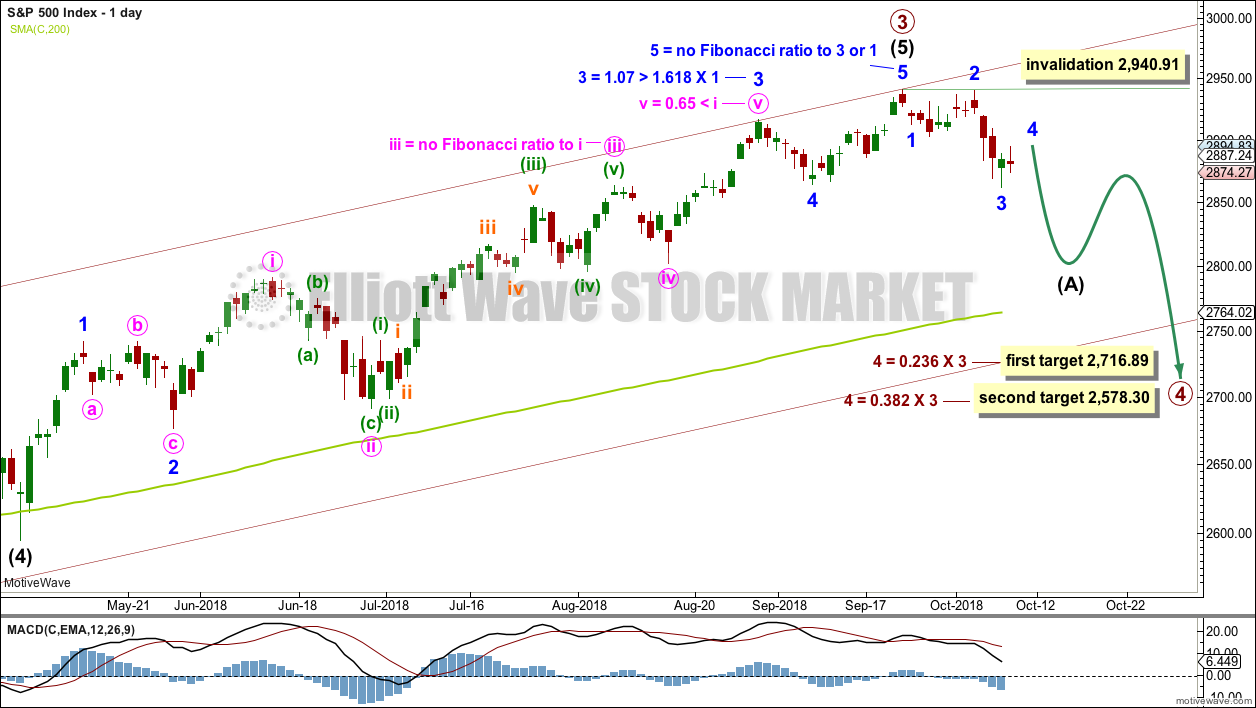
DAILY CHART
It is reasonably common for the S&P to exhibit a Fibonacci ratio between two actionary waves within an impulse, and uncommon for it to exhibit Fibonacci ratios between all three actionary waves within an impulse. The lack of a Fibonacci ratio for minor wave 5 within this wave count is not of any concern; this looks typical.
There are two excellent Fibonacci ratios within this wave count. The Fibonacci ratios for this wave count are better than for the alternate wave count.
Primary wave 4 would most likely end somewhere within the price territory of the fourth wave of one lesser degree. Intermediate wave (4) has its price territory from 2,872.87 to 2,532.69. Within this range sit two Fibonacci ratios giving two targets. The upper 0.236 Fibonacci ratio may be more likely as that would see primary wave 4 only slightly overshoot the maroon channel.
Primary wave 2 unfolded as a shallow regular flat correction lasting 10 weeks. Primary wave 4 may exhibit alternation in structure and may most likely unfold as a zigzag, triangle or combination. Primary wave 4 may last a Fibonacci 8 weeks at the earliest, and more likely a Fibonacci 13 or 21 weeks in total. A zigzag would be the most likely structure as these are the most common corrective structures and would provide the best alternation with primary wave 2.
Primary wave 4 may not move into primary wave 1 price territory below 2,111.05. However, the lows in primary wave 4 should not get close to this point. The lower edge of the teal channel on the weekly chart should provide very strong support.
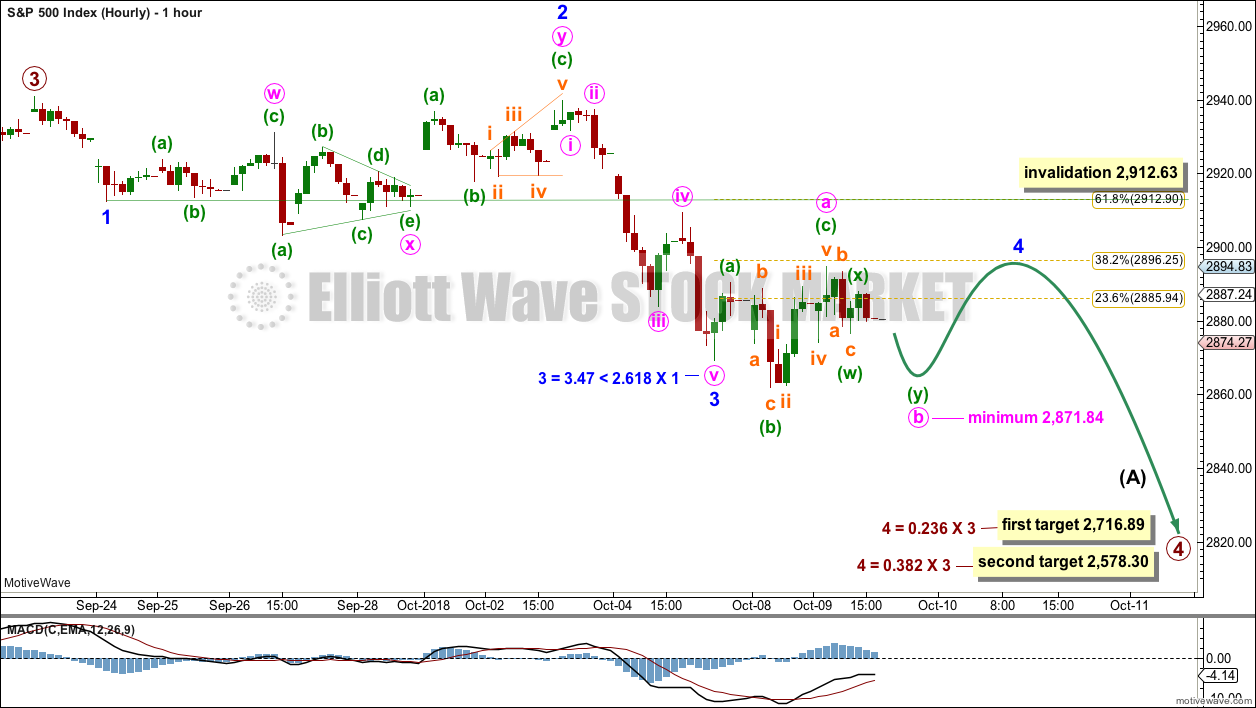
HOURLY CHART
A movement at primary wave degree should begin with a five wave structure downwards.
Analysis at the hourly chart level is today relabelled to see minor waves 1, 2 and 3 complete. This has a better look at the daily chart level today.
Minor wave 4 may now unfold sideways over a very few days. Minor wave 4 may have begun with a three wave structure for minute wave a. This indicates a flat or triangle may be unfolding for minor wave 4, and this would still provide alternation with the combination of minor wave 2.
If minor wave 4 unfolds as a flat correction, then within it minute wave b must retrace a minimum 0.9 length of minute wave a at 2,871.84 or below. If minor wave 4 unfolds as a triangle, then there is no minimum requirement for minute wave b within it; minute wave b needs only to complete as a single or multiple zigzag.
Minute wave b may make a new low below the start of minute wave a at 2,862.08 as in an expanded flat or running triangle. A new low does not mean that minor wave 4 is over; it may still continue sideways.
Minor wave 4 may continue sideways for another one to very few days, reaching only to about the 0.382 Fibonacci ratio to provide alternation in depth with the very deep correction of minor wave 2.
Minor wave 4 may not move into minor wave 1 price territory above 2,912.63.
ALTERNATE ELLIOTT WAVE COUNT
DAILY CHART
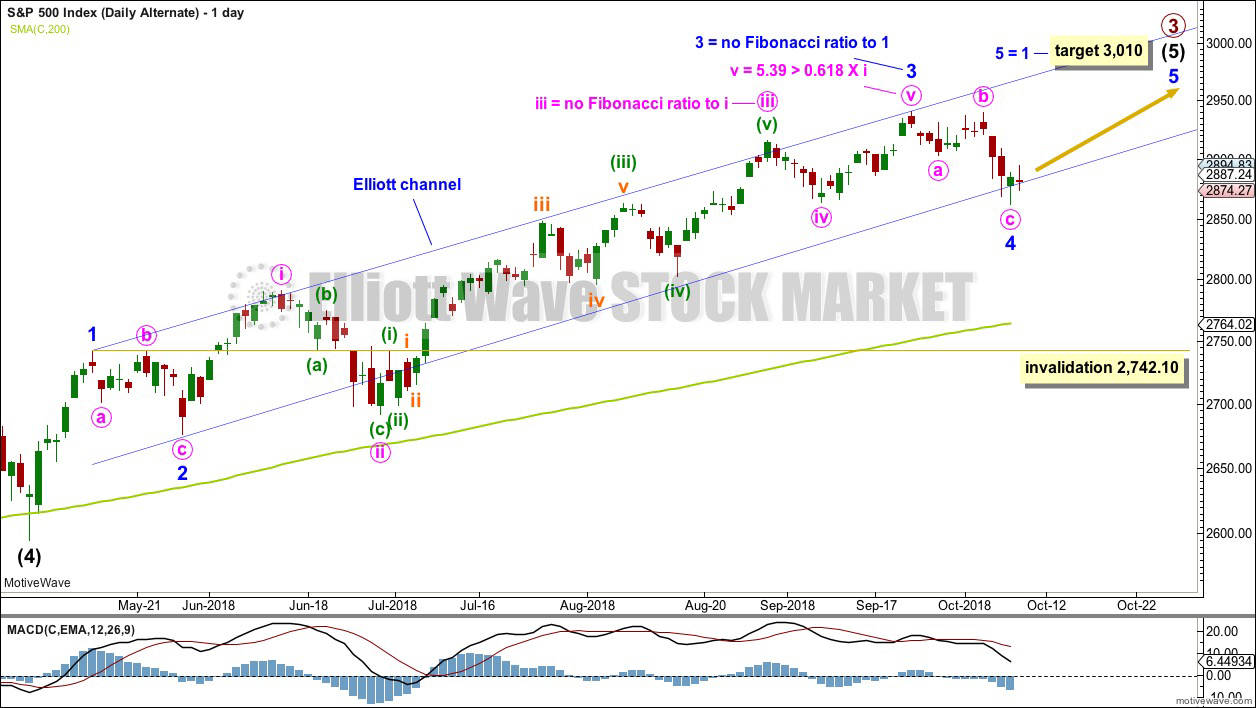
It remains possible that primary wave 3 may not be over.
Intermediate wave (3) exhibits no Fibonacci ratio to intermediate wave (1). It is more likely then that intermediate wave (5) may exhibit a Fibonacci ratio to either of intermediate waves (1) or (3). Intermediate wave (5) has passed equality in length and 1.618 the length of intermediate wave (1). The next Fibonacci ratio in the sequence is 2.618 giving a target at 3,124. If the target at 3,010 is met and passed, then this would be the next calculated target.
A target for intermediate wave (5) to end is calculated at minor degree.
It is possible now that the pullback of the last three weeks may be minor wave 4, but relabelling intermediate wave (5) in this way loses a good Fibonacci ratio between minor waves 3 and 1; now the Fibonacci ratios for this wave count are not very good.
I have checked on the hourly chart the subdivisions of the middle of the third wave, subminuette wave iii. This wave count will fit, but there is some gross disproportion between corrections within subminuette wave iii for it to work. The S&P500 does not always exhibit good proportion.
The Elliott channel is redrawn. Minor wave 4 may have ended with a slight overshoot of the lower trend line.
Minor wave 4 may not move into minor wave 1 price territory below 2,742.10.
HOURLY CHART
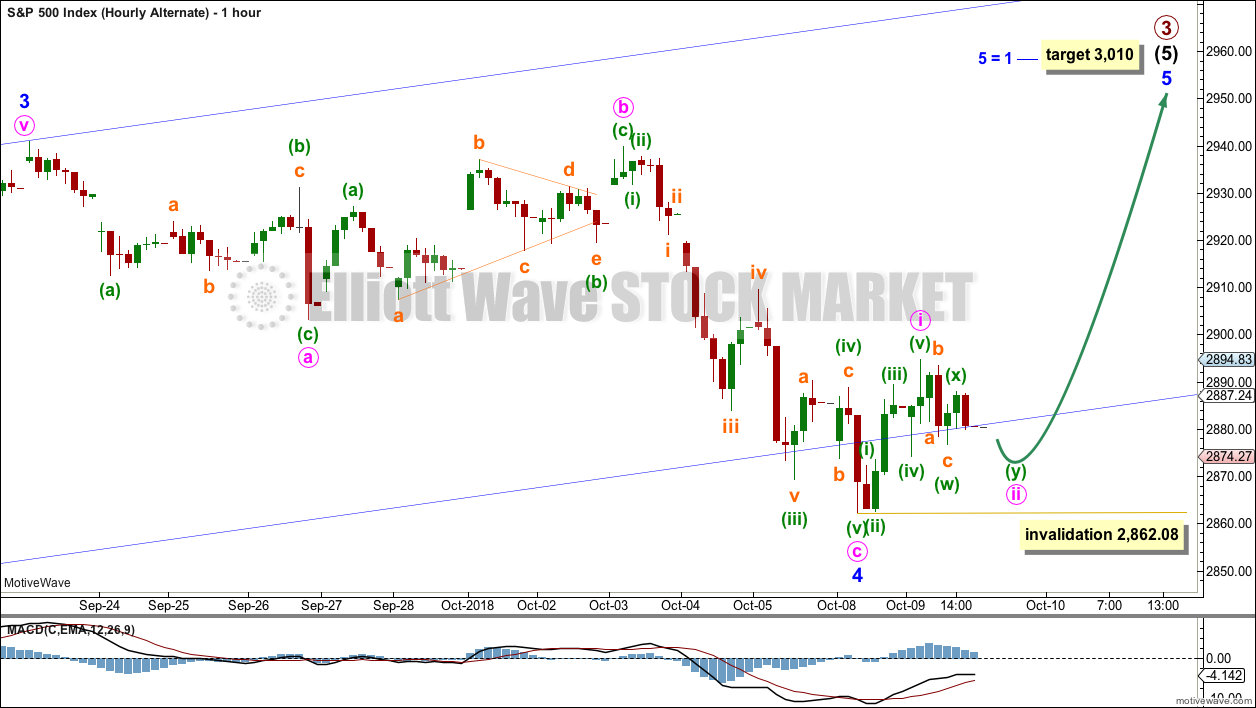
Minor wave 4 may now be a complete flat correction; this would be a regular flat because minute wave b is longer than 0.9 the length of minute wave a but less than 1.05 the length of minute wave a.
There is no adequate Fibonacci ratio between minute waves a and c.
Minute wave c no longer subdivides well as a five wave impulse.
Within minor wave 5, no second wave correction may move beyond the start of its first wave below 2,862.08.
TECHNICAL ANALYSIS
WEEKLY CHART
Click chart to enlarge. Chart courtesy of StockCharts.com.
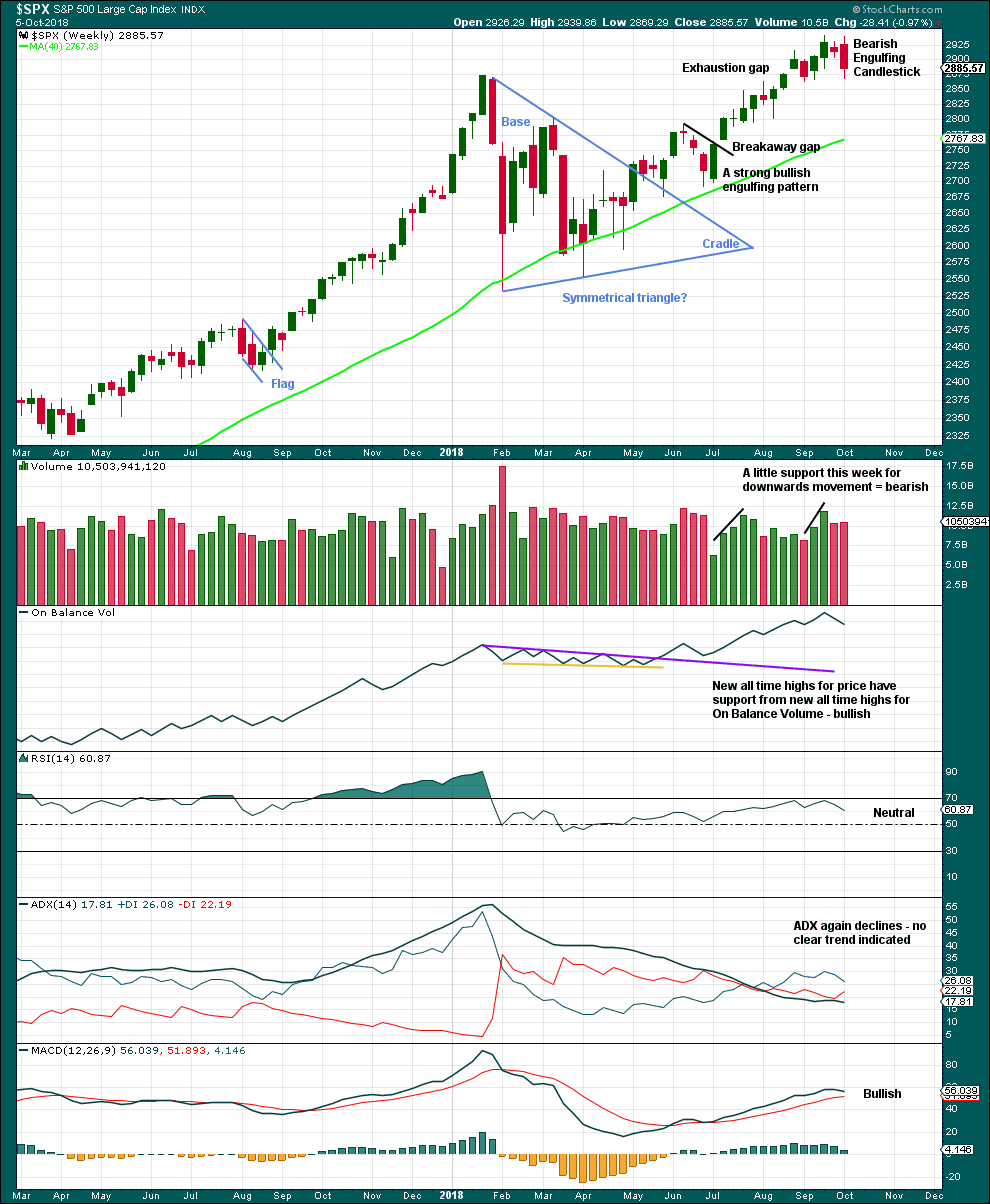
The symmetrical triangle base distance is 340.18. Added to the breakout point of 2,704.54 this gives a target at 3,044.72. This target has not yet been met.
Last week completes a Bearish Engulfing candlestick pattern (the strongest candlestick reversal pattern), which also has support from a slight increase in volume. This favours the main Elliott wave count.
DAILY CHART
Click chart to enlarge. Chart courtesy of StockCharts.com.
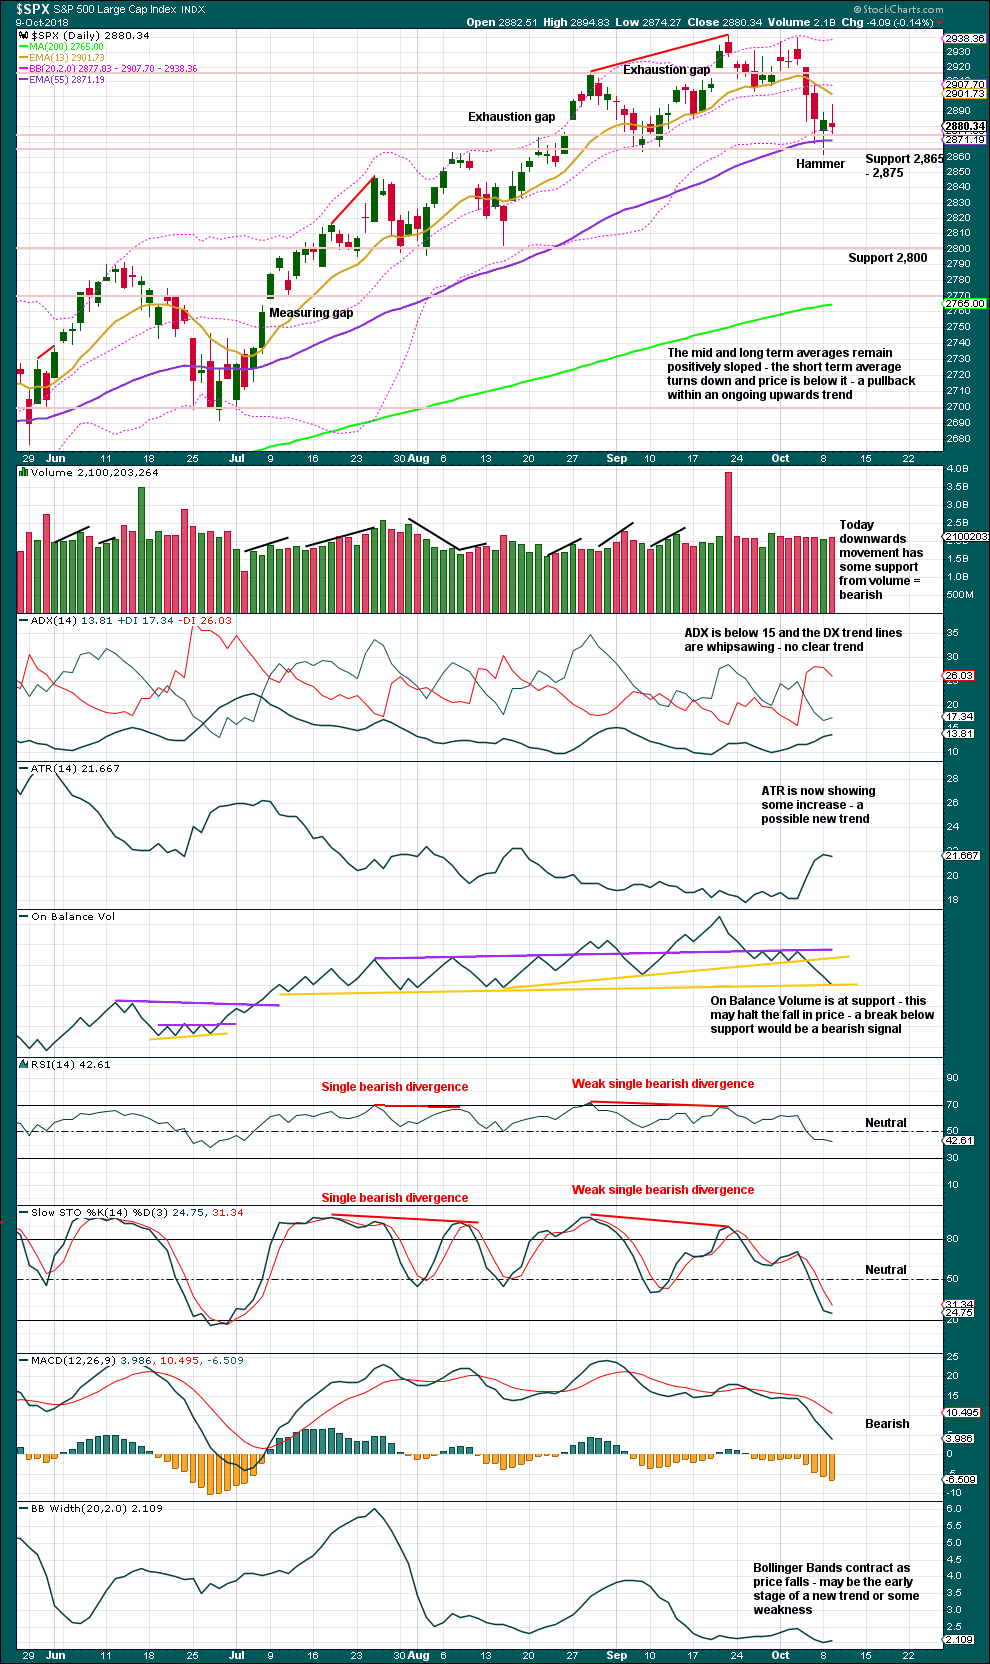
With now a new swing low since the upwards trend began in April, there is no longer a series of continuing higher highs and higher lows. With a lower low, there is now some indication from price of a possible trend change.
Today a small upwards day completes with the balance of volume downwards and the candlestick closing red. Downwards movement within the session has support from volume. The short term volume profile now is slightly bearish, supporting the main Elliott wave count.
On Balance Volume may halt the fall in price here; but if price prints another red candlestick tomorrow, On Balance Volume may give another bearish signal.
Today the doji candlestick looks like a small pause within a new downwards trend. ADX is very close to 15; if it continues to rise and reaches 15, it would indicate a downwards trend in place.
There is room for price to fall; indicators are as yet nowhere near extreme. If price can break below strong support here about 2,865 – 2,875, then next support below is about 2,800.
VOLATILITY – INVERTED VIX CHART
WEEKLY CHART
Click chart to enlarge. Chart courtesy of StockCharts.com. So that colour blind members are included, bearish signals
will be noted with blue and bullish signals with yellow.
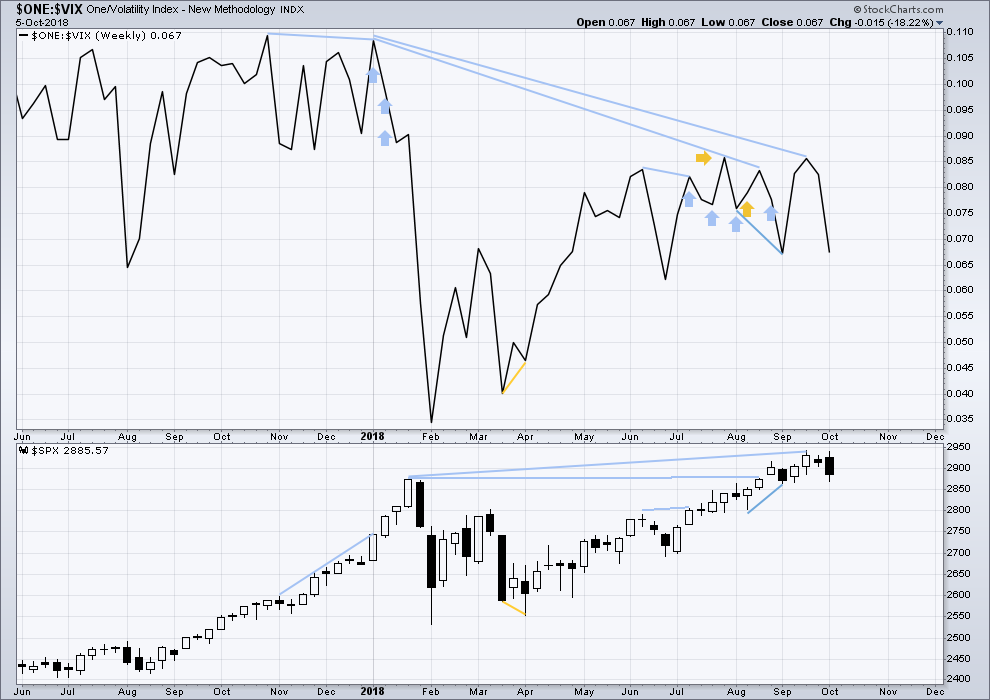
To keep an eye on the all time high for inverted VIX a weekly chart is required at this time.
Notice how inverted VIX has very strong bearish signals four weeks in a row just before the start of the last large fall in price. At the weekly chart level, this indicator may be useful again in warning of the end of primary wave 3.
At this time, there is mid term bearish divergence between price and inverted VIX: price has made another new all time high, but inverted VIX has not. This divergence may persist for some time. It may remain at the end of primary wave 3, and may develop further to the end of primary wave 5.
Both inverted VIX and price have moved lower and neither have made new swing lows. There is no divergence.
DAILY CHART
Click chart to enlarge. Chart courtesy of StockCharts.com. So that colour blind members are included, bearish signals
will be noted with blue and bullish signals with yellow.
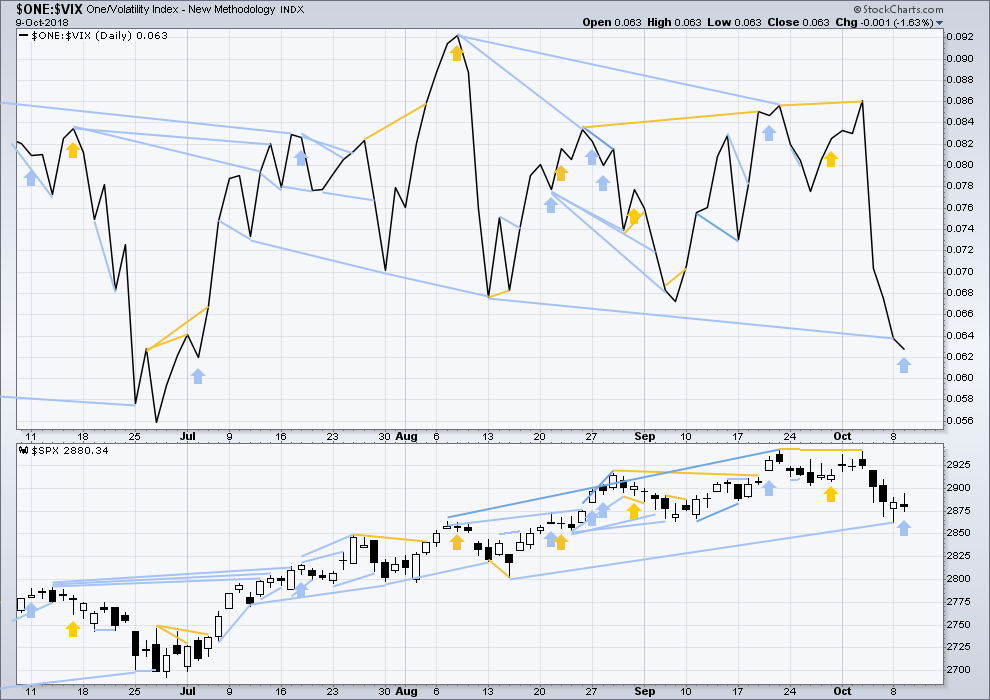
Normally, volatility should decline as price moves higher and increase as price moves lower. This means that normally inverted VIX should move in the same direction as price.
There is mid term divergence with a new all time high from price not supported by a corresponding new all time high from inverted VIX. This divergence is bearish.
Mid term bearish divergence between price and inverted VIX can be seen on both daily and weekly charts now. There is now enough mid term bearish divergence to offer reasonable support to the main Elliott wave count.
Today price moved higher, but inverted VIX moved lower. This divergence is bearish and short term.
BREADTH – AD LINE
WEEKLY CHART
Click chart to enlarge. Chart courtesy of StockCharts.com.
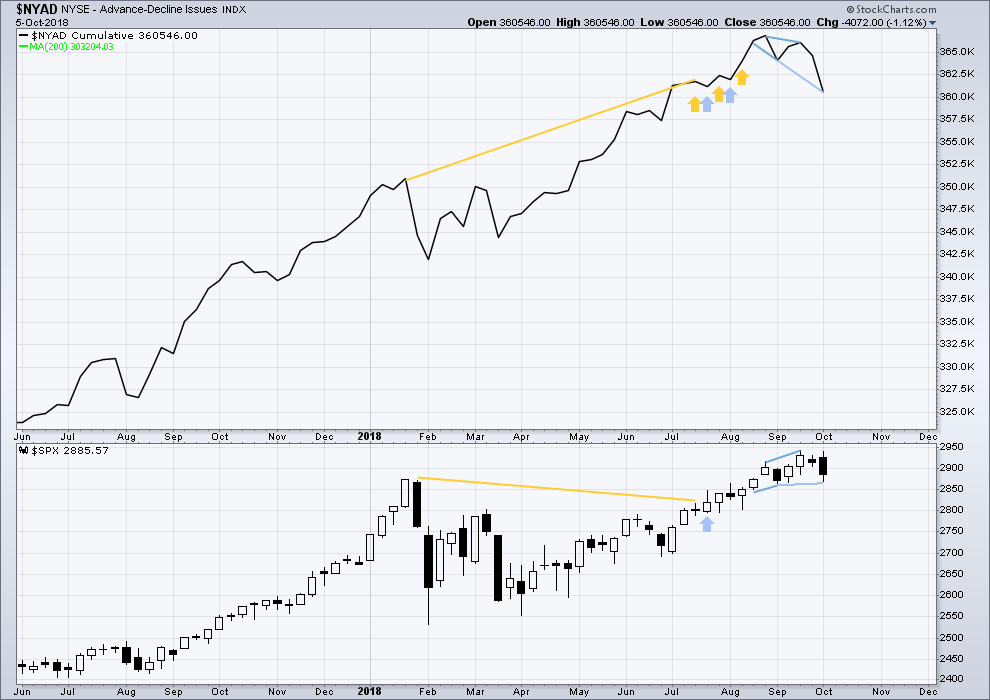
When primary wave 3 comes to an end, it may be valuable to watch the AD line at the weekly time frame as well as the daily.
There is now triple bearish divergence between price and the AD line. The AD line this week has made a new strong swing low, but price has not. This offers reasonable support now to the main Elliott wave count.
DAILY CHART
Click chart to enlarge. Chart courtesy of StockCharts.com.
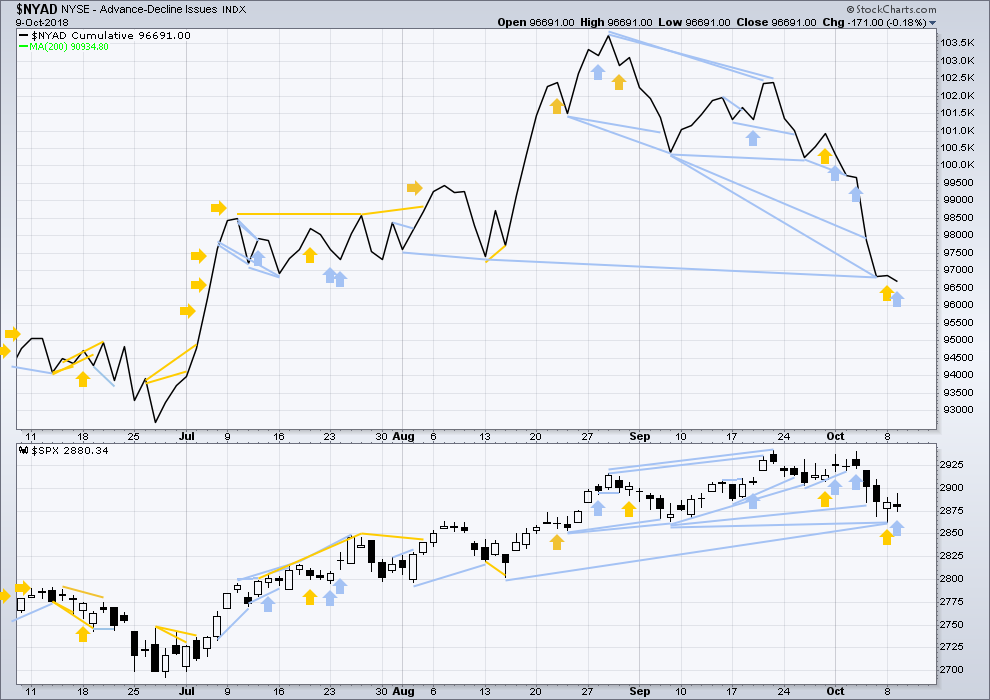
There is normally 4-6 months divergence between price and market breadth prior to a full fledged bear market. This has been so for all major bear markets within the last 90 odd years. With no longer term divergence yet at this point, any decline in price should be expected to be a pullback within an ongoing bull market and not necessarily the start of a bear market. New all time highs from the AD line on the 29th of August means that the beginning of any bear market may be at the end of December 2018, but it may of course be a lot longer than that. My next expectation for the end of this bull market may now be October 2019.
Breadth should be read as a leading indicator.
There is now a cluster of bearish signals at the daily chart from the AD line; this offers now some reasonable support to the main Elliott wave count.
Mid term bearish divergence remains. Today price moved higher, but the AD line moved lower. This single day divergence is bearish for the short term.
All of large, mid and small caps have made new lows below their respective last swing lows.
DOW THEORY
The following lows need to be exceeded for Dow Theory to confirm the end of the bull market and a change to a bear market:
DJIA: 23,360.29.
DJT: 9,806.79.
S&P500: 2,532.69.
Nasdaq: 6,630.67.
All of DJIA, DJT, S&P500 and Nasdaq have made recent new all time highs. This provides Dow Theory confirmation that the bull market continues.
Charts showing each prior major swing low used for Dow Theory may be seen at the end of this analysis here.
ANALYSIS OF THE END OF INTERMEDIATE WAVE (3)
TECHNICAL ANALYSIS
Click chart to enlarge. Chart courtesy of StockCharts.com.
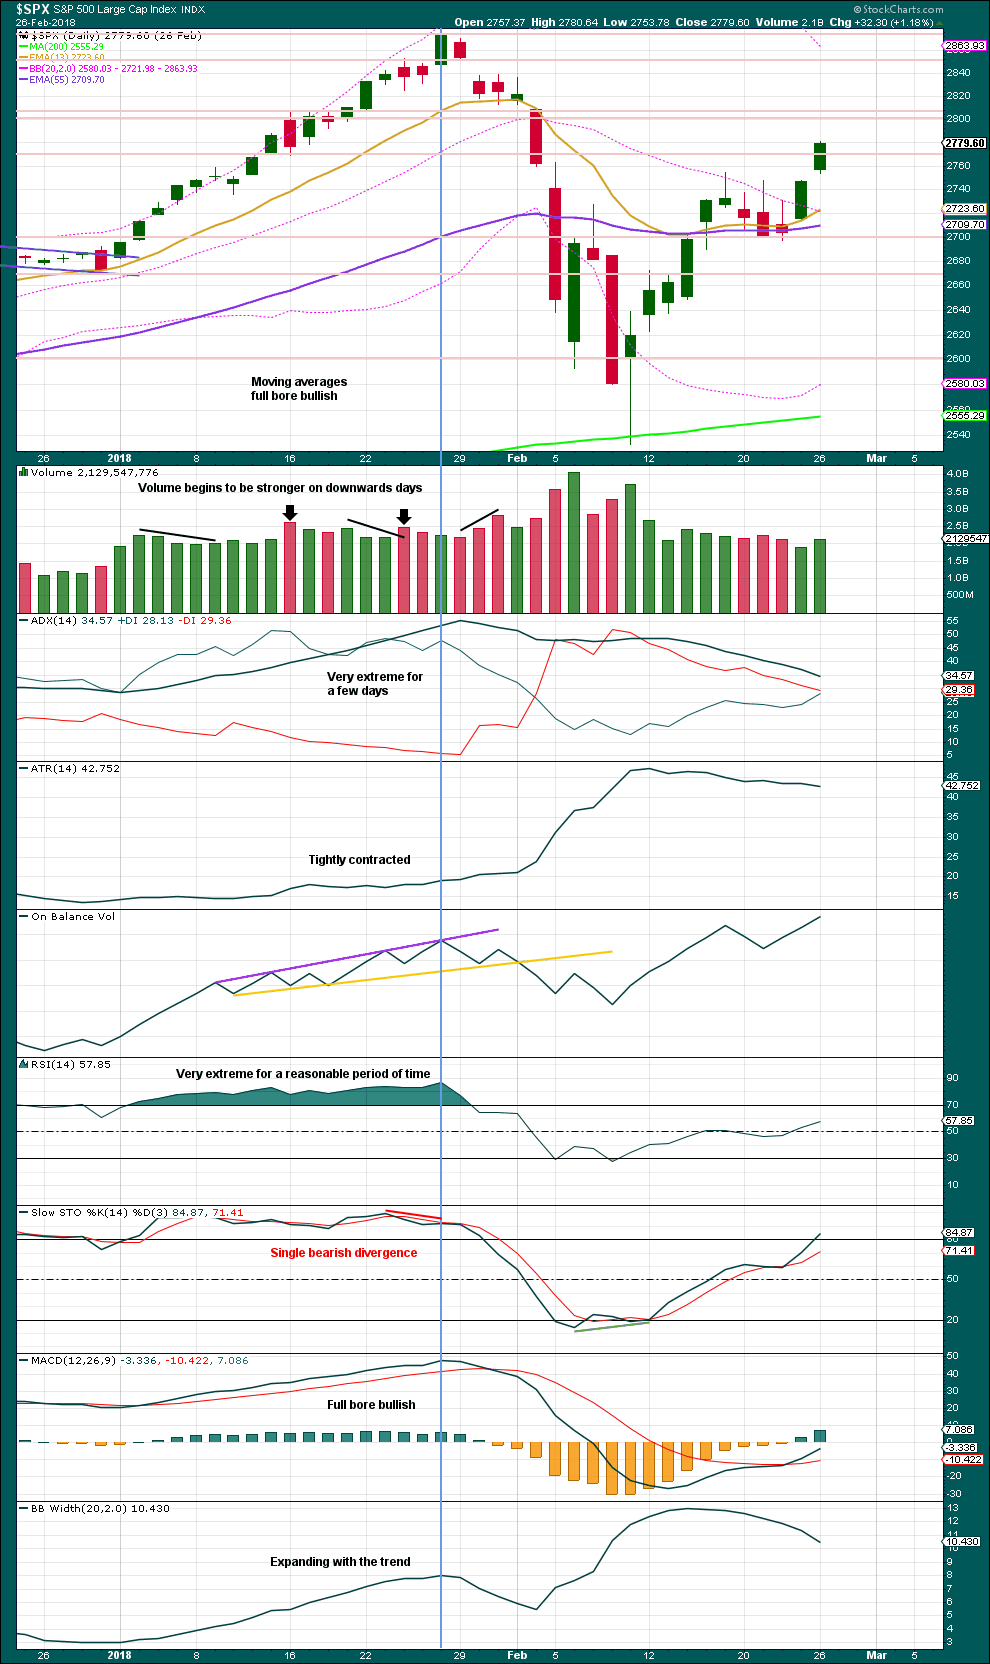
This chart looked overly bullish at the end of intermediate wave (3). The only warning in hindsight may have been from volume spiking slightly on downwards days. There was no bearish divergence between price and either of RSI or On Balance Volume.
Single bearish divergence between price and Stochastics was weak, which is often an unreliable signal.
VIX
Click chart to enlarge. Chart courtesy of StockCharts.com.
This is a daily chart.
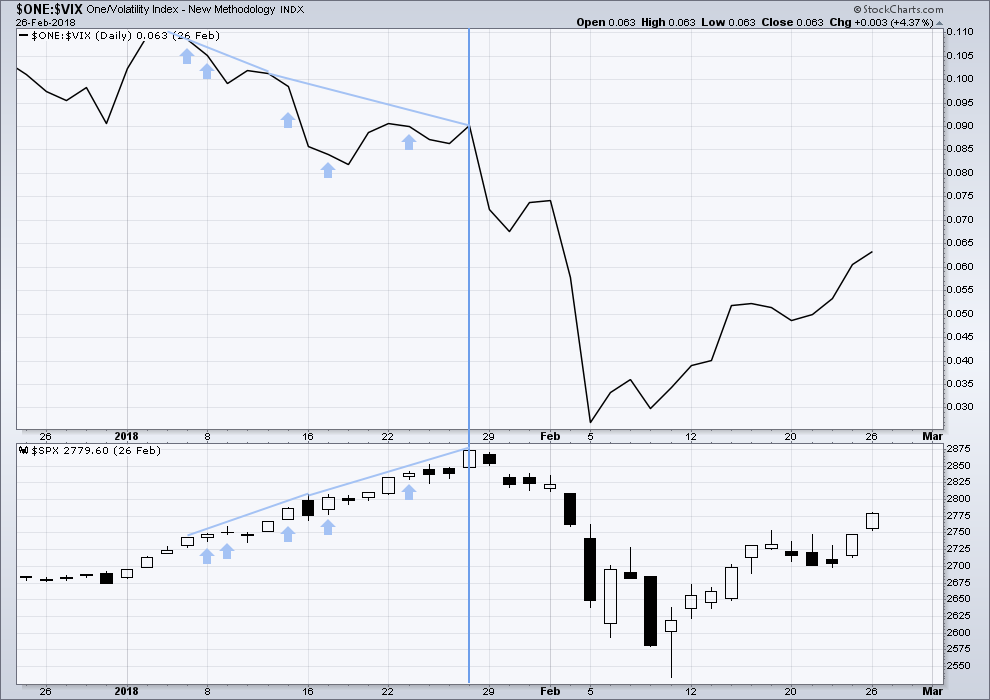
The strongest warning of an approaching intermediate degree correction at the daily chart level came from inverted VIX.
There was strong double bearish divergence at the high of intermediate wave (3), which is noted by the vertical line. There was also a sequence of five days of bearish divergence, days in which price moved higher but inverted VIX moved lower.
AD LINE
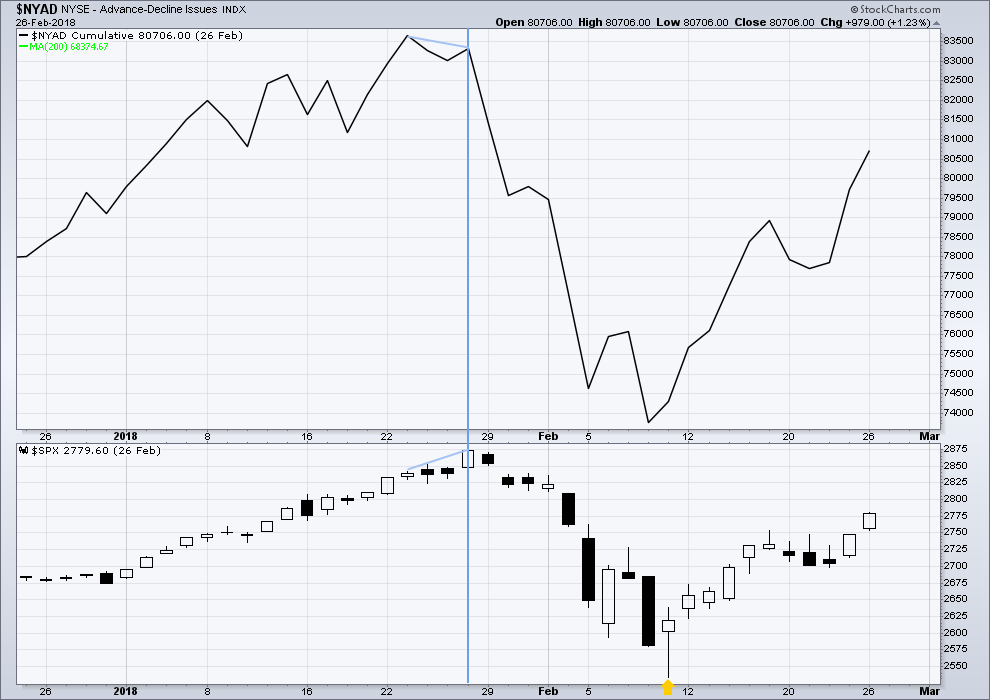
Click chart to enlarge. Chart courtesy of StockCharts.com.
This is a daily chart.
There was only single bearish divergence between price and the AD line at the end of intermediate wave (3). Approaching the high, there were no instances of price moving higher and the AD line moving lower.
Conclusion: When studying the behaviour of price and these indicators just before the start of intermediate wave (4), we may see some clues for warning us of primary wave 4. A cluster of bearish signals from VIX along with a bearish divergence from price and the AD line or On Balance Volume may warn of primary wave 4. The next instance will probably not behave the same as the last, but there may be similarities.
At this time, it does not look like primary wave 4 may begin right now, but we need to be aware of its approach.
Published @ 07:22 p.m. EST.
—
Careful risk management protects your trading account(s).
Follow my two Golden Rules:
1. Always trade with stops.
2. Risk only 1-5% of equity on any one trade.

Wow! Closed out UPRO yesterday, was kicking myself for a small loss. Feeling pretty smart today.
Wow! I step away to get in a quick morning surf session, and the market just plummets.
Surprises to the downside during primary wave 4 seems to be the thing.
That target 2,824 did not have a good probability.
Hi Lara
Are we heading to 2717 or lower?
Thank You
I guess the bankster’s ran out of money?
Or they have timed the collapse perfectly for the US mid-term elections.
Yahtzee Rodney!!
Seems that way. No buying into the close this time!
Close enough for me to call this the 100 SPX point drop that some have forecast.
ES just gapped down of the 5 min… exaustion?
The NDX is already off 9.3% from it’s highs a week or so ago. Fast approaching the intermediate 4 sell off size in Jan/Feb. Approaching done…or just getting started?
My equal weighted FAANGM ticker that I’ve shown a few times recently, was in a long daily squeeze…but no longer! Lots more room to rumble south, too.
what a previous battle pivot? 2800? i see alot of 2790
Any thoughts about going long in the last 10 – 15 min of today’s trading today?
I wont be touching, when this happened at the beginning of February the lows were made overnight before the first significant bounce
nice call!
Will be nice to see a 1000 point drop in the dow into the close!!
Have to remember
Bulls make money, bears make money, pigs get slaughtered”
So in the 1st hour of normal trading Thursday?
Depends, /ES lows were made in the PM of the big flush (which was a Monday), but SPX lows were made that Friday. Not saying I expect it to happen that way this time, but that’s how it went down in February.
For me, if it does capitulate I will take my profit and stay on the side and see what price does
I have seen many times when the bounce begins overnight and then you would have missed the whole thing.
Looks like 2800 is holding.
the next 20 minutes will tell!!
Didn’t buy… will try in 1st hour or so of trading.
Just a quick check-in.
Looking through the comments, did ANYONE trade this impulse down??!!
Wow!
Take care everbody!
2888 > 2871 ……. short ride (I’m still riding the trading short bus) and thanks to Lara a short trip to 2825
and done….
? Is the Pope Catholic?
Incredible day here Verne, we tagged out of VIX a touch early, but we’ll take the 400 basis points on the day and live to fight another day!!! YeW!
Chris, we got some additional triggers yesterday and added SPX 289 puts (expiring today) for 1.23 just before the close. They went for over 12.00 today. Really incredible stuff. Very rare set-up.
Those guys at Artemis are really something! We are just warming up they think…
That’s incredible!
I’m going to label minor wave 4 over even though it’s not in proportion to minor wave 2. It does now show up clearly on the daily chart, so they both show up. This strong downwards movement is too strong to be a B wave.
The target for minor wave 5 does not have a good probability. Minor wave 5 is not very likely to exhibit a Fibonacci ratio to either of minor waves 1 or 3, because the S&P rarely exhibits ratios between all three actionary waves. It usually only exhibits ratios between two.
With this strong downwards movement today I’m discarding the alternate wave count.
I have confidence today that primary wave 4 has indeed arrived.
thank you sooooooo much Lara!
Or perhaps Minor 4 is actually only minute ii of Minor 3? Momentum seems to be increasing today.
next target 2783?
boom 2785.56, got to love EW
Thanks Lara and thanks for everyone else for commenting.
Hope everyone has made some money today 🙂
NDX has hit and bounced (a little) off an overlapped 38% retrace fibo and a major swing high from back on March 13. I don’t know if it holds, I just note it’s in place.
I had to go away for a bit. I am back only to see that the “falling knife” has continued to fall. It looks to me like we are in the middle of some sort of third wave. I don’t see any positive divergences indicating a temporary bottom yet. But we have a lot of trading to go today. It reminds me some on this blog have said in the very near future we will see a 100 point drop in the SPX. It looks like a liquidity issue is brewing and there will be a whole host of margin calls going out tonight.
Yes, it could be the middle of a third wave. I’ll chart that idea too.
Or it could be a strong fifth wave, some commodity like behaviour.
taking a long bite at 2835
SPX daily with symmetric move projections covering the last year and key fibo levels.
I do think it’s very possible (likely) that SPX goes lower than anything shown here. The Jan/Feb initial move down was -11%. That was an intermediate 4, this is a primary, so I think our nominal expectation is a move equal or large (though of course that’s not required). A -11% overall move here puts SPX at 2616. So somewhere in the 2500’s is quite possible, if not likely in the end.
Interesting that all the downwards movement (so far) has been from morning selloffs… followed by afternoon rallies. Conventional wisdom says that retail trades in the morning, while institutions trade in the afternoon, right? Is this smart money or dumb money at work here?
SPX now below lower BB on daily, 4 hour, and hourly.
Who is thinking about taking a long position today? Hint: I am.
Rodney I have a contract at 2872 long and a short at 2872. Based on yesterday’s analysis. Market opened and south bound it went. Got out of short at 2865 thinking there was going to be a bounce but no. Further south it wentand now have only gone for another long contract with the hope we get to 2865
Waiting for the rest of the pack to jump on
Hmm. The 1 min, 5 min, hour, and daily are all STRONG DOWN TREND. The weekly isn’t even up: it’s back to neutral (my readings). Only the monthly is still “up”.
And the WC strongly indicates price has JUST STARTED a P4 down.
It doesn’t seem like the time for a highly disciplined positional trader to go long to me.
But maybe you are falling into the dark side of shorter term trading…
The idea of a 5th wave based on VIX (as presented below) no longer holds as we see a higher high in VIX today relative to 10/8.
However, one cannot conclude based on this information that today’s move is not a 5th wave. The idea just does not have support from VIX price.
Is this the bounce now
Okay the intermediate 5 lower channel line is DESTROYED and even I accept that P4 is now ON.
The bears are dancing in the streets, I see ’em out there!!
Wowza. What an open. It is amazing to me how quickly the markets can change from strongly bullish to strongly bearish. We must discern if Minor 4 of the main count was complete yesterday and this move down is Minor 5 to complete Intermediate A. Or, can today’s move still be Minute b of Minor 4?
I am not sure. I am thinking this SPX drop of 30 points is too deep to still be Minute B of Minor 4.
Something I learned from Verne is that wave 3 of a move in VIX often or usually achieves a higher high (or lower low) than the following wave 5 move. Right now, today’s high in VIX is below that of 2 days ago (10/8). This would indicate today’s move down is a 5th wave. Let’s see if this continues to hold true for the day.
The daily VIX is above its upper BB for the 4th consecutive day.
These two things are leading me to suspect that today might be a temporary low to be followed by several days of upside movement.
As others say, “Not trading advice” just observations for your consideration.
Finally, boy oh boy am I glad I sold all long positions on 9/27.
As the old adage says, “it’s when you sell that counts!”. Well played Rodney.
Hi Lara
Question if we see 2871 in today’s session. Then if there is a small swing. What upwards target would the small swing be. 2890 ?
I think the market has answered your question. There will be no upwards swing.
Foist!