A small range inside day does not offer clarity as to which Elliott wave count is correct. Candlesticks and the short term volume profile are analysed to determine the most likely direction for tomorrow.
Summary: At this stage, it would be best to let price tell us if primary wave 3 is over or not.
Long upper candlestick wicks and a short term volume profile support the idea that price may move lower tomorrow.
While price remains above 2,864.12, then this may still be another pullback within an ongoing upwards trend. The target is now at 3,012.
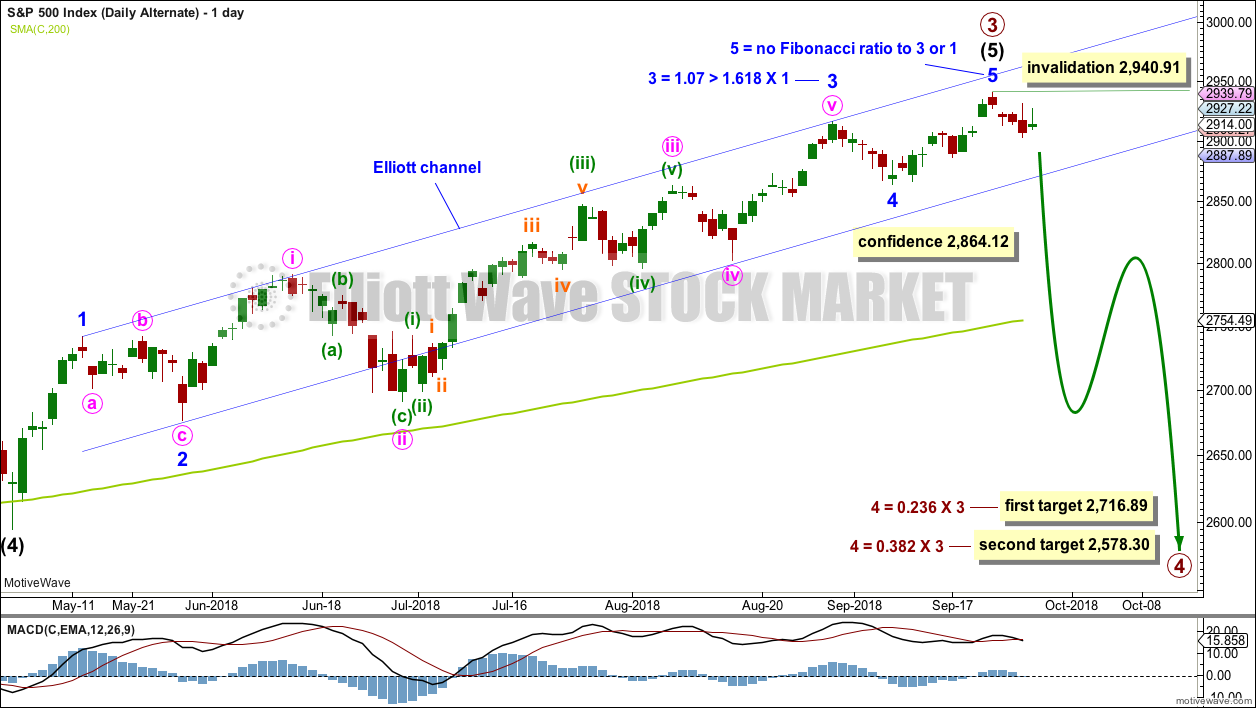
If price makes a new low by any amount at any time frame below 2,864.12, then some confidence that primary wave 4 has begun may be had. Targets are either 2,716.89 or 2,578.30. There is now enough bearishness from the AD line to take this possibility fairly seriously. Primary wave 4 is expected to be a large choppy consolidation, which may last about a Fibonacci 13 weeks.
The final target for this bull market to end remains at 3,616, which may be met in October 2019.
New updates to this analysis are in bold.
The biggest picture, Grand Super Cycle analysis, is here.
Last historic analysis with monthly charts is here, video is here.
MAIN ELLIOTT WAVE COUNT
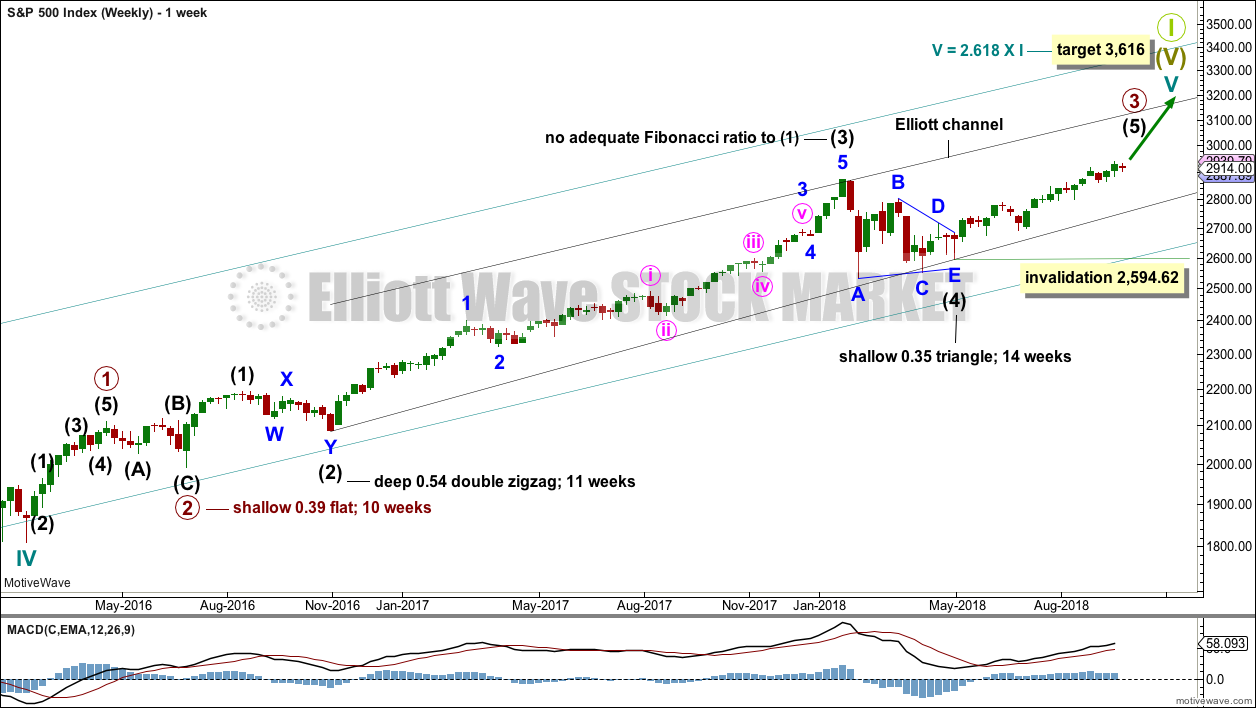
WEEKLY CHART
Cycle wave V must complete as a five structure, which should look clear at the weekly chart level and also now at the monthly chart level. It may only be an impulse or ending diagonal. At this stage, it is clear it is an impulse.
Within cycle wave V, the third waves at all degrees may only subdivide as impulses.
Intermediate wave (4) has breached an Elliott channel drawn using Elliott’s first technique. The channel is redrawn using Elliott’s second technique: the first trend line from the ends of intermediate waves (2) to (4), then a parallel copy on the end of intermediate wave (3). Intermediate wave (5) may end either midway within the channel, or about the upper edge.
There is perfect alternation and excellent proportion between intermediate waves (2) and (4).
At this stage, the expectation is for the final target to me met in October 2019. If price gets up to this target and either the structure is incomplete or price keeps rising through it, then a new higher target would be calculated.
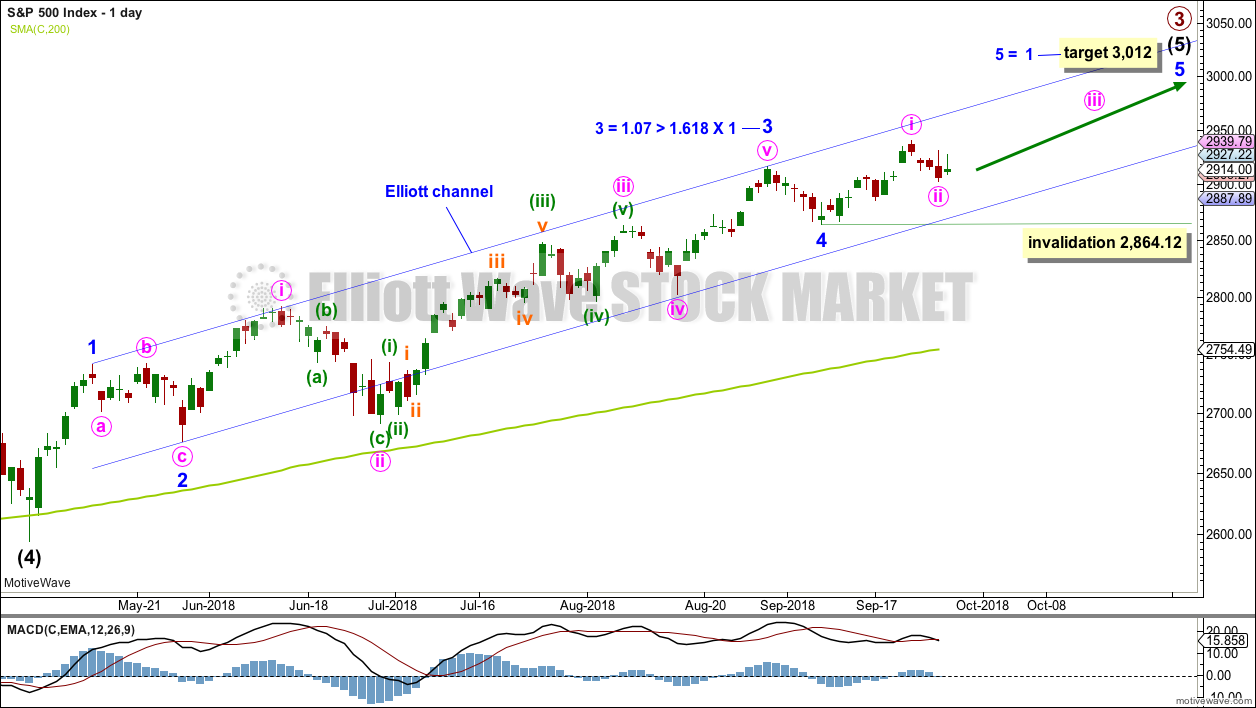
DAILY CHART
Intermediate wave (5) avoided a truncation now that it has a new high above the end of intermediate wave (3) at 2,872.87.
Intermediate wave (3) exhibits no Fibonacci ratio to intermediate wave (1). It is more likely then that intermediate wave (5) may exhibit a Fibonacci ratio to either of intermediate waves (1) or (3). Intermediate wave (5) has passed equality in length and 1.618 the length of intermediate wave (1). The next Fibonacci ratio in the sequence is 2.618 giving a target at 3,124. If the target at 3,012 is met and passed, then this would be the next calculated target.
A target for intermediate wave (5) to end is calculated at minor degree.
Intermediate wave (5) is unfolding as an impulse, and within it minor waves 1 through to 4 may now all be complete.
Within intermediate wave (5), minor wave 3 was extended. Minor wave 5 may also extend.
Minute wave ii may not move beyond the start of minute wave i below 2,864.12.
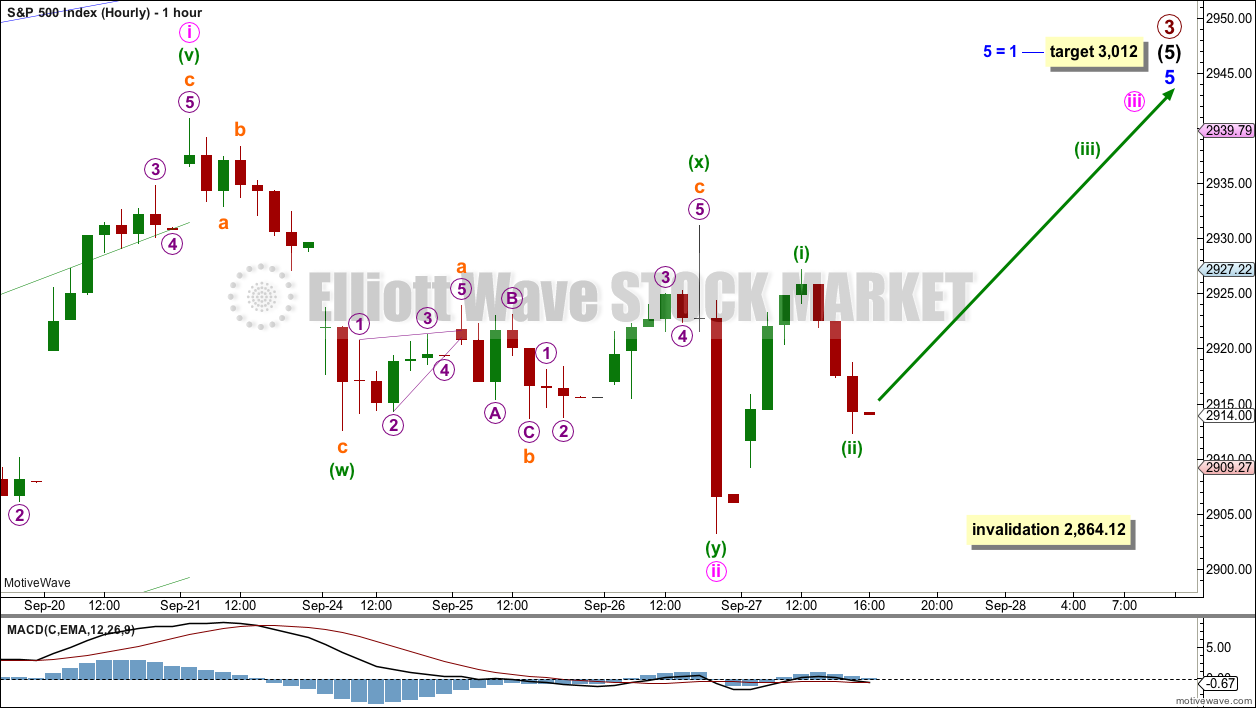
HOURLY CHART
If minor wave 5 extends, then it may have begun with a leading expanding diagonal for minute wave i.
Minute wave ii now fits as a completed double zigzag; on the five minute chart, minuette wave (y) looks like a zigzag and not an impulse. Minute wave ii may be over here, or it may continue sideways as a flat or combination.
Minute wave ii may not move beyond the start of minute wave i below 2,864.12.
There may now be two overlapping first and second waves complete to begin minor wave 5. This wave count would now expect some increase in upwards momentum.
ALTERNATE ELLIOTT WAVE COUNT
DAILY CHART
It is possible to see now that primary wave 3 could be over at the last high five sessions ago by simply moving the degree of labelling within minor wave 5 up one degree.
It is reasonably common for the S&P to exhibit a Fibonacci ratio between two actionary waves within an impulse, and uncommon for it to exhibit Fibonacci ratios between all three actionary waves within an impulse. The lack of a Fibonacci ratio for minor wave 5 within this wave count is not of any concern; this looks typical.
Primary wave 4 would most likely end somewhere within the price territory of the fourth wave of one lesser degree. Intermediate wave (4) has its price territory from 2,872.87 to 2,532.69. Within this range sit two Fibonacci ratios giving two targets. The lower 0.382 Fibonacci ratio may be more likely.
Primary wave 2 unfolded as a shallow regular flat correction lasting 10 weeks. Primary wave 4 may exhibit alternation in structure and may most likely unfold as a zigzag, triangle or combination. A zigzag would be the most likely structure as these are the most common corrective structures and would provide the best alternation with primary wave 2.
Primary wave 4 may not move into primary wave 1 price territory below 2,111.05. However, the lows in primary wave 4 should not get close to this point. The lower edge of the teal channel on the weekly chart should provide very strong support.
HOURLY CHART
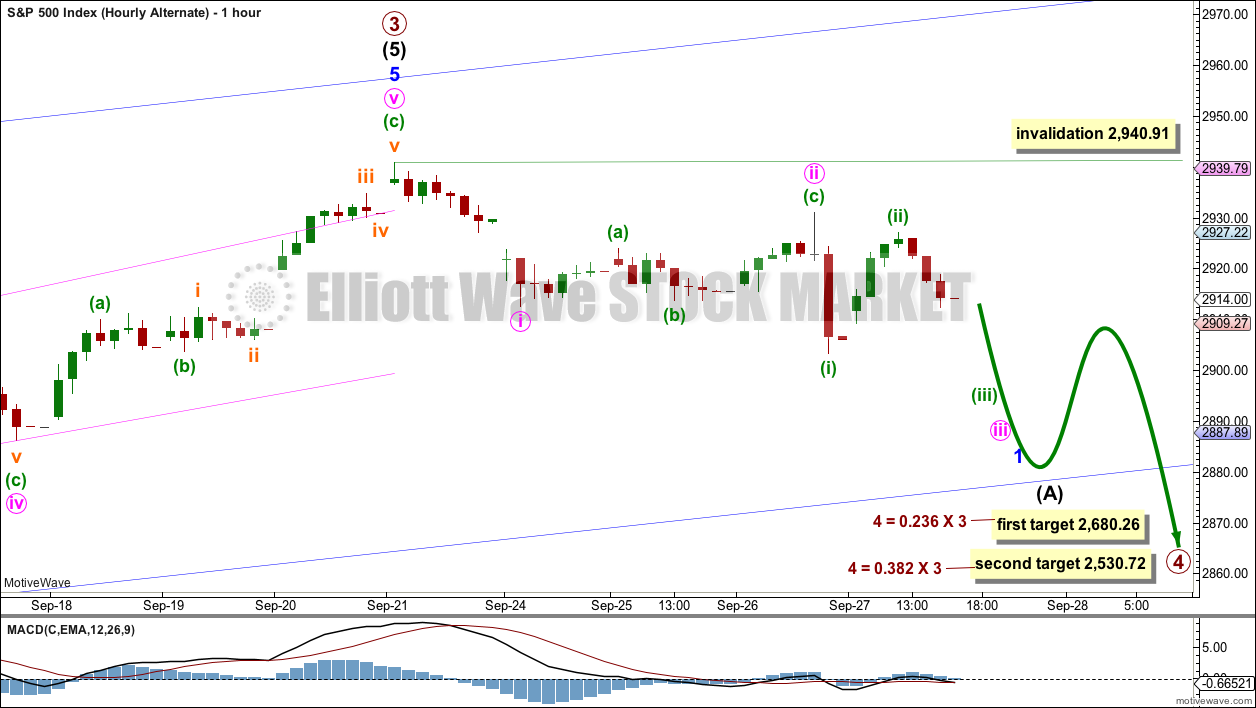
A movement at primary wave degree should begin with a five wave structure downwards. So far that would be incomplete.
The first five down may be labelled minor wave 1. So far minute waves i and ii may be complete. If minute wave ii moves any higher, it may not move beyond the start of minute wave i above 2,940.91.
A target that expects the most common Fibonacci ratio to minute wave i is calculated for minute wave iii.
When minute wave iii is complete, then minute wave iv may not move into minute wave i price territory.
This alternate wave count now has two overlapping first and second waves complete. An increase in downwards momentum would be expected.
TECHNICAL ANALYSIS
WEEKLY CHART
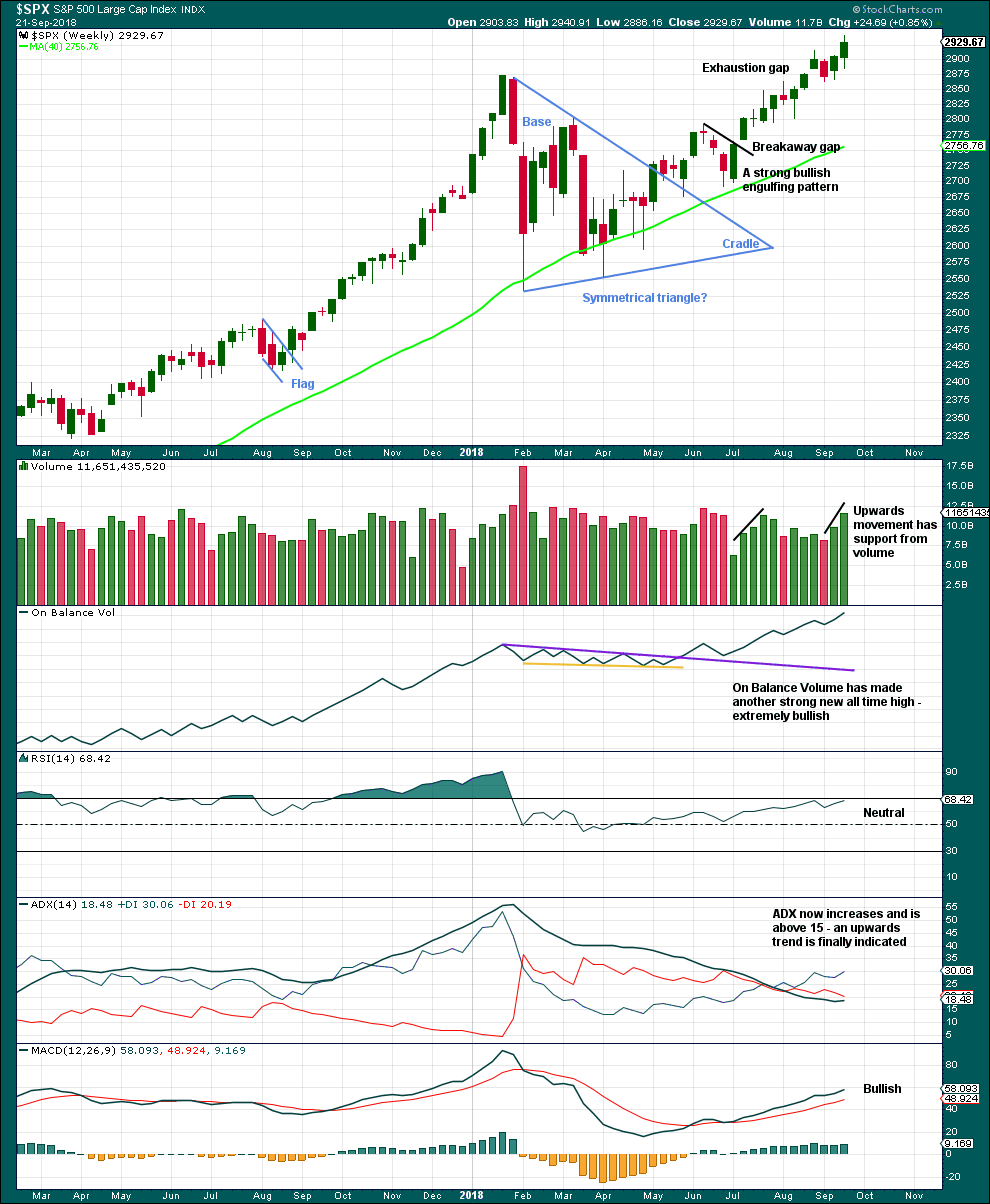
Click chart to enlarge. Chart courtesy of StockCharts.com.
The symmetrical triangle base distance is 340.18. Added to the breakout point of 2,704.54 this gives a target at 3,044.72. This target has not yet been met.
This chart is completely bullish. RSI is not yet overbought, so there is room for price to rise.
DAILY CHART
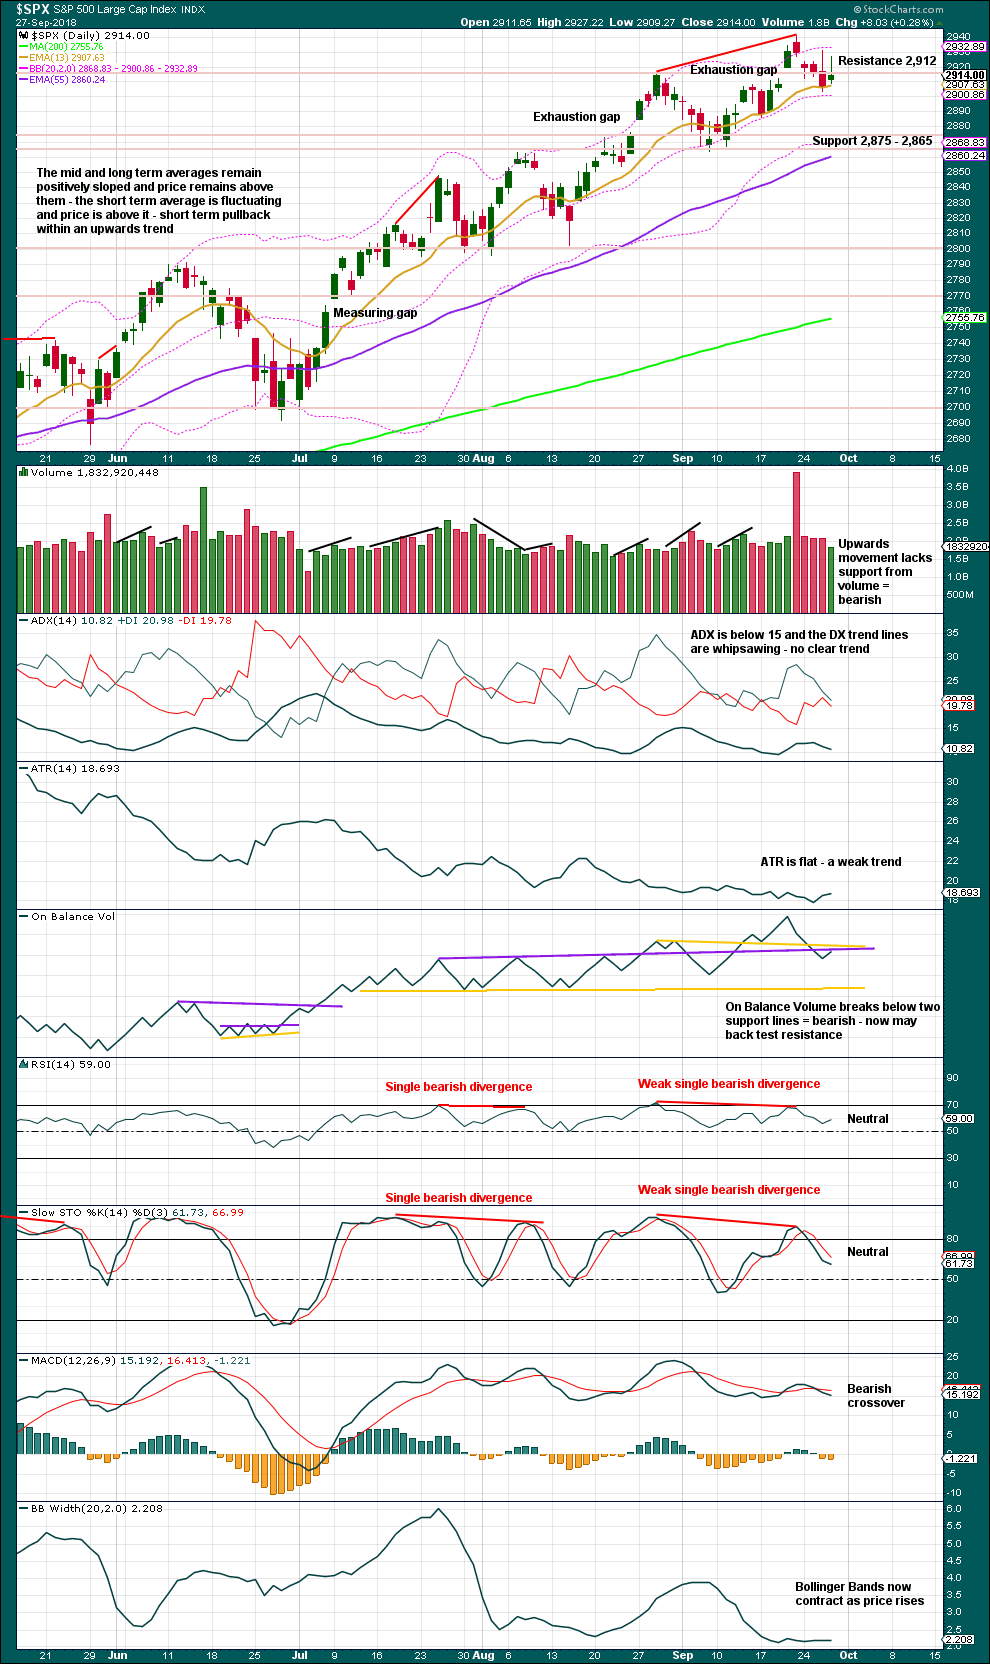
Click chart to enlarge. Chart courtesy of StockCharts.com.
Closure of the last gap is bearish. The gap is now labelled an exhaustion gap.
The long upper wicks on the last two daily candlesticks are bearish.
The market is falling of its own weight. Price can continue to fall for a reasonable distance due to an absence of buyers. A lack of support for upwards movement today gives a short term bearish volume profile.
The bottom line remains that an upwards trend remains intact until price makes a new swing low. Look now for strong support about 2,875 – 2,865. If price makes a new swing low below 2,864.12, that would indicate a change from an upwards trend to either a larger sideways consolidation or a new downwards trend.
VOLATILITY – INVERTED VIX CHART
WEEKLY CHART
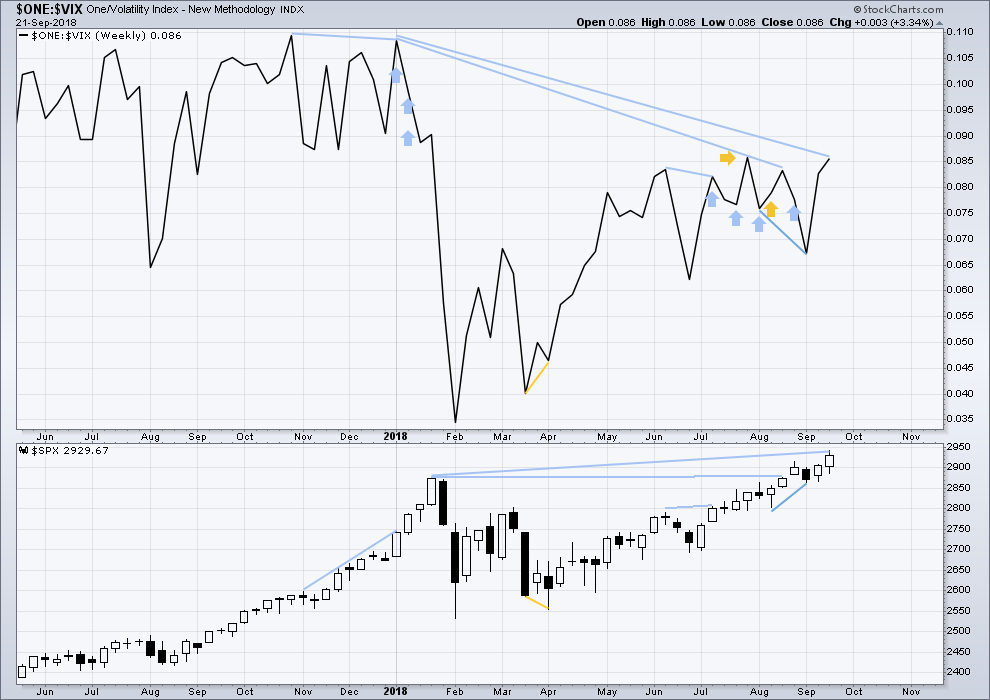
Click chart to enlarge. Chart courtesy of StockCharts.com. So that colour blind members are included, bearish signals
will be noted with blue and bullish signals with yellow.
To keep an eye on the all time high for inverted VIX a weekly chart is required at this time.
Notice how inverted VIX has very strong bearish signals four weeks in a row just before the start of the last large fall in price. At the weekly chart level, this indicator may be useful again in warning of the end of primary wave 3.
At this time, there is mid term bearish divergence between price and inverted VIX: price has made another new all time high, but inverted VIX has not. This divergence may persist for some time. It may remain at the end of primary wave 3, and may develop further to the end of primary wave 5.
Upwards movement in price has support last week from a normal corresponding decline in market volatility. There is no new short term divergence.
DAILY CHART
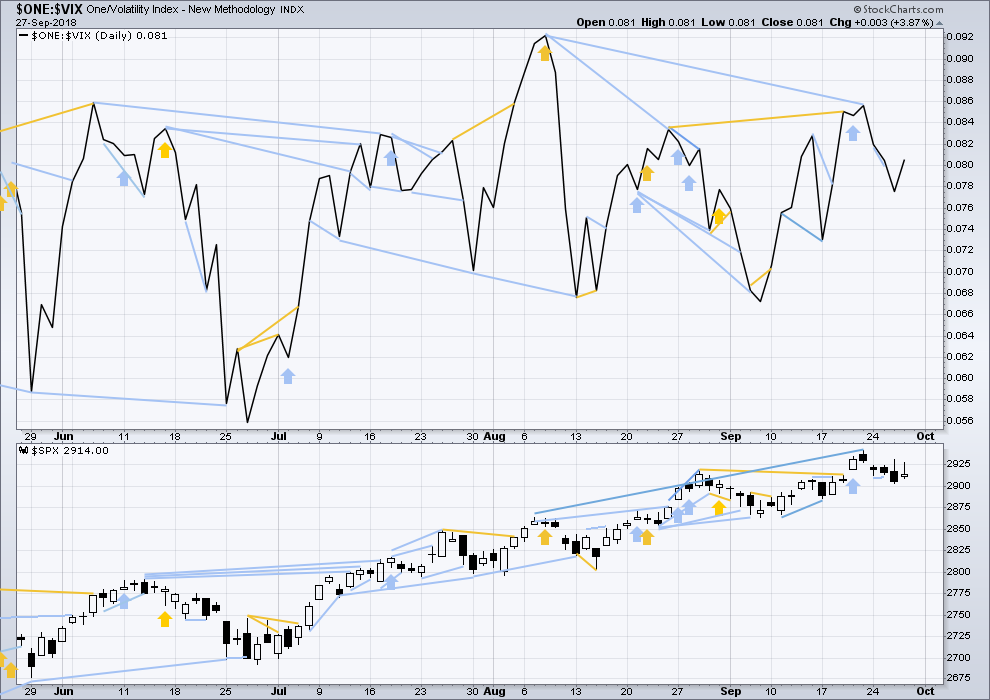
Click chart to enlarge. Chart courtesy of StockCharts.com. So that colour blind members are included, bearish signals
will be noted with blue and bullish signals with yellow.
Normally, volatility should decline as price moves higher and increase as price moves lower. This means that normally inverted VIX should move in the same direction as price.
There is mid term divergence with a new all time high from price not supported by a corresponding new all time high from inverted VIX. This divergence is bearish.
The rise in price today comes with a normal corresponding decline in market volatility. There is no short term divergence.
Mid term bearish divergence between price and inverted VIX can be seen on both daily and weekly charts now. However, this may not be a good timing tool in identifying the end of primary wave 3; divergence may develop further before primary wave 3 ends.
BREADTH – AD LINE
WEEKLY CHART
Click chart to enlarge. Chart courtesy of StockCharts.com.
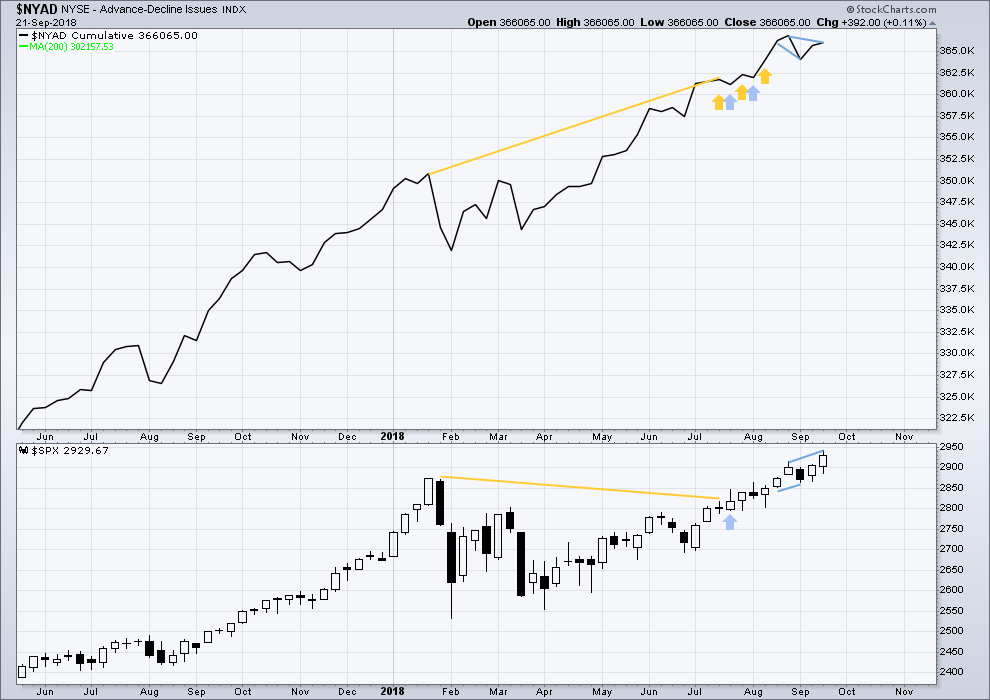
When primary wave 3 comes to an end, it may be valuable to watch the AD line at the weekly time frame as well as the daily.
Price has made a new all time high last week, but it does not have support from rising market breadth. There is now short term bearish divergence at the weekly chart level between price and the AD line. It is possible now that the end of primary wave 3 is quite close.
DAILY CHART
Click chart to enlarge. Chart courtesy of StockCharts.com.
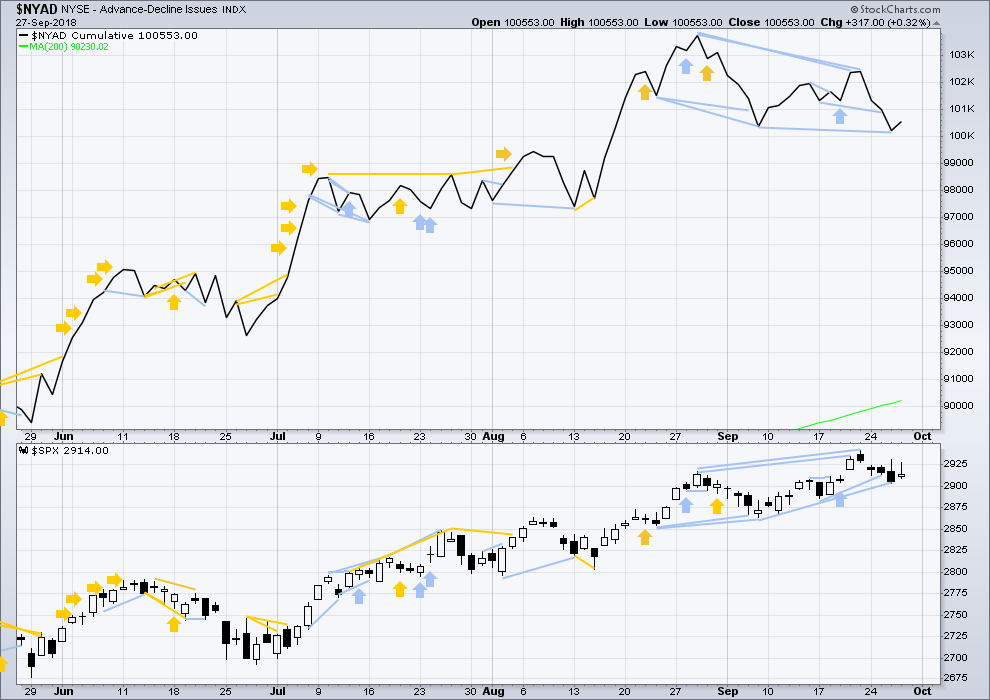
There is normally 4-6 months divergence between price and market breadth prior to a full fledged bear market. This has been so for all major bear markets within the last 90 odd years. With no longer term divergence yet at this point, any decline in price should be expected to be a pullback within an ongoing bull market and not necessarily the start of a bear market. New all time highs from the AD line on the 29th of August means that the beginning of any bear market may be at the end of December 2018, but it may of course be a lot longer than that. My next expectation for the end of this bull market may now be October 2019.
Breadth should be read as a leading indicator.
Upwards movement today has support from rising market breadth. There is no new short term divergence.
There is now a cluster of bearish signals at the daily chart from the AD line; this offers now some reasonable support to the new alternate Elliott wave count.
All of small, mid and large caps made new all time highs on the 27th of August. There is a little divergence here in breadth with large caps continuing to make new all time today and small and mid caps lagging.
DOW THEORY
The following lows need to be exceeded for Dow Theory to confirm the end of the bull market and a change to a bear market:
DJIA: 23,360.29.
DJT: 9,806.79.
S&P500: 2,532.69.
Nasdaq: 6,630.67.
Nasdaq and DJT and now the S&P500 have all made recent new all time highs.
At the end of last week, DJIA has now also made a new all time high. This provides Dow Theory confirmation that the bull market continues.
Charts showing each prior major swing low used for Dow Theory may be seen at the end of this analysis here.
ANALYSIS OF THE END OF INTERMEDIATE WAVE (3)
TECHNICAL ANALYSIS
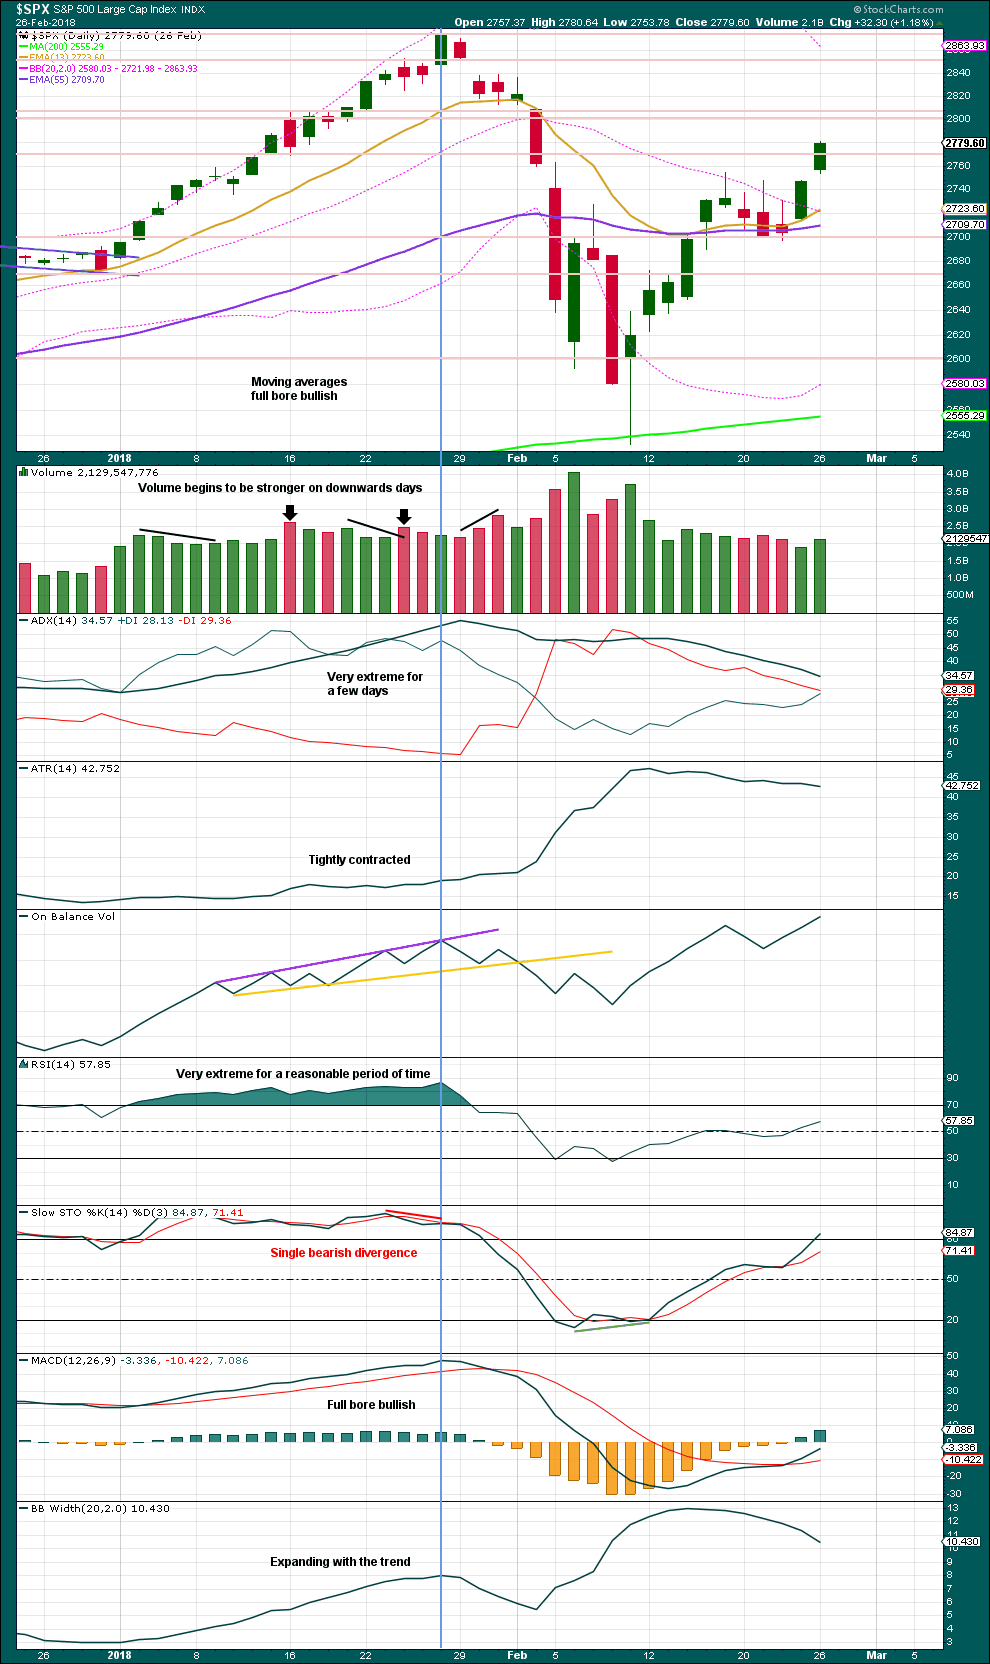
Click chart to enlarge. Chart courtesy of StockCharts.com.
This chart looked overly bullish at the end of intermediate wave (3). The only warning in hindsight may have been from volume spiking slightly on downwards days. There was no bearish divergence between price and either of RSI or On Balance Volume.
Single bearish divergence between price and Stochastics was weak, which is often an unreliable signal.
VIX
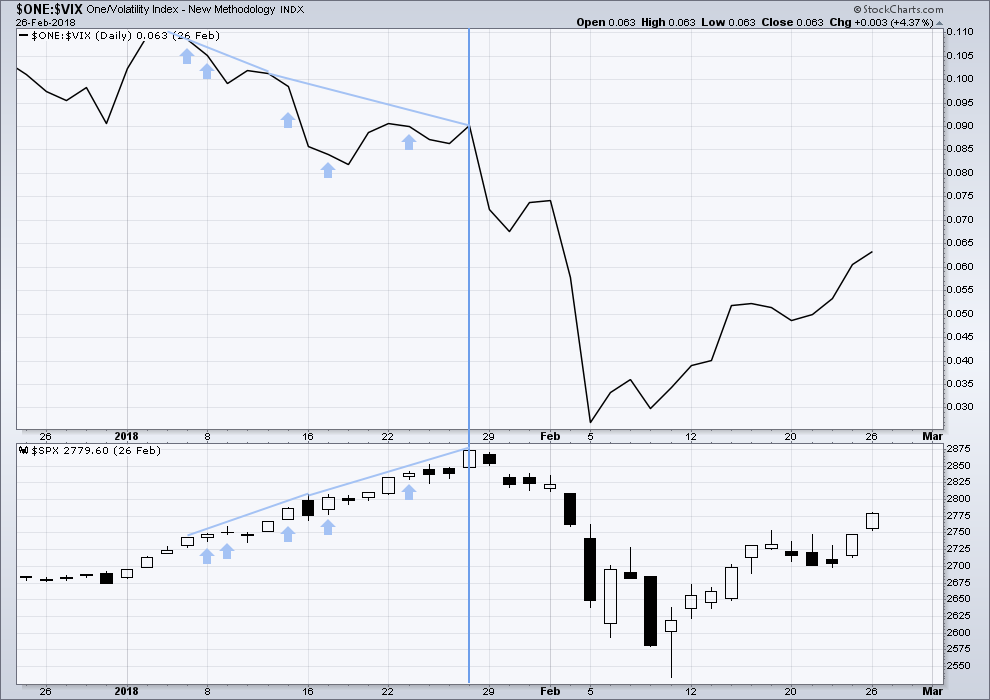
Click chart to enlarge. Chart courtesy of StockCharts.com.
This is a daily chart.
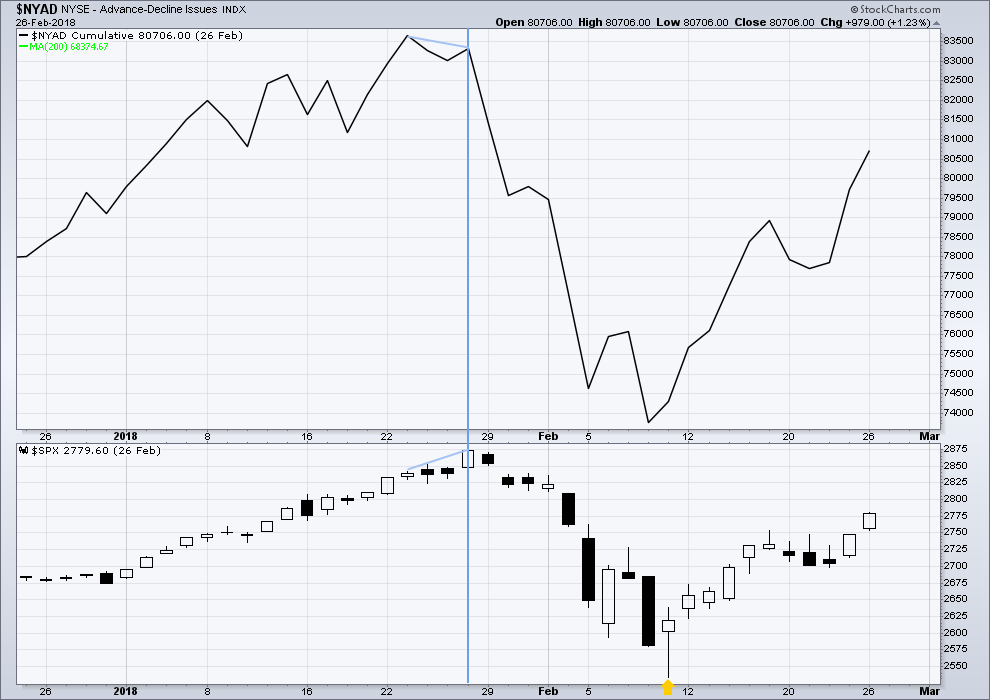
The strongest warning of an approaching intermediate degree correction at the daily chart level came from inverted VIX.
There was strong double bearish divergence at the high of intermediate wave (3), which is noted by the vertical line. There was also a sequence of five days of bearish divergence, days in which price moved higher but inverted VIX moved lower.
AD LINE
Click chart to enlarge. Chart courtesy of StockCharts.com.
This is a daily chart.
There was only single bearish divergence between price and the AD line at the end of intermediate wave (3). Approaching the high, there were no instances of price moving higher and the AD line moving lower.
Conclusion: When studying the behaviour of price and these indicators just before the start of intermediate wave (4), we may see some clues for warning us of primary wave 4. A cluster of bearish signals from VIX along with a bearish divergence from price and the AD line or On Balance Volume may warn of primary wave 4. The next instance will probably not behave the same as the last, but there may be similarities.
At this time, it does not look like primary wave 4 may begin right now, but we need to be aware of its approach.
Published @ 10:28 p.m. EST.
—
Careful risk management protects your trading account(s).
Follow my two Golden Rules:
1. Always trade with stops.
2. Risk only 1-5% of equity on any one trade.

hourly chart updated:
another first and second wave completing
Yep. I think we get a quick dip on Monday then off to the races. Every time we see this sort of divergence with DAX, one or the other usually plays catch up. Holding DIA puts with hopefully a profitable exit Monday a.m.
Finance looks like it’s a already started it’s P4 down!!
Ya’ll might remember I’ve pointed to veeeeeery long weekly squeeze a number of times. Well, it’s out of it…and the chart looks about as bearish as a chart can.
Remember, finance was the bull market leader. Since the intermediate 5 started, it’s been the bull market dog. Now…it just might be the bear market leader!! And is flashing a huge, huge warning here.
Look like a continuation triangle to me. That’s not bearish.
You can make a “win 4 lose 1” bet on SPX right now that it’ll be at or below 2805 by Jan 18. Put debit spread in SPX, Jan expiry, buy the 2830, sell the 2805. (Infinite variations are possible of course, just one example). Who needs precision in trading, really, if we know what’s gonna happen over the next few months one way or another? Well, it’s one way to handle what we think we know (big down coming soon) vs. what we are pretty confident we aren’t sure of (more up first???).
Even though we are flat today, it “felt” fairly bearish. The short trade is definitely on the horizon, though I’m usually too early. The fact that today is month-end and vix/uvxy aren’t signaling any fear coupled with Lara’s count are keeping me on the sidelines. We’ll see if any news drops this weekend.
For those who like their falling knives still quivering from the stick!
EA weekly. Shows the power of the derived (sqrt(.618)) fibo retrace level of 78.6%. A perfect hit and then multiple re-hits, with nary a penetration.
Now the turn…but is it a “dead cat bounce”? I have real trouble taking trades on this kind of massive sell off set up myself, but some I know focus pretty exclusively on them. What they do though is interesting: they go large, and they exit FAST on the turn up. No waiting around for increasingly uncertain price action: just take the “sure thing” bounce and move along!
I
I don’t think we have a turn quite yet. The attempt to keep short trades at bay suggests we have another move down ahead before a final wave up. We could see a low in the a.m. on Monday. Later!
I love the confidence if “final wave” call Verne, lol! We are tracking 6 massive instances of chicanery today. Another just a moment ago. There’s an incredible amount of capital being used to prop up.
Tell me about it! It is truly terrifying what they are doing.
As long as they are successfully defending the round number pivots I am proceeding on the cautionary note that they still have a measure of control. The P4 turn should really see an initial move down of at least 100 UNINTERRUPTED SPX points. Anything less and they are playing us!
Artemis Capital is ignoring the noise. They are only interested in the Big Kahuna with a 100% return on capital, or more, when it hits. What discipline!!!!!
They are an epic firm. What they’re doing terrify’s me much more now, due to the fact that smart money exited late last year, which significantly reduces the ability of profit taking exits, sell stop exits, or large portfolio re positioning to over power the central banks. I standby, no primary degree correction can occur, due to market structure and present participation, unless the central banks stop. Kevin, a trade you might be interested in looking at is SRCL (not trading advice). Initiated a small long and Nov bull put spread today.
SPX hourly is now in hour 4 of a squeeze.
EEM looks like it just might be turning back down at the juncture of the daily tf down trend line and the 23.6% retrace of the Jan-Sept down move. I’ve got a bear spread on stop above 43.34. EEM should completely tank in the course of a P4, I would expect.
RUT’s perfect bounce off it’s 61.8% has held, but it…just…can’t….quite….break the down trend line on the hourly. I’ll feel better when it does.
Watching how almost every day GLD and DXY move in direct opposition.
TLT slowly grinding back up in that giant trading range.
Fast Times at Ridgemont High (and, apparently, Georgetown Prep too).
I was assuming that when/if market sells off, some of that money will flow into bonds due to attractive yield over 3%, especially compared to other safe bonds around the globe. But as we’re turning down right now (I know its not confirmed down trend yet) TLT hasn’t been moving up like I had thought. But GLD and SLV are up nicely…
TLT is going higher….much higher!! 🙂
Good trade on EEM. Along with EFA and EMB, I call ’em the ” ‘Ole Faithful” trio! 🙂
Sell signal on 60 min…!!
What might said signal be?
Whipsaw. I have a few short term expo moving averages I like to follow in addition to gap penetration.
Whipsaw signals are typical for triangles and EDs.
I’ve put a bit earlier this morning a bull debit spread on IWM. Why? Here’s RUT daily showing the set up.
And the triggers (polarity inversion and trend change from down to neutral; no trend line break yet though).
I’ll exit (“stop”) on a move below the 61.8% at 1686.95.
I just put on a put debit bear spread on CVX. Why? Here’s the daily showing the set up…
And here’s the hourly showing the triggers (trend line break…switch to “down trend” (red bars)…polarity inversion (swing lows formed and exceeded).
My stop is not live in the market, but is very much active! Price above 124.35 (the 61.8% fibo) takes me out. I expect I lose perhaps 1/3’rd of what I will make if I’m correct. AND I think “correct” has a definite edge due to the set up. So I view this trade as very +EV (“expected value”).
Yep. Looks like the rascals are going to try and keep things propped up until the close…looking for a return to gap area to trigger alert….
We do not have an official sell signal yet but I know how the banksters roll. A couple things about today’s ramp look suspect.
Buying DIA Oct 12 265 strike puts for 2.00
Will add to position on break of SPX 2900, or throw over of upper wedge boundary.
If we take out today’s low it will unmask another failed phony ramp to negate an open gap down….berry, berry, bearish! 🙂
While not always a sure thing, the dive in DAX just might be a clue as to where we are headed…we could see the 2900 pivot go bye bye…. 🙂
good point. The italian and german markets got wacked
The cartel is clearly defending the 2900 pivot.
Failure of that pivot to fall suggests to me P4 not yet underway. Short trades, unless they are scalps, while price above 2900 in my opinion not worth the effort…
Machines are programmed to move price just past fib retracements to run commonly used stops. There are a few technical papers about the practice. If you have ever wondered why price often seems to run just past your stops and magically reverse…well, now you know. This is one reason I never place stops in the market. This all highlights the critical importance of getting the main trend right.
I am mostly in cash…
Yes..and, that’s why I use “triggers” for buying, not just an approach/touch (mostly/usually). I need to see confirming movement and indications in the direction I’m trading after the fibo bounce. A polarity inversion, trend change, trend line break, or some combination of these at a lower timeframe. That helps weed out the false bounces. And my personal view is that high volume markets are not so casually manipulated…but I realize that view is not shared and we don’t need to debate it.
I don’t understand what you mean when you say “I don’t use stops”. I presume that means you don’t use live in the market stop orders; certainly I don’t on option trades! But I have “stops” meaning if price moves to some level, I take my medicine and exit. I presume you mean the same. I wouldn’t want any newbies to get confused about that.
I use mental stops. As Nison wisely observes, you should always have a number that says you are wrong!
I just don’t place them in the market where they can be seen. 🙂
Makes sense.
The issue here is the presumed understanding of “stop”. When we say it are we referring to a live in market order of a particular type? Or a conceptual framework for managing risk that can be physically implemented through quite a number of means? You tend to use “stop” to mean an actual order; many (particularly newbies) might interpret you more conceptually and reach some really bad conclusions.
Knowing how they deliberately run them, I almost never mean a stop placed in the market, but rather a price at which I will exit the trade to limit loss.
The exception is a “buy” stop if I want to buy something IF it hits a pre-determined price.
Just so newer members are very clear here, ALWAYS TRADE WITH STOPS.
Verne is using stops, he’s just not placing stop orders. He still has a price point beyond which he will close the trade. That approach requires a trader to be constantly watching the trade and a chart while the trade is open.
Anyone in this membership who is found to be trading without stops may find their membership cancelled and they may be blacklisted. I am that serious about risk management, and stops are essential.
I say this because we have had members here before who traded without stops, the main count was invalidated and an alternate with the opposite view was confirmed, and they then wanted us to help them close their losing position. And then they blamed me for runaway losses. I’m not going to let that happen again.
Yep! Absolutely critical to limit your losses, and you should know “when” BEFORE you make the trade! 🙂
A good friend of mine who is one of the best chartists I know had to be hospitalized unexpectedly and could not manage her account during the interim. Her open positions were tragically on the wrong side of the trade and she blew up her account and life savings with it. NEVER trade without knowing prior exactly how much you are willing to LOOSE!
Wow. That’s a strong lesson there to always place a hard stop on your account for every trade left open, if you step away from the screen.
Why I trade off fibo levels and use them as stops? To minimize losses! This daily chart of DWDP chart says it all. I bought on a short term fibo bounce at a lower time frame as it came down…got stopped right underneath that fibo for a very small loss…whew!! I hope others managed to exit safely. What a debacle!!! -8% for a major industrial in 5 days. “Interesting….” said Mr. Spock with a raised eyebrow. Could it be anticipatory of the P4 coming? Maybe, maybe.
As the boxing trainer says, “protect yourself at all time!!”.
Yeah I got out of it too when it had a small bounce up and didn’t follow through to the upside on Tuesday. It may very well be a signal to what’s coming to the overall market.
“A picture is worth a thousand words.”
Below is a possible ending diagonal on a 4 hour chart. Ending diagonals are wedges in classical TA nomenclature. A break of the bottom line spells trouble.
BTW, I cannot confirm that this count meets all Elliott Wave Theory requirements.
I have a similar but different view, in which exactly and only the minor 5 is an ending diagonal, and is concluding it’s D wave down now. Your model starts diagonal before the start of what we believe is the beginning of minor 5. Not to say your’s is wrong, only that the one I’m showing is a bit more consistent with our current wave count.
You are correct, Kevin, in that the chart I show has all of Intermediate 5 as an ending diagonal for the completion of Primary 3. (BTW, I believe ending diagonals are usually labeled 1 through 5 rather than a-b-c-d-e, which is used for triangles.)
Oops! I did not notice Rodney had the ED labelled as complete. It would be unlikely for that pattern as you need a upper boundary throw-over, and also the first wave down after the ED completes to punch decisively through the lower wedge boundary. The pattern has very disticnct characteristics that confirm it.
The 1-3 trend line throw over happens almost all the time, but very occasionally it does not. But yeah, the lack of a throw over does substantially reduce the probability.
I have seen a few ED counts. That lower wedge boundary ALWAYS gets swiftly taken out when the ED completes. This is also expected for a P4 turn down.
Great chart!
P.S. If correct, we should expect an upper boundary throw-over next.
Sorry Rodney, no, it does not meet EW rules for an ending diagonal. Four does not overlap one. All other rules for a contracting diagonal are met though.
RUT has bounced at 5 min level off a major 61.8% at 1686.95. Will it hold? In this soft market, I’m doubtful, but it’s worth watching.
SPX isn’t going to tank without the other markets, particularly tech. Here’s the monsters of tech, equal weighted ticker, weekly chart.
Note the 3 weeks of squeeze in play right now, during a period I can only call a “flag”…or “churning at the top”. I see one sell off out of a squeeze on the chart, back in late 2015. Otherwise, every squeeze has exited with strong upward price motion. This time, to support a P4, the exit “must” be down. There’s just no way possible this can exit up…AND we have a P4 landing on SPX. I don’t think that can happen.
Looks like a classic “process” topping formation Kevin. As always: I enjoy your analytic posts
As far as I’m concerned…this is the P3, P4 cusp right here. Price turns back up making this a little multi hour ii down…P3 is on!! Price breaks below the Wednesday 2903 low…I’ll be starting to build short positions, with intent to add more with further confirmation (because 2903 is still a speculative level re: a P4 possibility). Why start getting short speculatively a bit? Because when P4 really lands…price will be down 100 points in 5 minutes, or something of similar bloodbath nature. I want to already have some positions for that initial death drop.
Looking like a possible ED. If so, a wedge throw-over from that consolidation wedge would be a perfect swan song.
HI everyone here
I found a pretty strong pattern going back for the past 7 mid-term elections
5 out of 7 the market went down, Plus the 6th one just was after a nasty recession and bottomed as follows:
10-16-14——– about 9% decline
2010 bad plus we just had a huge decline prior.
2006 flat during the beginning of month bad
10-10-02——– about 6% decline
10-8-98——— about 12+% decline
10-7-94——— about 4+% decline
10-12-90——- about 6% decline
All thoughts would be kindly appreciated.
I think Lara’s second wave count could be correct.
Plus stuff you might know:
Q Ratio is second highest in history from record passing the 1929 high!
Whillshire 5000 to GDP record high just slightly passing the march of 2000 high
S & P 500 to GDP equalling 1960’s Highs and 2000 high
Shiller P/e ratio 2nd highest in history higher now then in 1929
Corporate Debt to GDP is the second highest in history!
We had over 20 hindeburg omens this month the most in over 50 years!
I repeat post tomorrow incase of some of you didn’t catch my post.
Thank You
Very interesting post Eric. The overall market definitely is overdue for a correction of similar magnitude as intermediate 4… the real question is when will it happen? Most people here are predicting within the next 2 weeks…
October is usually a pretty volatile month
Indeed! Great reminder of the importance of keeping the big picture view in mind. Thanks Eric!
Your welcome
I wouldn’t be surprised to see the start of P4 highly aligned with the election results.
I have a feeling we are going to see some pre-election fireworks, both political and financial….Mr Market loves to do the unexoected…. 🙂
?
🙂