A new all time high was expected for the main preferred Elliott wave count.
Members were advised that a pullback looked to be complete as early as the 11th of September, just two days from the last low.
Summary: The structure of minor wave 5 is incomplete. The target remains a small zone from 3,041 (Elliott wave) to 3,045 (classic analysis).
Members are advised now that bearish signals do not necessarily mean price must turn here; some bearishness may be expected to begin to develop and strengthen before primary wave 3 finds its end.
Gaps may be used to pull up stops; stops may now be pulled up to just below 2,912.36.
The final target for this bull market to end remains at 3,616, which may be met in October 2019.
New updates to this analysis are in bold.
The biggest picture, Grand Super Cycle analysis, is here.
Last historic analysis with monthly charts is here, video is here.
ELLIOTT WAVE COUNT
WEEKLY CHART
Cycle wave V must complete as a five structure, which should look clear at the weekly chart level and also now at the monthly chart level. It may only be an impulse or ending diagonal. At this stage, it is clear it is an impulse.
Within cycle wave V, the third waves at all degrees may only subdivide as impulses.
Intermediate wave (4) has breached an Elliott channel drawn using Elliott’s first technique. The channel is redrawn using Elliott’s second technique: the first trend line from the ends of intermediate waves (2) to (4), then a parallel copy on the end of intermediate wave (3). Intermediate wave (5) may end either midway within the channel, or about the upper edge.
There is perfect alternation and excellent proportion between intermediate waves (2) and (4).
At this stage, the expectation is for the final target to me met in October 2019. If price gets up to this target and either the structure is incomplete or price keeps rising through it, then a new higher target would be calculated.
DAILY CHART
Intermediate wave (5) avoided a truncation now that it has a new high above the end of intermediate wave (3) at 2,872.87.
Intermediate wave (3) exhibits no Fibonacci ratio to intermediate wave (1). It is more likely then that intermediate wave (5) may exhibit a Fibonacci ratio to either of intermediate waves (1) or (3). Intermediate wave (5) has passed equality in length and 1.618 the length of intermediate wave (1). The next Fibonacci ratio in the sequence is 2.618 giving a target at 3,124. If the target at 3,045 is met and passed, then this would be the next calculated target.
A target for intermediate wave (5) to end is calculated at minor degree. Because this target is so close to the classic analysis target at 3,045, it does have a reasonable probability.
Intermediate wave (5) is unfolding as an impulse, and within it minor waves 1 through to 4 may now all be complete.
Assume the upwards trend remains intact while price remains above 2,802.49. The trend remains the same until proven otherwise.
HOURLY CHART
Within intermediate wave (5) so far, minor wave 1 was relatively short and minor wave 3 extended (but does not exhibit a Fibonacci ratio to minor wave 1). Two actionary waves within an impulse may extend, so minor wave 5 may be extending.
Within minor wave 5, minute waves i and ii may now be complete. Minute wave iii may only subdivide as an impulse.
Within minute wave iii, minuette waves (i) and (ii) may be complete.
Minuette wave (iii) must subdivide as an impulse. Within minuette wave (iii), subminuette waves i, ii and now iii may be complete. Subminuette wave iv may not move into subminuette wave i price territory below 2,911.17.
The strongest middle portion of minor wave 5 may have completed today. Two more pullbacks (minuette wave (iv) and minute wave iv) may unfold along the way up to the target at 3,041. Each of these upcoming fourth wave corrections must now remain above their respective first wave price territories.
TECHNICAL ANALYSIS
WEEKLY CHART
Click chart to enlarge. Chart courtesy of StockCharts.com.
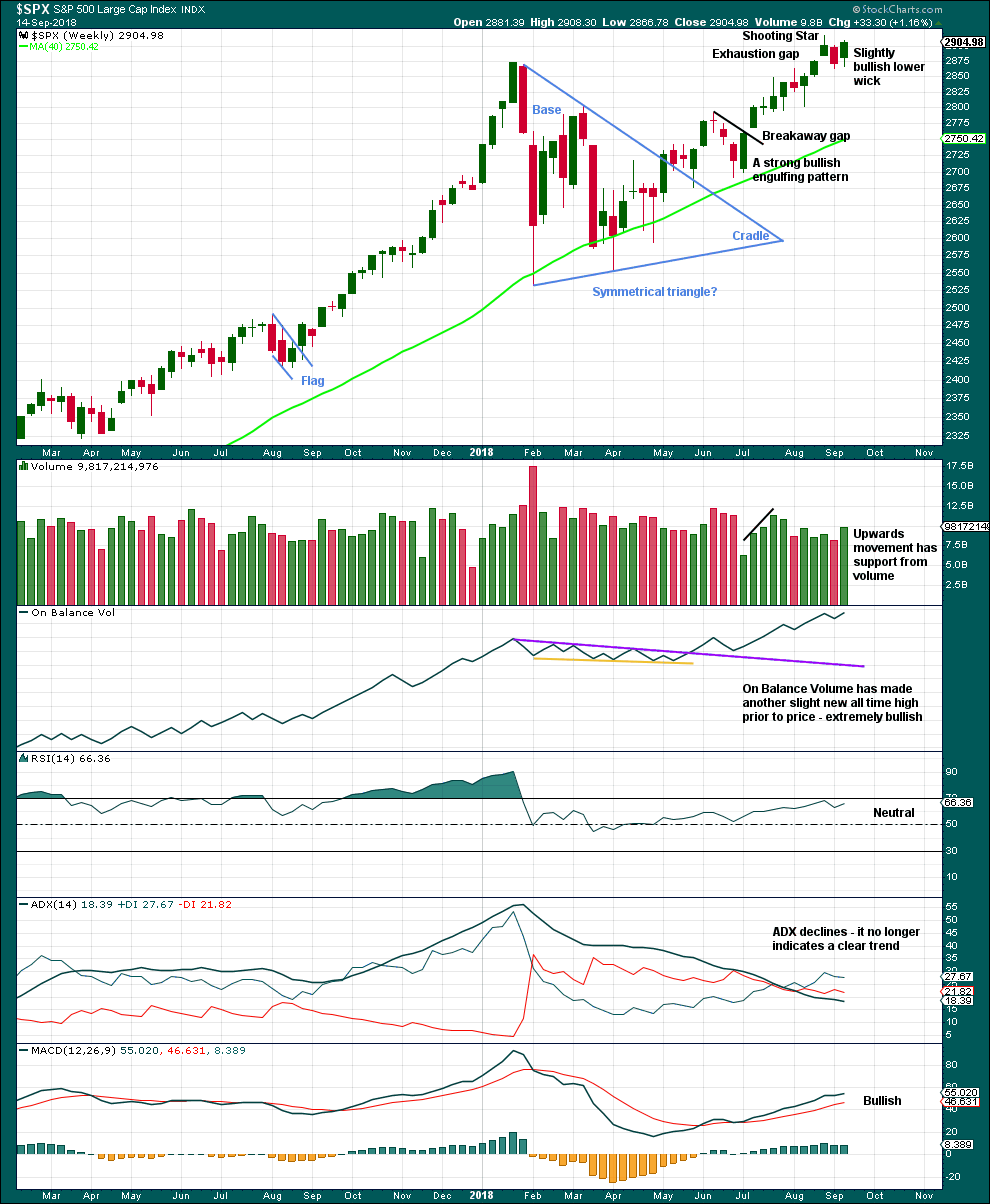
The symmetrical triangle base distance is 340.18. Added to the breakout point of 2,704.54 this gives a target at 3,044.72. This is very close to the new Elliott wave target at 3,041.
It now looks most likely that the downwards week two weeks ago is a typical backtest of support after the new all time high.
The bullish signal from On Balance Volume is given reasonable weight in this analysis. It supports the main Elliott wave count.
DAILY CHART

Click chart to enlarge. Chart courtesy of StockCharts.com.
Today saw an upwards breakout from a small consolidation, with a breakaway gap and support from volume. Some reasonable confidence may still be had that for now an upwards trend remains intact. The trend remains the same until proven otherwise.
The target calculated from the symmetrical triangle at 3,045 has still not been met. This target looks reasonable.
Use the breakaway gap to pull up stops for long positions.
VOLATILITY – INVERTED VIX CHART
WEEKLY CHART
Click chart to enlarge. Chart courtesy of StockCharts.com. So that colour blind members are included, bearish signals
will be noted with blue and bullish signals with yellow.
To keep an eye on the all time high for inverted VIX a weekly chart is required at this time.
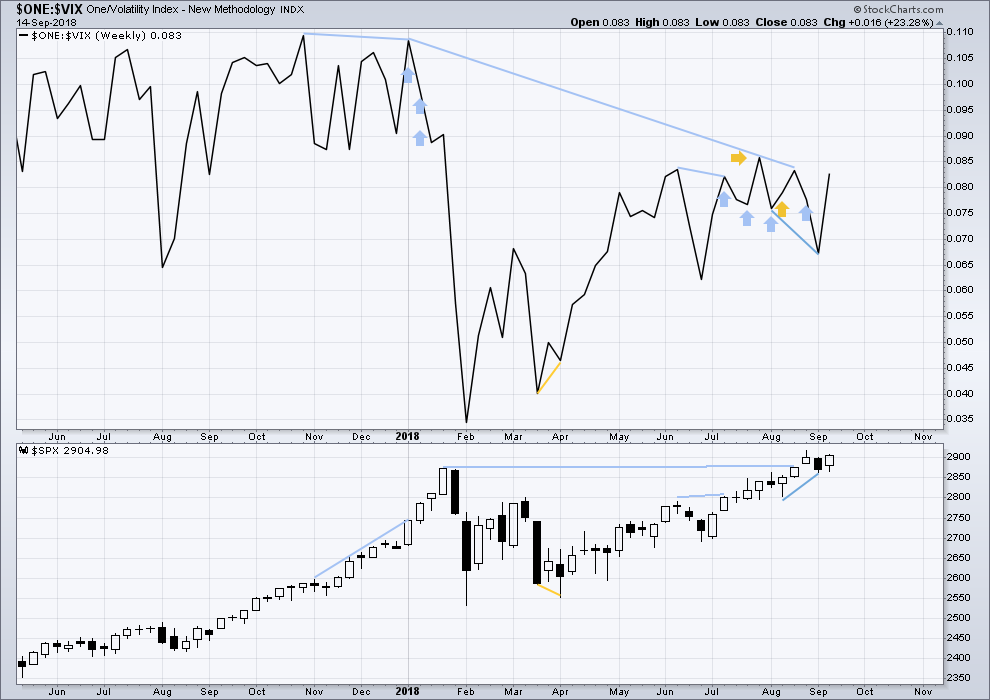
Notice how inverted VIX has very strong bearish signals four weeks in a row just before the start of the last large fall in price. At the weekly chart level, this indicator may be useful again in warning of the end of primary wave 3.
At this time, there is mid term bearish divergence between price and inverted VIX: price has made a new all time high, but inverted VIX has not. This divergence may persist for some time. It may remain at the end of primary wave 3, and may develop further to the end of primary wave 5.
Strong bearish divergence noted two weeks ago has now been followed by an upwards week. It is considered to have failed.
Upwards movement in price has support last week from a normal corresponding decline in market volatility. There is no new divergence.
DAILY CHART

Click chart to enlarge. Chart courtesy of StockCharts.com. So that colour blind members are included, bearish signals
will be noted with blue and bullish signals with yellow.
Normally, volatility should decline as price moves higher and increase as price moves lower. This means that normally inverted VIX should move in the same direction as price.
There is mid term divergence with a new all time high from price not supported by a corresponding new all time high from inverted VIX. This divergence is bearish.
Price moved fairly strongly higher today, but inverted VIX moved slightly lower. This single day divergence is bearish. This bearish divergence may be seen for more than one day, or even more than one week, prior to the end of primary wave 3. It may be an early warning sign and may not necessarily be taken as a signal that primary wave 3 must end here.
BREADTH – AD LINE
WEEKLY CHART
Click chart to enlarge. Chart courtesy of StockCharts.com.
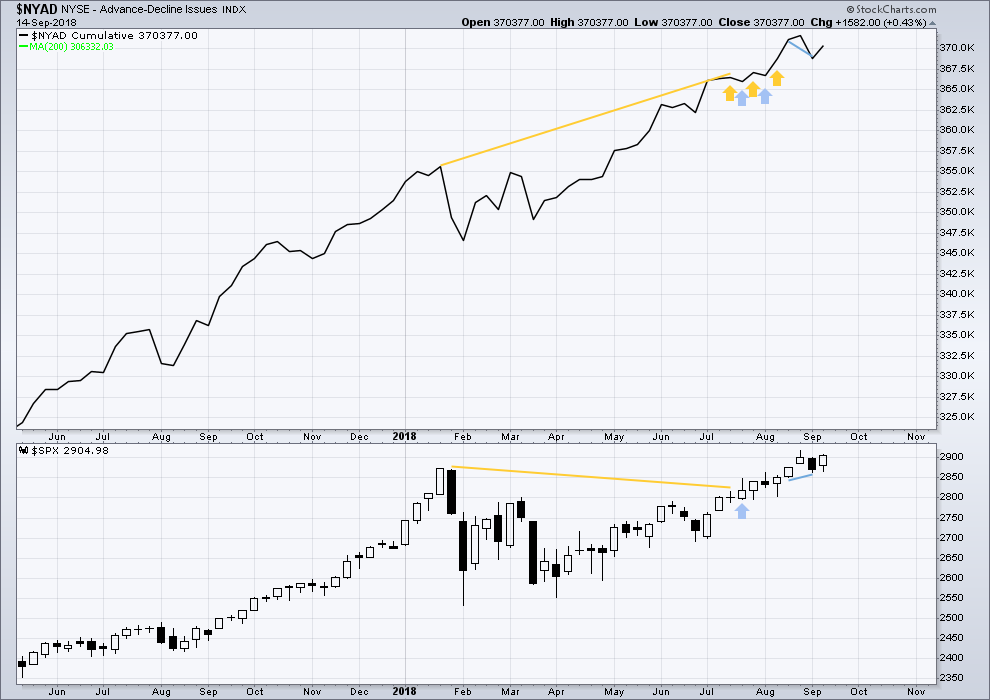
When primary wave 3 comes to an end, it may be valuable to watch the AD line at the weekly time frame as well as the daily.
Short term weak divergence between price and the AD line noted last week has now been followed by an upwards week. It is considered to have failed.
There is no new divergence this week between price and the AD line.
DAILY CHART

Click chart to enlarge. Chart courtesy of StockCharts.com.
There is normally 4-6 months divergence between price and market breadth prior to a full fledged bear market. This has been so for all major bear markets within the last 90 odd years. With no longer term divergence yet at this point, any decline in price should be expected to be a pullback within an ongoing bull market and not necessarily the start of a bear market. New all time highs from the AD line means that any bear market may be an absolute minimum of 4 months away. It may of course be a lot longer than that. My next expectation for the end of this bull market may now be October 2019.
Breadth should be read as a leading indicator.
Rising price has support from rising market breadth, but breadth is not rising as fast as price. This is a little bearish. Some divergence towards the end of primary wave 3 may be expected to develop; this bearishness may fit the main Elliott wave count.
Upwards movement today from price has support from rising market breadth. This is bullish.
But the new all time high for price is not matched by a new all time high from the AD line, so there is now short / mid term bearish divergence. It would be reasonable to expect to see some divergence develop towards the end of primary wave 3.
This divergence may be taken as an early warning sign that primary wave 3 is nearing its end, but it may not necessarily be taken as a signal that primary wave 3 must end here.
All of small, mid and large caps made new all time highs on the 27th of August. There is a little divergence here in breadth with large caps continuing to make new all time today and small and mid caps lagging.
DOW THEORY
The following lows need to be exceeded for Dow Theory to confirm the end of the bull market and a change to a bear market:
DJIA: 23,360.29.
DJT: 9,806.79.
S&P500: 2,532.69.
Nasdaq: 6,630.67.
Nasdaq and DJT and now the S&P500 have all made recent new all time highs. For Dow Theory confirmation of the ongoing bull market, DJIA needs to make a new all time high.
DJT made another new all time high last week. It may be leading the market.
Charts showing each prior major swing low used for Dow Theory may be seen at the end of this analysis here.
ANALYSIS OF THE END OF INTERMEDIATE WAVE (3)
TECHNICAL ANALYSIS
Click chart to enlarge. Chart courtesy of StockCharts.com.
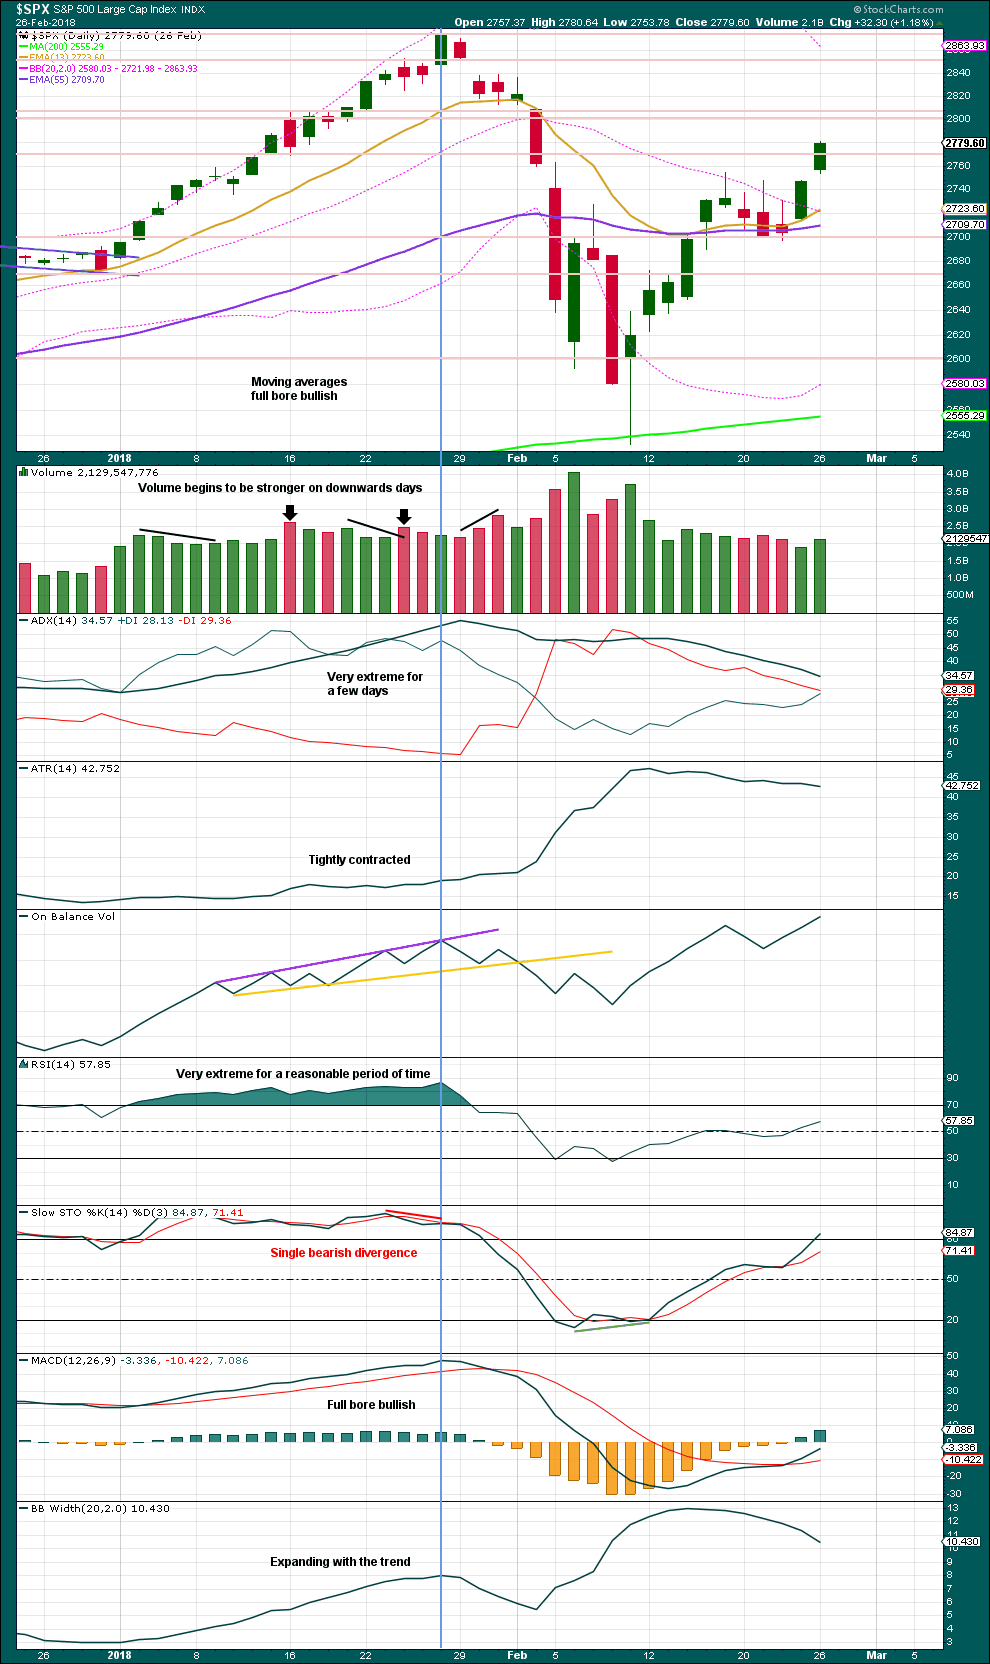
This chart looked overly bullish at the end of intermediate wave (3). The only warning in hindsight may have been from volume spiking slightly on downwards days. There was no bearish divergence between price and either of RSI or On Balance Volume.
Single bearish divergence between price and Stochastics was weak, which is often an unreliable signal.
VIX
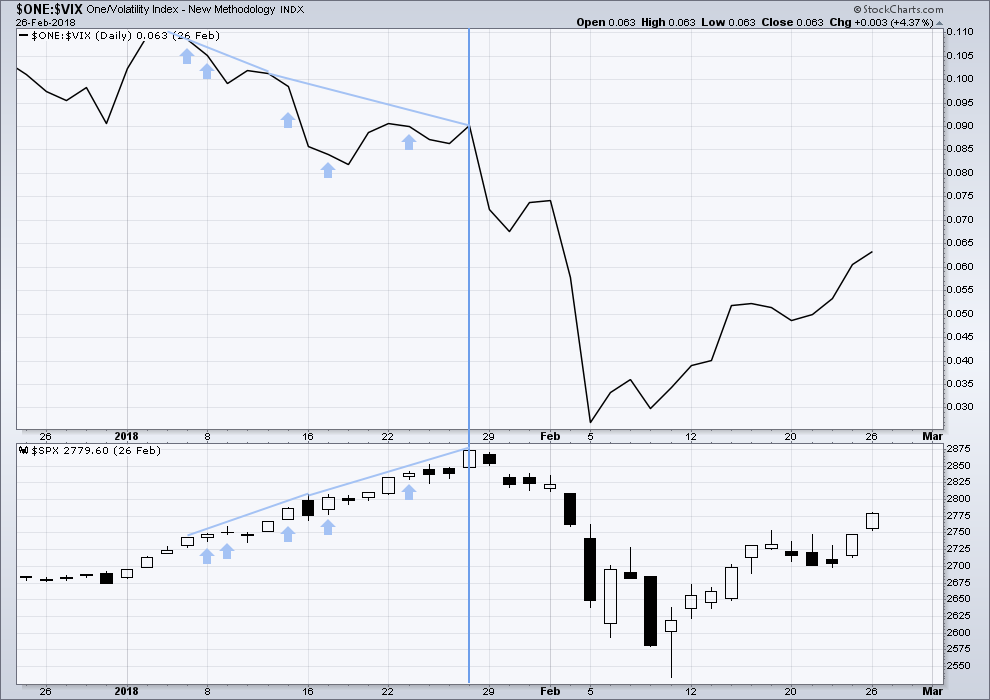
Click chart to enlarge. Chart courtesy of StockCharts.com.
This is a daily chart.
The strongest warning of an approaching intermediate degree correction at the daily chart level came from inverted VIX.
There was strong double bearish divergence at the high of intermediate wave (3), which is noted by the vertical line. There was also a sequence of five days of bearish divergence, days in which price moved higher but inverted VIX moved lower.
AD LINE
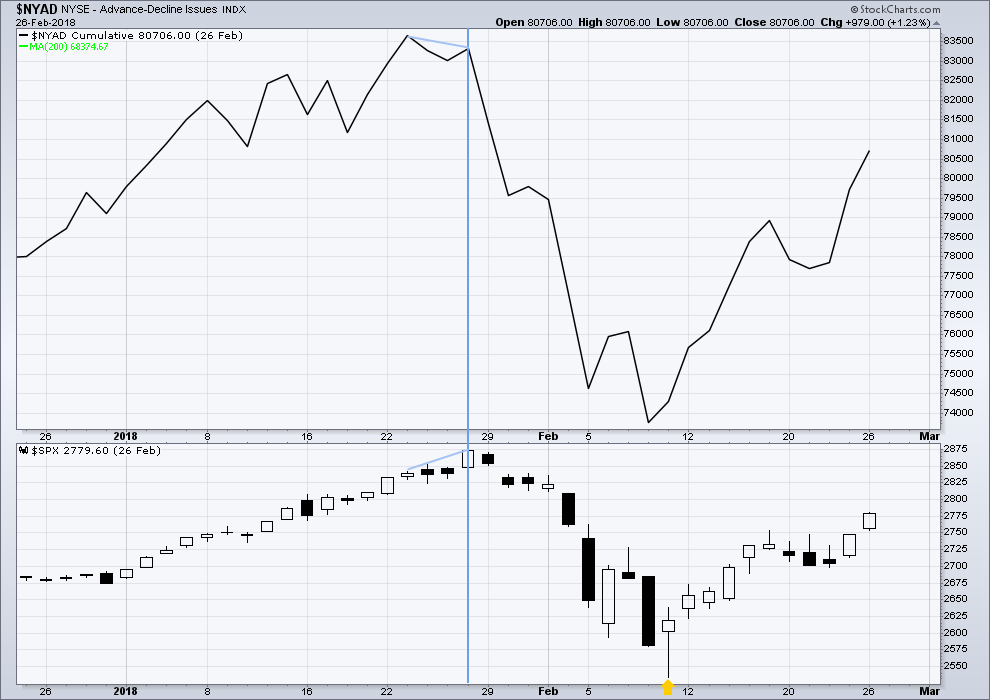
Click chart to enlarge. Chart courtesy of StockCharts.com.
This is a daily chart.
There was only single bearish divergence between price and the AD line at the end of intermediate wave (3). Approaching the high, there were no instances of price moving higher and the AD line moving lower.
Conclusion: When studying the behaviour of price and these indicators just before the start of intermediate wave (4), we may see some clues for warning us of primary wave 4. A cluster of bearish signals from VIX along with a bearish divergence from price and the AD line or On Balance Volume may warn of primary wave 4. The next instance will probably not behave the same as the last, but there may be similarities.
At this time, it does not look like primary wave 4 may begin right now, but we need to be aware of its approach.
Published @ 10:21 p.m. EST.
—
Careful risk management protects your trading account(s).
Follow my two Golden Rules:
1. Always trade with stops.
2. Risk only 1-5% of equity on any one trade.


We bought a good-sized lot of DIA October expiration 270 strike puts today for 2.65.
Our reasoning is that the index continuing to trade several hundred points beyond the upper 2 STD B band is unsustainable. The extremity of the condition is not only unsustainable, we expect a reversion not only TO the mean but THROUGH it.
We especially like these kinds of extreme market conditions that offer higher than usual reward/risk ratios and allow trading bigger lots that one normally would.
Have a great week-end everyone!
Daily shows dark cloud cover for RUT and a bearish engulfing candle in NDX.
More indications of bad weather fast approaching I believe.
Here’s a daily chart of my equally balanced FAANG stocks ticker. You know, the ones commonly cited as “holding the market up”. Well…it’s looking dangerously toppy to me.
Apple had its largest volume today in the last 12 months… amd it’s down
Updated hourly chart:
this looks like subminuette wave iv.
subminuette wave ii looks like a very shallow 0.29 flat, and now subminuette wave iv looks like a slightly deeper (so far) zigzag. subminuette wave iv could go a little deeper, there is as yet no indication of a trend change with any kind of candlestick reversal pattern on the five minute chart.
today’s gap looks like an exhaustion gap
I would still expect the last breakaway gap to remain open and provide support. today looks like a very typical curve down and back to test support at prior resistance, before price moves up and away.
RUT is stuck on the daily tf underneath a 61.8% fibo, and it’s interesting because it got stuck under it before it “defined” it. It got stuck under that level, then went down and formed a low that put that level at 61.8%…the more you get into the fractal structure of the market the more amazing it seems to me.
Meanwhile, it would be Significant if RUT can break above that (above 1726).
Btw, your numbers are showing up much better in your charts. Thanks 🙂
Hi kevin
What’s interesting about the RUT is:
It hit the trend line of this 2009 cycle about a couple weeks ago.
During that time it also met another trend line formed in the previous 2002 – 2007 boom.
Further more it met a really long trend line from the 1990’s.
look monthly logarithmic scale.
3 major trendiness and long term ones at that.
It will have a hard time breaking all 3 of those.
Please Advise
Thank You
Sounds like you advised me , Eric. I’m not going to disagree with ya there! There are lots of signs gathering that the major top is near, or perhaps in some markets has already been put in place. We’ll see!
SPX now executing subminuette iv of the minuette iii of the minute v of the minor 5 of the intermediate 5 of the primary 3?
sure looks like it
amazing how those 1.27% extensions usually create substantial resistance.
Correct me if I’m wrong, but I believe that should be minute iii, not minute v, unless your count is different than Lara’s and you believe P4 is imminent (arriving this afternoon or Monday).
you caught me speedin’ Bo….
In my pole slot.
Where is everyone?
Second
Chillin’ Doc!