
A little downwards movement was expected to 2,653. The low for the session was 2,648.
Summary: The target for this pullback to end tomorrow is 2,637 – 2,635. Thereafter, expect upwards movement to begin to show some increase in momentum. This downwards movement is expected to be a counter trend movement, and at its end it may offer another entry opportunity to enter long positions prior to an upwards breakout.
Always practice good risk management. Always trade with stops and invest only 1-5% of equity on any one trade.
New updates to this analysis are in bold.
The biggest picture, Grand Super Cycle analysis, is here.
Last historic analysis with monthly charts is here. Video is here.
An alternate idea at the monthly chart level is given here at the end of this analysis.
An historic example of a cycle degree fifth wave is given at the end of the analysis here.
MAIN ELLIOTT WAVE COUNT
WEEKLY CHART
Click chart to enlarge.
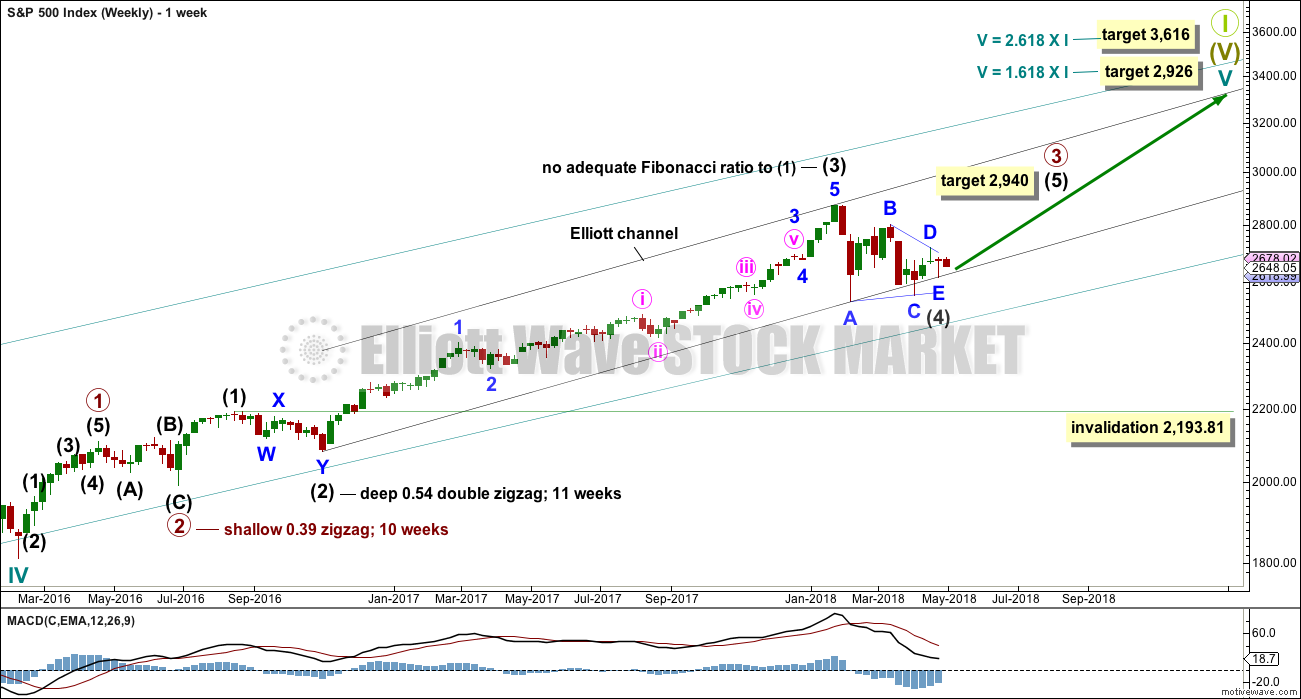
Cycle wave V must complete as a five structure, which should look clear at the weekly chart level. It may only be an impulse or ending diagonal. At this stage, it is clear it is an impulse.
Within cycle wave V, the third waves at all degrees may only subdivide as impulses.
Intermediate wave (4) has breached an Elliott channel drawn using Elliott’s first technique. The channel is redrawn using Elliott’s second technique: the first trend line from the ends of intermediate waves (2) to (4), then a parallel copy on the end of intermediate wave (3). Intermediate wave (5) may end either midway within the channel, or about the upper edge.
At least three wave counts remain valid at the daily chart level. It is possible still that a low may not be in place; intermediate wave (4) could still continue further. Intermediate wave (4) may not move into intermediate wave (1) price territory below 2,193.81. However, it would be extremely likely to remain within the wider teal channel (copied over from the monthly chart) if it were to be reasonably deep. This channel contains the entire bull market since the low in March 2009, with only two small overshoots at the end of cycle wave IV. If this channel is breached, then the idea of cycle wave V continuing higher would be discarded well before the invalidation point is breached.
If intermediate wave (4) ends anytime within this week, then it would total a Fibonacci 13 weeks. It would have excellent proportion with intermediate wave (2), and there would be perfect alternation if it is over as a shallow triangle.
At this stage, there are still three possible structures for intermediate wave (4): a triangle, a combination, and a flat correction. All three will be published. The triangle is preferred because that would see price continue to find support about the 200 day moving average. While this average continues to provide support, it is reasonable to expect it to continue (until it is clearly breached).
DAILY CHART
Click chart to enlarge.
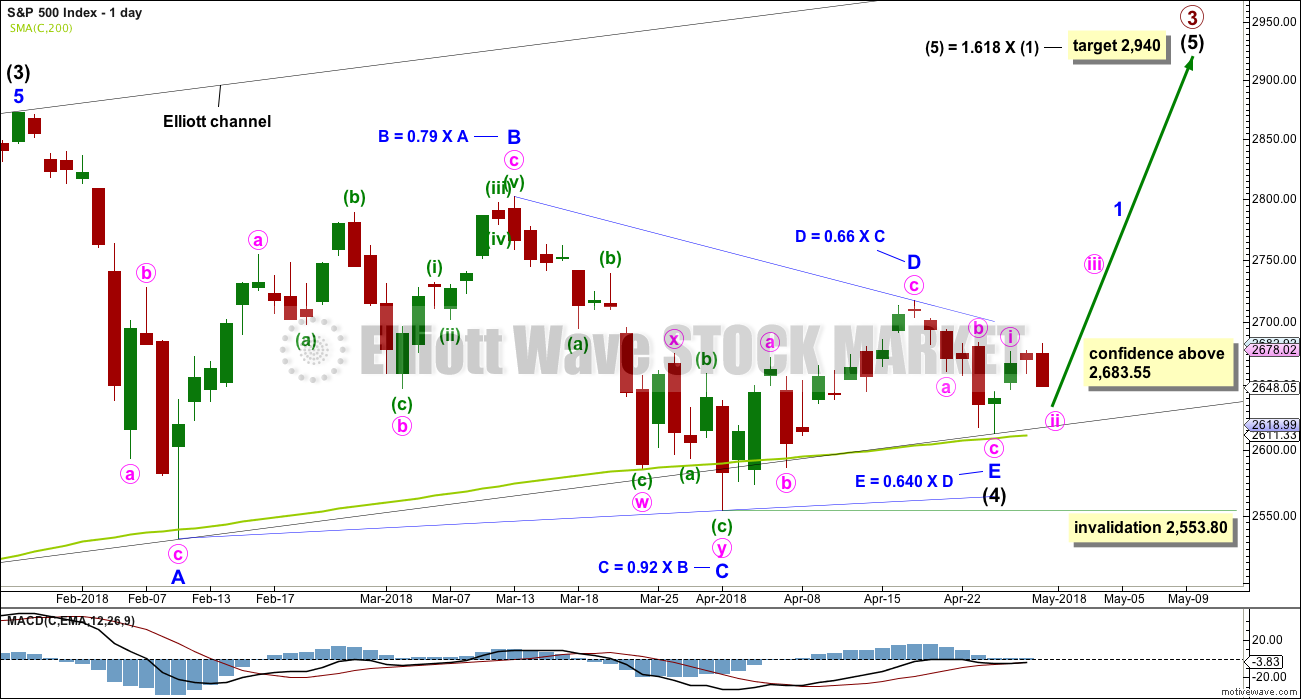
It is possible that intermediate wave (4) is a complete regular contracting triangle, the most common type of triangle. Minor wave E may have found support just above the 200 day moving average and ending reasonably short of the A-C trend line. This is the most common look for E waves of triangles.
Intermediate wave (3) exhibits no Fibonacci ratio to intermediate wave (1). It is more likely then that intermediate wave (5) may exhibit a Fibonacci ratio to either of intermediate waves (1) or (3). The most common Fibonacci ratio would be equality in length with intermediate wave (1), but in this instance that would expect a truncation. The next common Fibonacci ratio is used to calculate a target for intermediate wave (5) to end.
It must still be accepted that the risk with this wave count is that a low may not yet be in place; intermediate wave (4) could continue lower. For this triangle wave count, minor wave E may not move beyond the end of minor wave C below 2,553.80.
HOURLY CHART
Click chart to enlarge.
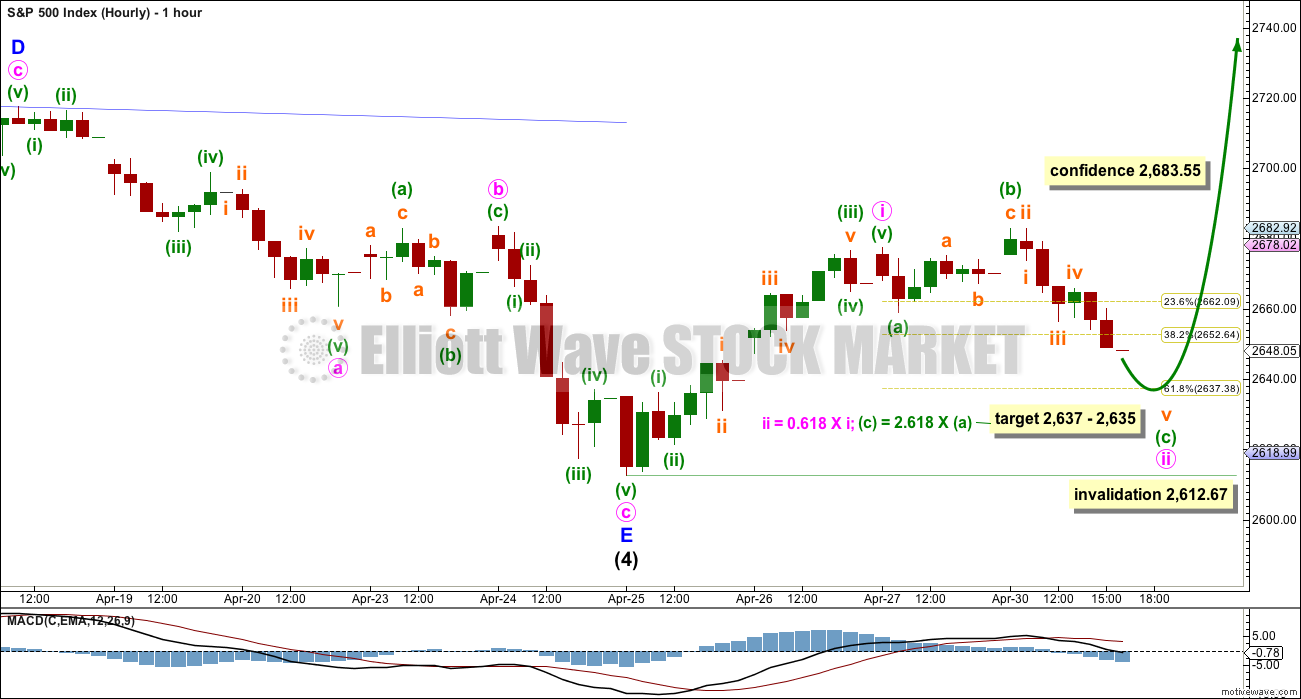
A new high above 2,683.55 would add further confidence that a low may be in place. This point is the start of minute wave c within minor wave E. A new high above the start of minute wave c could not be a second wave correction within minute wave c, so at that stage minute wave c would have to be over.
Intermediate wave (5) must subdivide as a five wave structure. At the hourly chart level, the structure should begin to unfold with a five up. The degree of labelling within upwards movement is moved down one degree today. Minor wave 1 may be incomplete and subdividing as an impulse.
Within the impulse of minor wave 1, minute wave i may be complete. Minute wave ii may move lower tomorrow (a target is calculated at two degrees), and it may not move beyond the start of minute wave i below 2,612.67.
When minute wave ii may be complete, then an increase in upwards momentum for minute wave iii may be expected. This may provide an upwards breakout out of the triangle trend lines.
When the impulse of minor wave 1 is complete, then minor wave 2 may not move beyond its start below 2,612.67. Minor wave 1 should be long enough to break above the upper B-D trend line of the triangle. Minor wave 2 may then pullback to test support there, at prior resistance.
ALTERNATE WAVE COUNTS
DAILY CHART – COMBINATION
Click chart to enlarge.
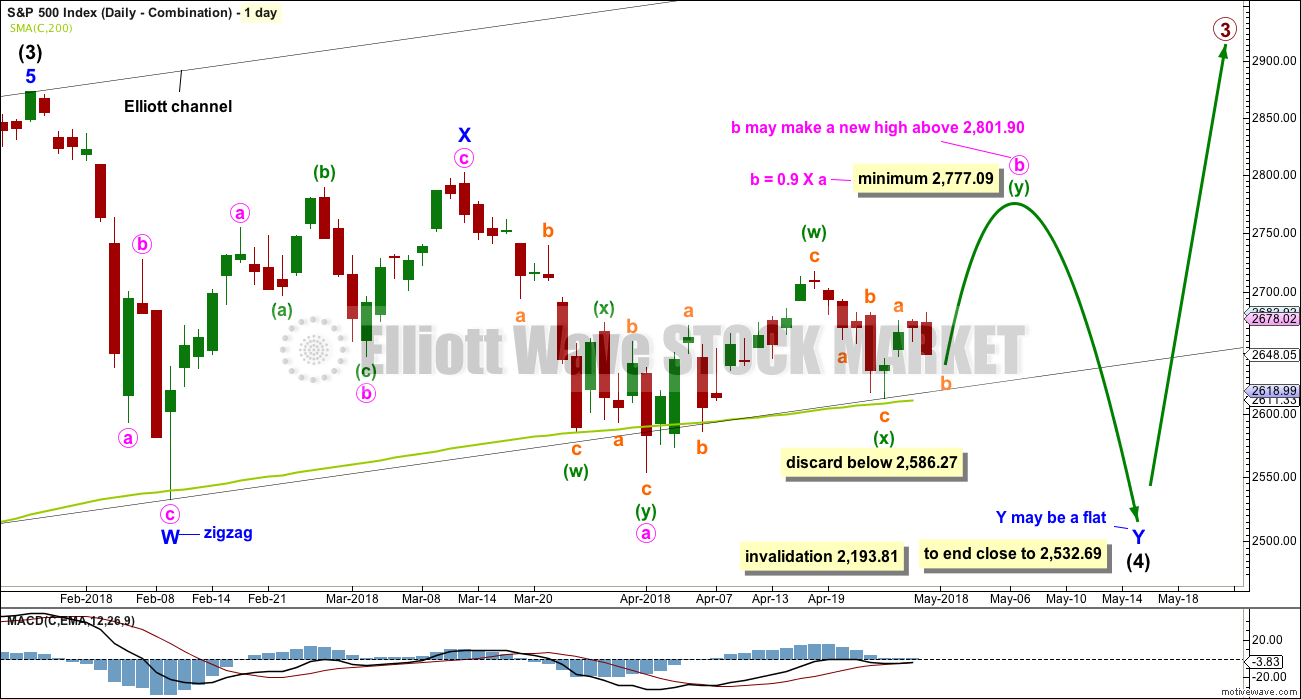
I have charted a triangle a great many times over the years, sometimes even to completion, only to see the structure subsequently invalidated by price. When that has happened, the correction has turned out to be something else, usually a combination. Therefore, it is important to always consider an alternate when a triangle may be unfolding or complete.
Double combinations are very common structures. The first structure in a possible double combination for intermediate wave (4) would be a complete zigzag labelled minor wave W. The double should be joined by a three in the opposite direction labelled minor wave X, which may be a complete zigzag. X waves within combinations are typically very deep; if minor wave X is over at the last high, then it would be a 0.79 length of minor wave W, which is fairly deep giving it a normal look. There is no minimum nor maximum requirement for X waves within combinations.
The second structure in the double would most likely be a flat correction labelled minor wave Y. It may also be a triangle, but at this stage the expected direction for that idea does not differ now from the main wave count.
A flat correction would subdivide 3-3-5. Minute wave a must be a three wave structure, most likely a zigzag. It may also be a double zigzag.
Minute wave b must now reach a minimum 0.90 length of minute wave a. Minute wave b may be unfolding as a double zigzag. Within a double zigzag, the second zigzag exists to deepen the correction when the first zigzag did not move price deep enough. Double zigzags normally have a strong slope like single zigzags. To achieve a strong slope the X wave within a double zigzag is normally brief and shallow, most importantly shallow (it rarely moves beyond the start of the first zigzag). A new low now below 2,586.27 should see the idea of a double zigzag for minute wave b discarded.
The purpose of combinations is to take up time and move price sideways. To achieve this purpose the second structure in the double usually ends close to the same level as the first. Minor wave Y would be expected to end about the same level as minor wave W at 2,532.69. This would require a strong overshoot or breach of the 200 day moving average, which looks unlikely but does have precedent in this bull market.
Minute wave b may make a new high above the start of minute wave a if minor wave Y is an expanded flat. There is no maximum length for minute wave b, but there is a convention within Elliott wave that states when minute wave b is longer than twice the length of minute wave a the idea of a flat correction continuing should be discarded based upon a very low probability. That price point would be at 3,050. However, if price makes a new all time high and upwards movement exhibits strength, then this idea would be discarded at that point. Minute wave b should exhibit obvious internal weakness, not strength.
At this stage, the very bullish signal last week from the AD line making a new all time high puts substantial doubt on this wave count. It has very little support from classic technical analysis.
DAILY CHART – FLAT
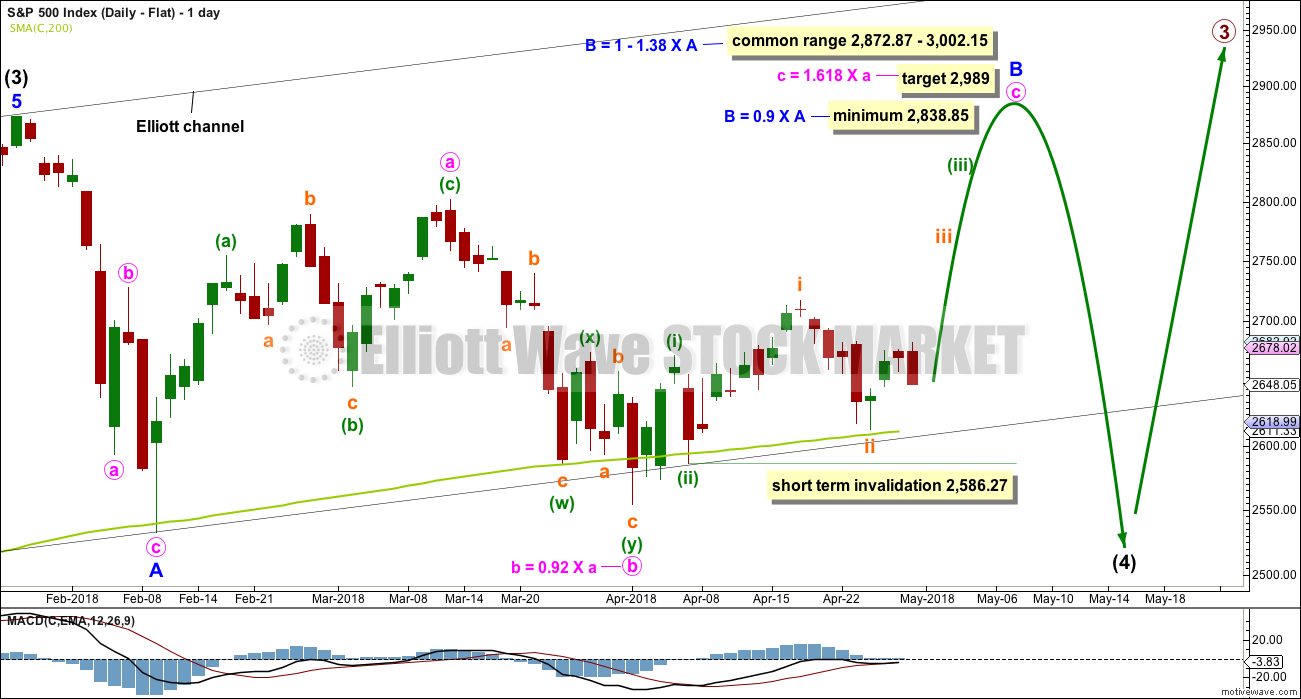
Click chart to enlarge.
Flat corrections are very common. The most common type of flat is an expanded flat. This would see minor wave B move above the start of minor wave A at 2,872.87.
Within a flat correction, minor wave B must retrace a minimum 0.9 length of minor wave A at 2,838.85. The most common length for minor wave B within a flat correction would be 1 to 1.38 times the length of minor wave A at 2,872.87 to 3,002.15. An expanded flat would see minor wave B 1.05 times the length of minor wave A or longer, at 2,889.89 or above. A target is calculated for minor wave B to end, which would see it end within the common range.
Minor wave B may be a regular flat correction, and within it minute wave a may have been a single zigzag and minute wave b may have been a double zigzag. This has a very good fit.
However, minute wave c must be a five wave structure for this wave count and now the depth and duration of subminuette wave ii looks wrong. The probability that minute wave c upwards is unfolding as an impulse is now reduced. It is possible that it could be a diagonal, but that too has a relatively low probability as the diagonal would need to be expanding to achieve the minimum price target for minor wave B, and expanding ending diagonals are not very common.
At its end minor wave B should exhibit obvious weakness. If price makes a new all time high and exhibits strength, then this wave count should be discarded.
This wave count would require a very substantial breach of the 200 day moving average for the end of intermediate wave (4). This is possible but may be less likely than a smaller breach. The bullish signal from the AD line making a new all time high puts substantial doubt on this wave count.
TECHNICAL ANALYSIS
WEEKLY CHART
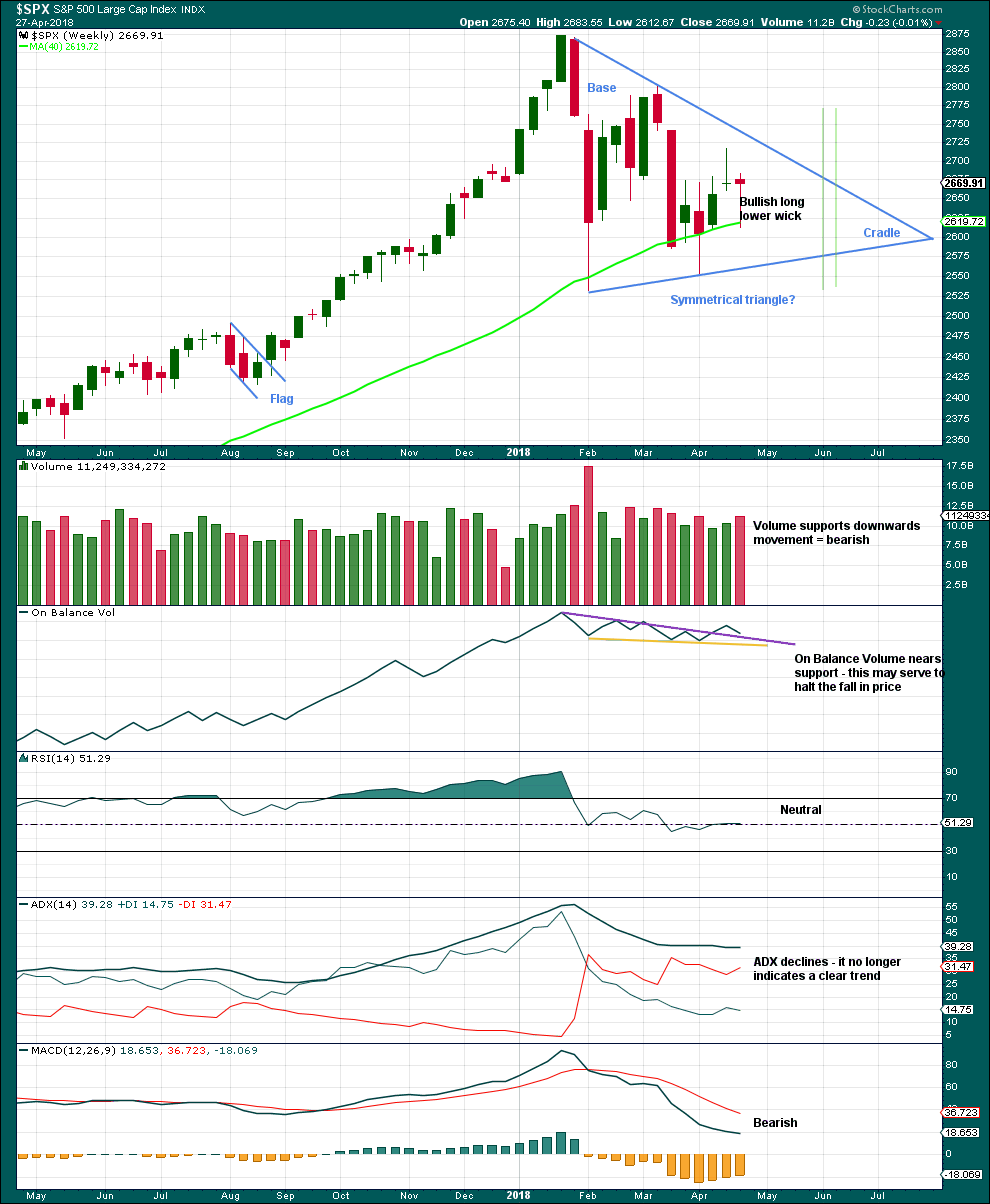
Click chart to enlarge. Chart courtesy of StockCharts.com.
A classic symmetrical triangle pattern may be forming. These are different to Elliott wave triangles. Symmetrical triangles may be either continuation or reversal patterns, while Elliott wave triangles are always continuation patterns and have stricter rules.
The vertical green lines are 73% to 75% of the length of the triangle from cradle to base, where a breakout most commonly occurs.
From Dhalquist and Kirkpatrick on trading triangles:
“The ideal situation for trading triangles is a definite breakout, a high trading range within the triangle, an upward-sloping volume trend during the formation of the triangle, and especially a gap on the breakout.”
For this example, the breakout has not yet happened. There is a high trading range within the triangle, but volume is declining.
The triangle may yet have another 6 – 7 weeks if it breaks out at the green lines.
A bullish long lower wick and support here or very close by for On Balance Volume suggest the pullback last week may be over, despite volume increasing. Looking inside the week at daily volume gives a clearer picture of where greatest support was.
DAILY CHART
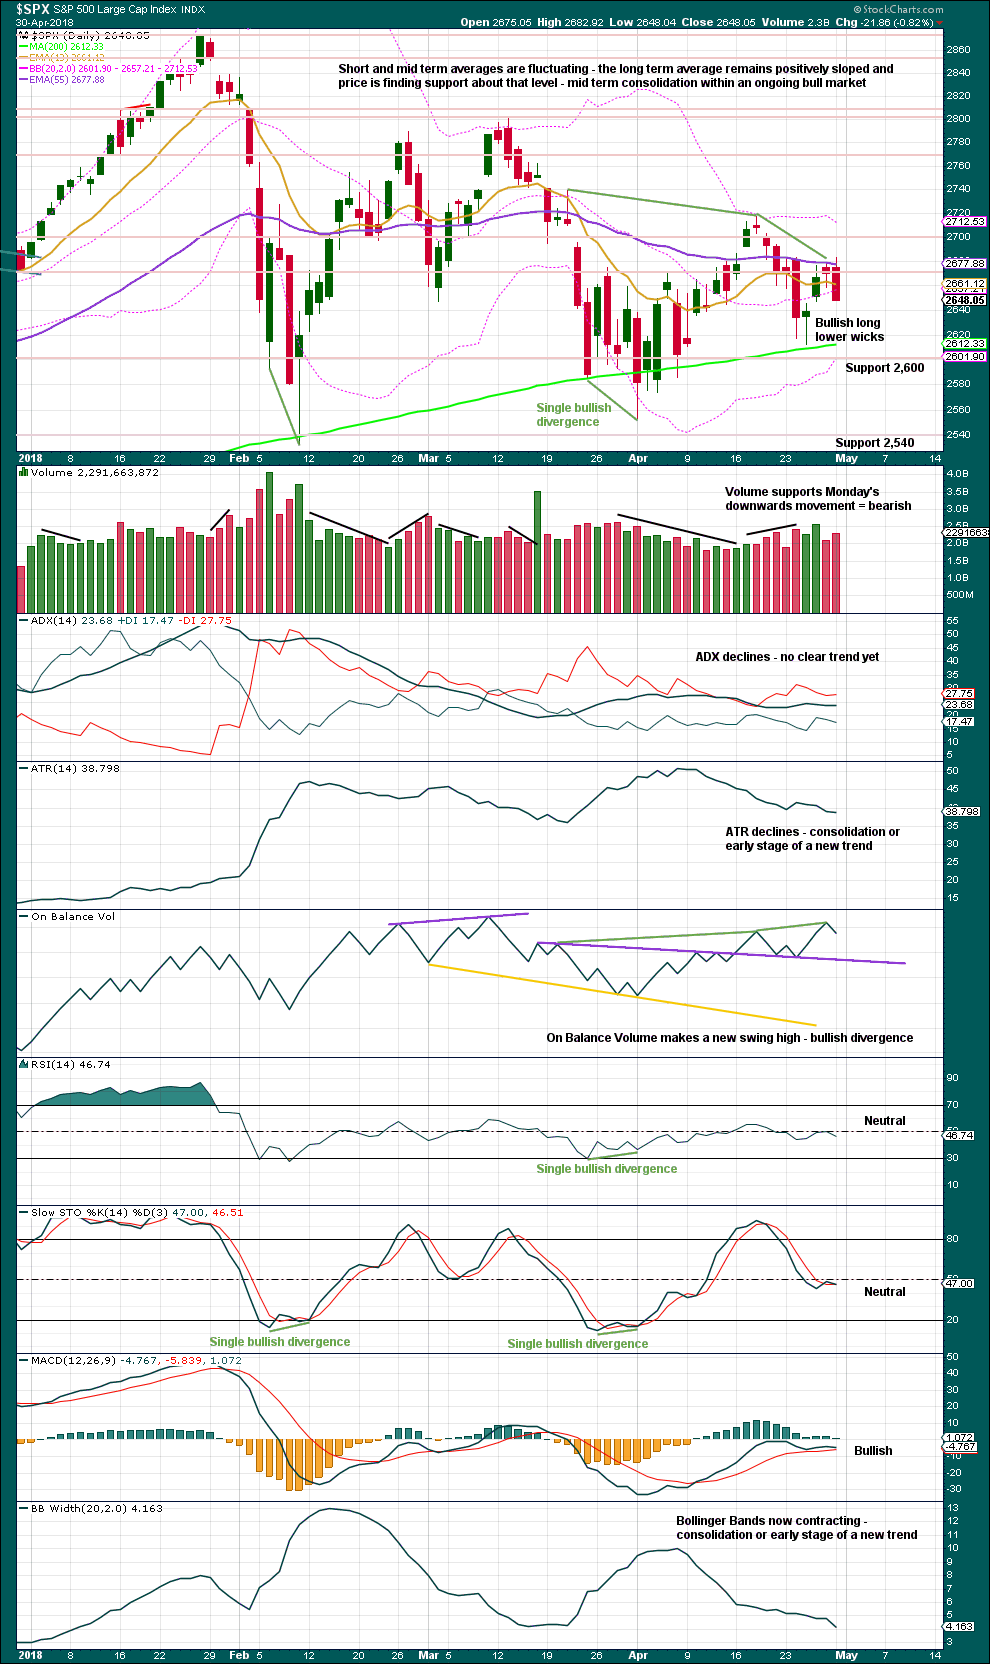
Click chart to enlarge. Chart courtesy of StockCharts.com.
A strong downwards day closing almost at the low is bearish; expect downwards movement tomorrow.
The last gap is still open (its low is at 2,645.30). If this is a pattern gap, then it is likely to be closed. With price still below resistance and above support, it should be read as a pattern gap.
Support from volume today also suggests another downwards day tomorrow.
VOLATILITY – INVERTED VIX CHART
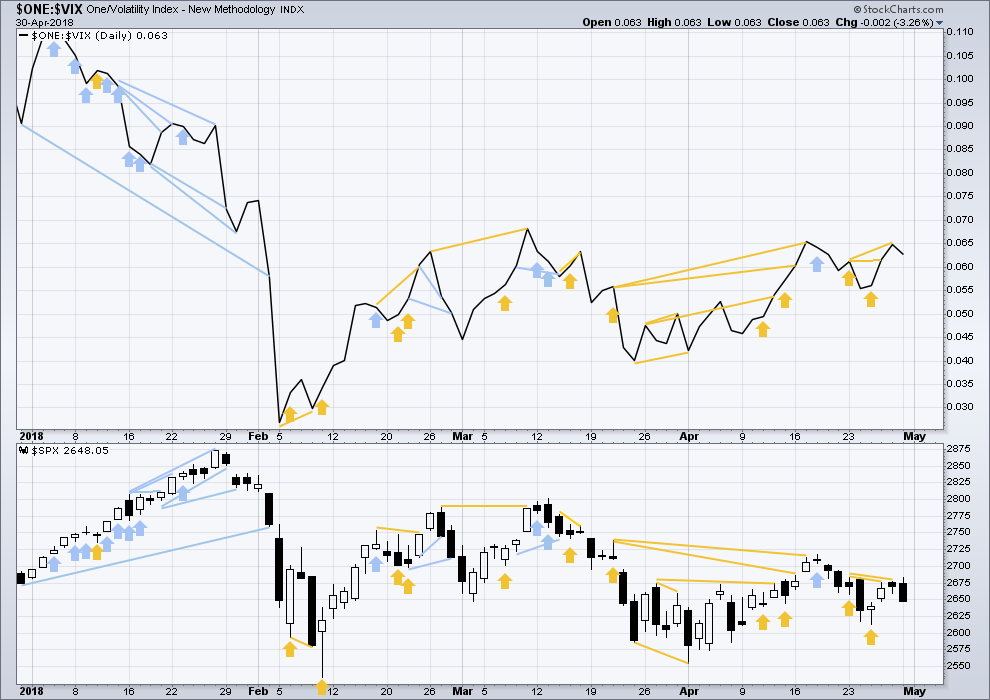
Click chart to enlarge. Chart courtesy of StockCharts.com.
So that colour blind members are included, bearish signals will be noted with blue and bullish signals with yellow.
Normally, volatility should decline as price moves higher and increase as price moves lower. This means that normally inverted VIX should move in the same direction as price.
There is still a cluster of bullish signals on inverted VIX. Overall, this may offer support to the main Elliott wave count.
Both price and inverted VIX moved lower today. There is no divergence.
BREADTH – AD LINE
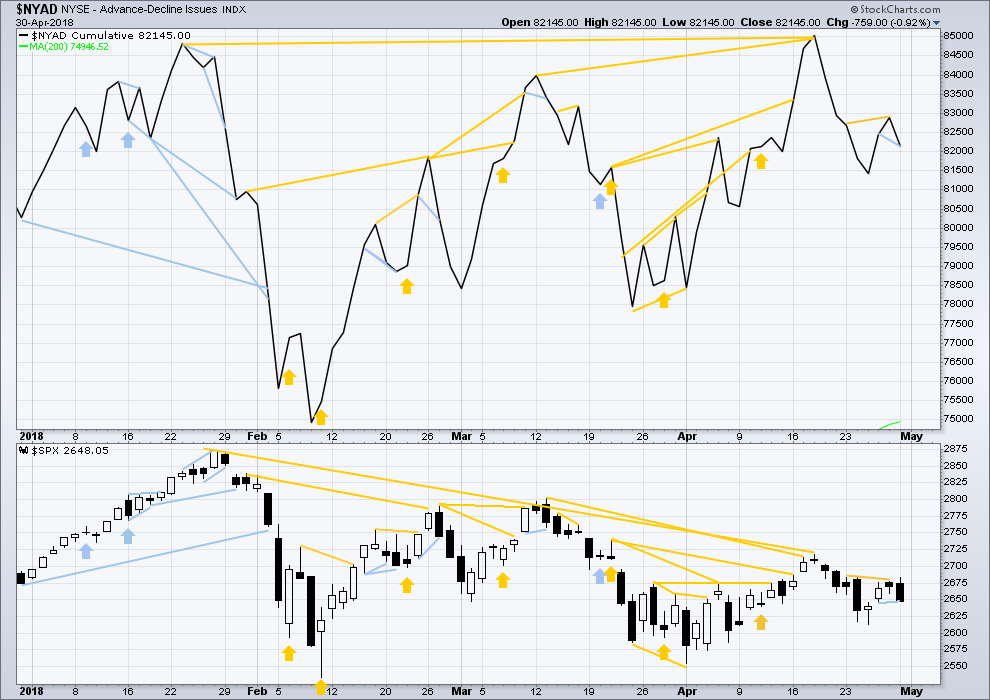
Click chart to enlarge. Chart courtesy of StockCharts.com.
There is normally 4-6 months divergence between price and market breadth prior to a full fledged bear market. This has been so for all major bear markets within the last 90 odd years. With no longer term divergence yet at this point, any decline in price should be expected to be a pullback within an ongoing bull market and not necessarily the start of a bear market. A new all time high from the AD line this week means that any bear market may now be an absolute minimum of 4 months away.
All of small, mid and large caps have made at least slight new lows below their prior swing lows of the 13th of April. This pullback has support from falling market breadth.
Breadth should be read as a leading indicator.
The new all time high from the AD line remains very strongly bullish and supports the main Elliott wave count.This new all time high from the AD line will be given much weight in this analysis. This is the piece of technical evidence on which I am relying most heavily in expecting a low may be in place here or very soon.
There has been a cluster of bullish signals from the AD line in the last few weeks. This also overall offers good support to the main Elliott wave count.
Both price and the AD line moved lower today. The AD line has made a new low below the prior low of the 26th of April, but price has not. This divergence is bearish.
DOW THEORY
The following lows need to be exceeded for Dow Theory to confirm the end of the bull market and a change to a bear market:
DJIA: 23,360.29.
DJT: 9,806.79.
S&P500: 2,532.69.
Nasdaq: 6,630.67.
At this stage, only DJIA has made a new major swing low. DJT also needs to make a new major swing low for Dow Theory to indicate a switch from a bull market to a bear market. For an extended Dow Theory, which includes the S&P500 and Nasdaq, these two markets also need to make new major swing lows.
Charts showing each prior major swing low used for Dow Theory may be seen at the end of this analysis here.
Published @ 09:44 p.m. EST.
Thanks for the analysis and all the great commentary today and everyday. Have some nice position opened and stops in place. Hope we all get to ride a long wave up
Have a great evening
Did anyone notice the gap to the upside a few minutes ago from 2650 to 2651.5 or so? I think it is a sign of power / momentum swinging to the bullish cause.
Thanks for pointing that out. I’m pretty happy with the green hammer candle on the close. Finished the day with strong upwards momentum the last 20 minutes
The gap is no longer showing on the 5 or 1 minute charts. It must have been due to a delayed pricing / charting. In any event the last 30 minutes were quite powerful. Even though 24 hour futures are down a bit. I would not be surprised by a gap up open in the morning.
All Righty Then! Coast looking clear.
Happily out of of all my short calls and holding a boatload of long calls for the expected move up. Go banksters! 🙂
Have a great evening all!
I have to say I am surprised we have not already rocketed into green territory in DJI.
Surely folk holding bearish positions have to be aware of the significance of the reclaim of the 24K pivot, or are they sleeping??!! 🙂
true.. and DJT also remains red today
while S&P is developing a nice doji
if that doji remains and tomorrow gaps higher, then completes a green candlestick, that would be a nice Morning Doji Star
updated hourly chart:
looks like another low is in folks
minute iii may have the power to break above the upper triangle trend line and out of the triangle
that confidence point no longer applies, I need to delete that
Banksters to the rescue and back above DJI 24K!
Very auspicious for the bulls! 🙂 🙂
yay! go banksters!
Hehe!
Who woulda thunk it…me rooting for the banksters!! lol! 🙂
I know, it is a bit odd…
Of course, I am assuming the recapture of the DJI 24K level will NOT be challenged…! Ooops! Will they??!!!
There she goes! The gap of this morning’s open is closed.
Sorry for the repost, but this one is important to me and my first post is way down in the historical chatter below.
Fiddling around with ThinkorSwim, looking at different types of credit/debit vertical spreads. I put together a TLT bear call spread, using May 18 as the expiration, selling the 118 TLT call, and buying the 118.5 TLT call. According to the analyze page, the max profit is +$77 (on a one lot). The max loss is +$25. Yes positive $25. It seems to be saying this trade CANNOT LOSE. Somehow I doubt this. What am I doing wrong, or misunderstanding? Because if that’s true…I’d like to buy a warehouse full!!! LoL!!!! It does go to a negative loss value when I change the buy side to 119 instead of 118.5, and of course when I set it to 118 (same as the sell side), I get a flat line at zero. TIA for any insight here.
UPDATE: I bought/sold a 5 lot, praying I’m not completely confusing myself somehow. Is this REALLY a can’t lose at expiration trade???? Because of unusual pricing? It just doesn’t seem possible…can someone take a look at this and tell me what you see? TIA!!!
If price is above 118.50 at expiration and you hold the spread until then, your risk is 50.00 per spread and for five contracts that is 250.00 maximum lost. Not sure how they are calculating 25.00
Are you figuring in the bid and ask on both sides ? buy at the ask sell at the bid – I would think the spreads would be the culprit ….
I don’t know how ToS figures in the spreads. Verne’s answer didn’t add in the CREDIT received, which comes off the max loss. That’s where it was going sideways, somehow. The credit in my initial set up showed at .77 ($77 per lot), outweighing the max $50 loss per lot! In fact I got a .20 credit, which means my max loss per lot is $30, or $150 for the set of 5. I’m good with that. How it was .77 I dunno, but perhaps I fumbled fingered something? Or maybe for a moment the relative option pricing was goofy. Geez, this is an interesting (and rather complicated) trading space! Newbies like me beware. Thanks for your help guys and gals.
Yep. it probably quoted your premium based on the ASK and not the offer. 🙂
What is the offer on the spread?
Assuming you hold through expiration and price is above both strike prices, the premium you receive for selling the spread will of course be deducted from your max loss of 50.00 per spread sold.
Now?! 🙂
Now off the low of 2625.41 up to 2642 looks much better for the bulls. The gap above needs to be closed and finish the day in the green to give some confidence Minor E and Intermediate 4 are complete. If we close in the green we will have a one day bullish reversal. If we finish in the green at the high of the day, we will also have a daily bullish hammer.
That is a lot of ‘ifs’. But it is looking much better for the bulls than an hour or so ago.
Yes indeed. Option bids saying we’re done! 🙂
10-minute chart tells me the bottom is in. A little wave 2 pullback, and it might be perfect timing to go long…
My plan too Curtis. I look my profits I was able to gather from this ride up. Now I want in for more…cheaper!!!
However…tomorrow is the FOMC minutes announcement, and the market is going to go nuts for 30 minutes with wild swings, and in the end march away…up or down. I hate thatunpredictability. I might wait…
Good heads-up, Kevin. Thank you!
I’d like to make a T shirt that says: “I like green candles with long lower wicks…”
On the back: “Only when I’m bullish!”
🙂
I think I am going to end up with several T-shirts. I wonder if Lara will allow promotion and sales on the forum of my new line of Elliott shirts.
LOL
okay, I’m now seriously considering doing T-shirts. yes.
when I get to that task, I’ll ask for ideas here.
I like “green candlesticks with long lower wicks” too, very much
if you want to get in and do some first Rodney, then yes, promote away in comments.
VIX continues to fly bull flags in the march higher…still no sign we’re done….
If we get a reversal today it looks like it is not going to happen till just before the session ends…nice bear trap? 🙂
Kevin, your 2593 looks like reality…..
Possibly a reality
I think the Dow will hold the key here.
I could be wrong but if the dow breaks a new low i really think the SPX will break out of the the triangle on the low side.
I don’t think today we will get our answer but maybe soon.
We are already half way through the earnings season and the market is going
down on that news.
After earnings season there might not be to much catalyst to drive this market up.
From a long term chart if we don’t turn around in May to the upside that will be a big negative.
I hope I’m wrong and the market goes up.
Im more concerned when the market crashes we will have no ammo this time to bail our country out.
I think we will have much bigger worries then a crumbling stock market.
While it wasn’t a perfect hit, the market has turned around the 78.6% retrace (close enough for trading work!). With a solid bounce (which has cut my losses for the day in half, thankfully). Now we’ll see if we get some bullish continuing action or drop back into the swamp. I think “it’s over”….but Rodney’s early morning point stay valid: it’s not over until the gap is filled!
Yikes! Looking pretty bearish. We certainly DO NOT yet have a bottom as I surmised. The problem now is another wave down is going to more than likely break below the 200 day. Reloading short trades via DIA 239 strike puts.
A 21 period squeeze is on at the 5 minute level in SPX. Price is going to go…somewhere!!! Sadly, the historical evidence today so far says “down”. The selling pressure in the tap doesn’t seem to be exhausted…
Not only is it not exhausted, it now appears as if the bears have been toying with the bulls. I think we are going to take out the 200 day….
Okay a question from an options newbie. Fiddling around with ThinkorSwim, looking at different types of credit/debit vertical spreads. I put together a TLT bear call spread, using May 18 as the expiration, selling the 118 TLT call, and buying the 118.5 TLT call. According to the analyze page, the max profit is +$77 (on a one lot). The max loss is +$25. Yes positive $25. It seems to be saying this trade CANNOT LOSE. Somehow I doubt this. What am I doing wrong, or misunderstanding? Because if that’s true…I’d like to buy a warehouse full!!! LoL!!!! It does go to a negative loss value when I change the buy side to 119 instead of 118.5, and of course when I set it to 118 (same as the sell side), I get a flat line at zero. TIA for any insight here.
Hi everyone
If the the Dow Jones can’t hold these levels we go down pretty hard i don’t think we will have a Triple Bottom usually that doesn’t occur.
Next stop 21500 – 22400
Thats if we make it down near the 23500 level.
Please share
Thank You
Decided to put out a little money with limited risk to capitalize on the main elliott wave count longer term. Put on a call ratio backspread on SPY, expiry in August, sold 262 spy calls and bought 2x the number of 264 spy calls. Unlimited potential gain, limited risk. I picked August because timing wise it looks like that’s around the period the market might be getting back to the ATH, my general target for this trade. If someone has constructive criticism of this trade (aside from “the market is going go down not up”) I’d like to hear it because I’m a spread trading newbie. I pulled this trade out of the 42 page option trading manual on that other elliott wave sight (free access), and it described this structure as “aggressive” and for trading the early start of perceived 3 and 5 waves. So I went with it.
Looks good Kevin. A logical structure for a bullish outlook and the two point spread does not strike me as being that aggressive. I think you are good to go so long as we don’t violate the 200 day. 🙂
Hi Kevin that Call method doesn’t sound to bad.
So if the market crashes you would break even on the trade.
If the market goes up hard from here you will do well.
Do i understanding that correctly?
Thank You
No, there’s a maximum loss figure on the trade if the market tanks. And if it only goes up a bit and I hold to expiration, I lose a bit more than that (but it’s also go a maximum). It has unlimited profit potential on the upside. Set it up on an options analyzer and take a look at the profit/loss curve.
ES moving past top of wick. There you have it people. As long as today’s low holds, time to head higher.
Have fun and see ya later! 🙂
ps. VIX not confirming yet but should shortly with closure of that gap higher on 5 minute chart.
Two interesting candles in ES. One with a long shadow, one with a long wick. Uncertainty until low or high exceeded…..
Long shadow in ES. Let’s see if it sticks. We could be done….
We should get a strong move down to the 200 day and I expect it will hold.
That will be the trigger for long trades. I will be oh so wrong if we slice through it… 🙂
VIX looking MOST interesting…!!!
If we do not reclaim DJI 24K by session’s end, long trades held overnight imho face extreme risk…..
This next wave down needs to find a bottom. If it does not, we are going to see some serious droopage…
My model for the severe bear case. Weekly chart showing the down channel established on the upper trend line side. To “complete” it…well, the arrow shows the path. Note that “indicator 1” here is breaking the current up channel (very close now). Indicator 2 is breaking the bottom triangle line (which will also break key moving average support and note that 21 period half-squeeze keltner channel there too). I honestly doubt this all happens BUT gotta consider all the possibilities and have plans I think. There will be incremental signs if it heads that way.
Break of DJI 24K. If we close below this pivot that could be significant.
Despite the gloom and doom here and in general (isn’t that what a big 2 down is all about? Lol!!) I bought heavy the moment the 61.8% was hit. working so far…but it’s precarious! I’m suspicious SPX will do a final leg down to the 78% at 2627. In which case, I try again there…though I also note NDX is pushing up strongly now, hopefully “leading the way back…”
I think you made a good buy. We need to close the gap from this morning and keep on going up to convince me Minor 2 is over.
What doom and gloom?
I am the lonely bear in this space dude! 🙂
I try not to think of myself as anything except a trader, ready to take advantage of good setups. If I “appear” bullish it’s because my #1 model is (almost) always Lara’s main. BTW, looking at the action on a 15 minute…I just don’t see anything strongly resembling a completed 5 wave down. Looks to me like it’s got a final 5 wave to go, at least. I increasingly think price will tag 2727-28 today, the 78% retracement. I dunno…I see bond rates have turned back up, thankfully for my TBT position. I’ve added there again….
Yep! I agree. No sign yet of a reversal.
Looks like a possible abc correction from April high with c move down now
Back in off the 2627.7 78.6% retracement bounce. Here’s to it holding…if it DOESN’T, next stop down is 2613 the April 25 low, and if it breaks that the 1-2 model is dead, and the next stop is the 1.27% extension of the up move at…2593.
The upcoming verbiage from the FOMC will be tantamount for the direction of the market. With Trump stating the dollar is too high recently and his statements about being impeached should the dems take control in nov it would make it a timely moment to juice the markets a bit with either the talk of lowering rates or just halting rate hikes to see how the economy holds up. This may cause the market to break to the upside. Any negative comments about increasing rates out of the fed would have the opposite effect.
This is one instance in which I completely agree with EW purists on the irrelevancy of news events. The dollar recently completed a five wave decline. We will now get at least three waves up, regardless of any upcoming FED speak.
We may actually be completing E of triangle this morning. If that is correct, we get a rocket ship through the top boundary next…. 🙂
If Minor E of Intermediate 4 is continuing, I think it must make a new low below 2613.30.
E waves are notorious for sharp unexpected reversals and that could certainly happen….
I snagged a few DIA 242 puts after the close yesterday and will sell at the open. Plan is to also close short legs of SPY bear call spreads and re-open spread at lower strikes.
VIX red, futures red…MFM! 🙂
Who ARE these bozos? 🙂
8A massive move is coming in the markets. Just about everyone agrees that we are in a fourth wave triangle and the break will be to the upside. There is very good evidence to suport this view. The larger triangle was entered in an uptrend, and the waves have all clearly been threes. Other indicators like MACD and momentum also point to a triangle. Having said that, as a trader I get quite nervous when there is a unanimous opinion about the market. Altgough rare, triangles can be topping structures, and downside breaks from descending triangles are notoriously violent.. In adfition, several indices have decisively broken years long held trendlines and now appear to be back-testing those broken lines. We also have a Hindenburg Omen on the clock through May 18, and we can actually see a smaller triangle which formed after an impulse down. While we remain within the converging lines of the triangle and stuck between the 50 and 200 day I will stay positioned market neutral. We will have clear confirmation of the break. I think DJI 24K is also a critical level, and any fall of that pivot could be an early warning if it happens. I continue to use spreads to take advantage of the whipsaw. This is the best way to trade a sideways market. Every approach of the triangle’s top boundary has been a great shorting opportunity but we are now almost at the apex and a break out should be just days away, if not hours…
Verne,
Another TA that I follow had indicated that the bottom will be made around April 30 or May 01 followed by a ramp move higher that will leave most people wondering how and why this happened. Last friday, rumours were out that someone large was on caught on the wrong side of trade following AMZN and MSFT earnings and was selling to keep things from getting out of hand (read manage losses). I am waiting for the earning from Apple today to see what and how market reacts but that might only be limited to Apple as bad earnings will simply move money from names like Apple into other growing name.
BTW: same TA indicates significant drop into June / July for this market 🙂
Intetesting! I was also expecting a low to co-incide with the April 30 full moon but it may come today in the a.m. Apple earnings could indeed be a market mover. They stopped spiking VIX down every Wednesday after the lawsuit was filed but they may be desperate enough to go back to that subterfuge. Market volume continues to dry up…not good…
Not many bears out there 🙂
might as well admit I’m here