
A little upwards movement to a target at 2,694 – 2,696 was expected before a resumption of a pullback. Price did gap higher to complete the Elliott wave structure, but fell short of the target by 10.45 points. Thereafter, downwards movement unfolded as was expected overall for the week.
Summary: Today’s low may be the end of a multi week consolidation. A new bull run may begin here to a target at 2,944. However, the risk remains that a low is not yet in place. If price does move a little lower, then risk is at 2,553.80.
For the short term, a new high above 2,683.55 would add confidence that a low is in place. At that point, the invalidation point may be pulled up to 2,617.32.
Always practice good risk management. Always trade with stops and invest only 1-5% of equity on any one trade.
New updates to this analysis are in bold.
The biggest picture, Grand Super Cycle analysis, is here.
Last historic analysis with monthly charts is here. Video is here.
An alternate idea at the monthly chart level is given here at the end of this analysis.
An historic example of a cycle degree fifth wave is given at the end of the analysis here.
MAIN ELLIOTT WAVE COUNT
WEEKLY CHART
Click chart to enlarge.
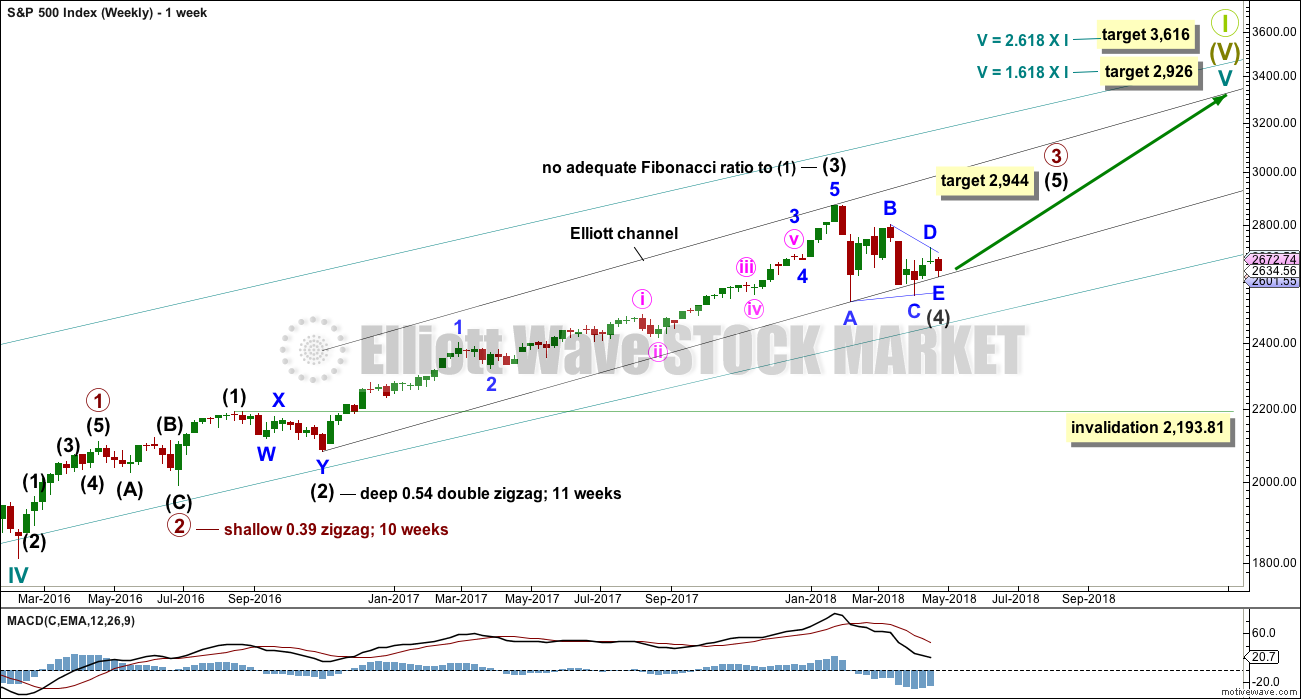
Cycle wave V must complete as a five structure, which should look clear at the weekly chart level. It may only be an impulse or ending diagonal. At this stage, it is clear it is an impulse.
Within cycle wave V, the third waves at all degrees may only subdivide as impulses.
Intermediate wave (4) has breached an Elliott channel drawn using Elliott’s first technique. The channel is redrawn today using Elliott’s second technique: the first trend line from the ends of intermediate waves (2) to (4) at today’s low, then a parallel copy on the end of intermediate wave (3). Intermediate wave (5) may end either midway within the channel, or about the upper edge.
Three wave counts remain valid at the daily chart level. It is possible still that a low may not be in place; intermediate wave (4) could still continue further. Intermediate wave (4) may not move into intermediate wave (1) price territory below 2,193.81. However, it would be extremely likely to remain within the wider teal channel (copied over from the monthly chart) if it were to be reasonably deep. This channel contains the entire bull market since the low in March 2009, with only two small overshoots at the end of cycle wave IV. If this channel is breached, then the idea of cycle wave V continuing higher would be discarded well before the invalidation point is breached.
If intermediate wave (4) ends anytime within this week, then it would total a Fibonacci 13 weeks. It would have excellent proportion with intermediate wave (2), and there would be perfect alternation if it is over as a shallow triangle.
At this stage, there are still three possible structures for intermediate wave (4): a triangle, a combination, and a flat correction. All three will be published. The triangle is preferred because that would see price continue to find support about the 200 day moving average. While this average continues to provide support, it is reasonable to expect it to continue (until it is clearly breached).
DAILY CHART
Click chart to enlarge.
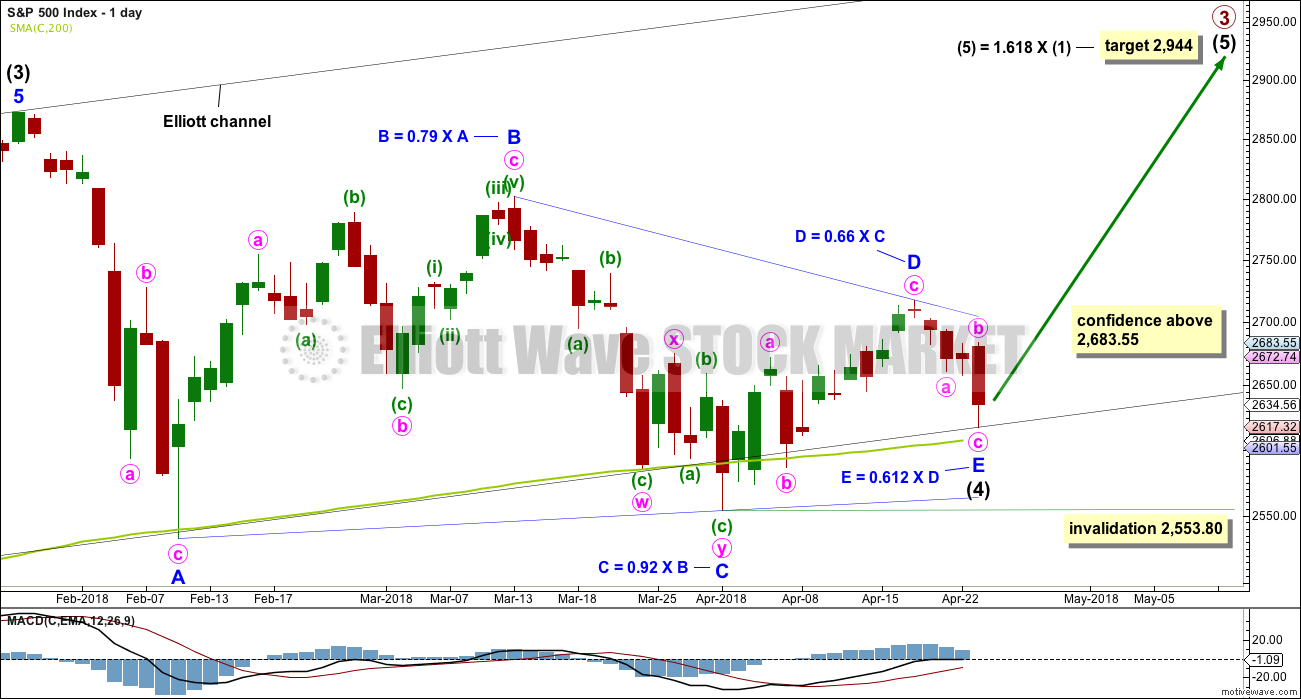
It is possible today that intermediate wave (4) is now a complete regular contracting triangle, the most common type of triangle. Minor wave E may have ended at today’s low, finding support just above the 200 day moving average and ending reasonably short of the A-C trend line. This is the most common look for E waves of triangles.
Intermediate wave (3) exhibits no Fibonacci ratio to intermediate wave (1). It is more likely then that intermediate wave (5) may exhibit a Fibonacci ratio to either of intermediate waves (1) or (3). The most common Fibonacci ratio would be equality in length with intermediate wave (1), but in this instance that would expect a truncation. The next common Fibonacci ratio is used to calculate a target for intermediate wave (5) to end.
It must be accepted today that the risk with this wave count is that a low may not yet be in place; intermediate wave (4) could continue lower. For this triangle wave count, minor wave E may not move beyond the end of minor wave C below 2,553.80.
HOURLY CHART
Click chart to enlarge.
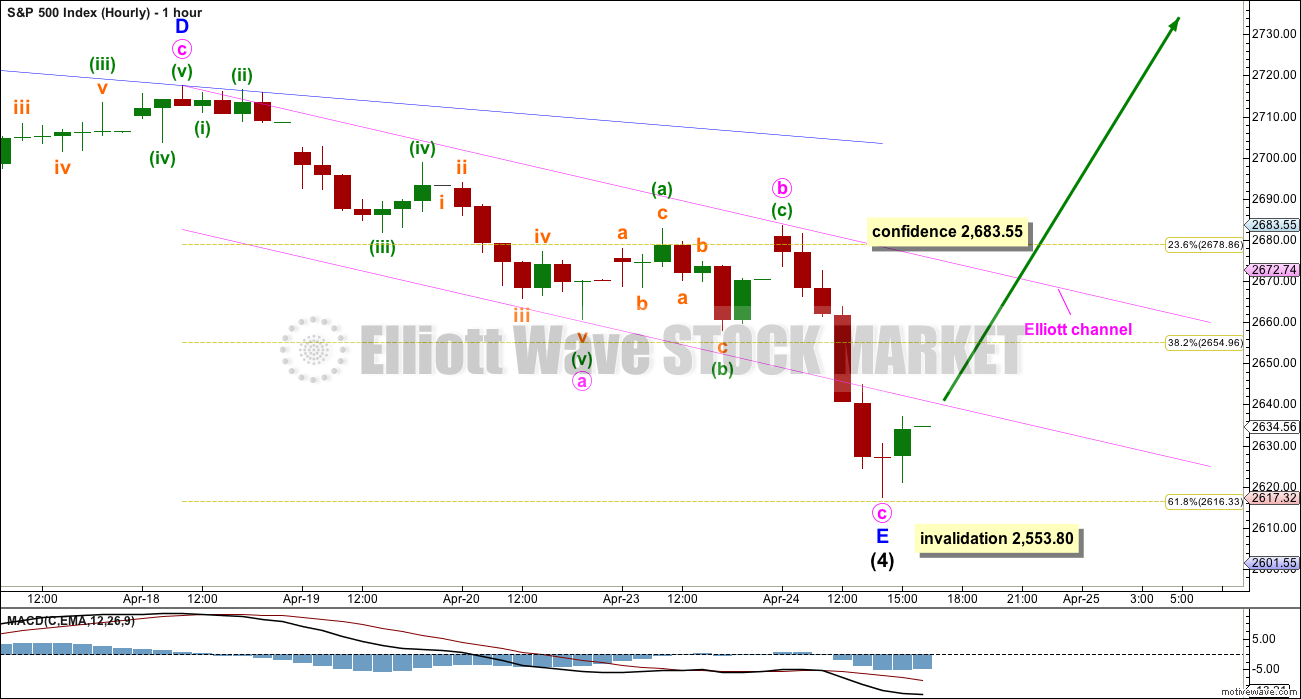
Minor wave E now subdivides as a complete zigzag. There is no adequate Fibonacci ratio between minute waves a and c.
A channel is drawn about minor wave E using Elliott’s technique for a correction. The earliest confidence that a low may be in place would come with a breach of the upper edge of this channel by upwards movement.
Thereafter, a new high above 2,683.55 would add further confidence that a low may be in place. This point is the start of minute wave c. A new high above the start of minute wave c could not be a second wave correction within minute wave c, so at that stage minute wave c would have to be over and the invalidation point may move up to the end of minor wave E at 2,617.32.
Triangles most commonly end with wave E falling reasonably short of the A-C trend line. The first movement after the completion of a triangle is often swift and sharp.
ALTERNATE WAVE COUNTS
DAILY CHART – COMBINATION
Click chart to enlarge.
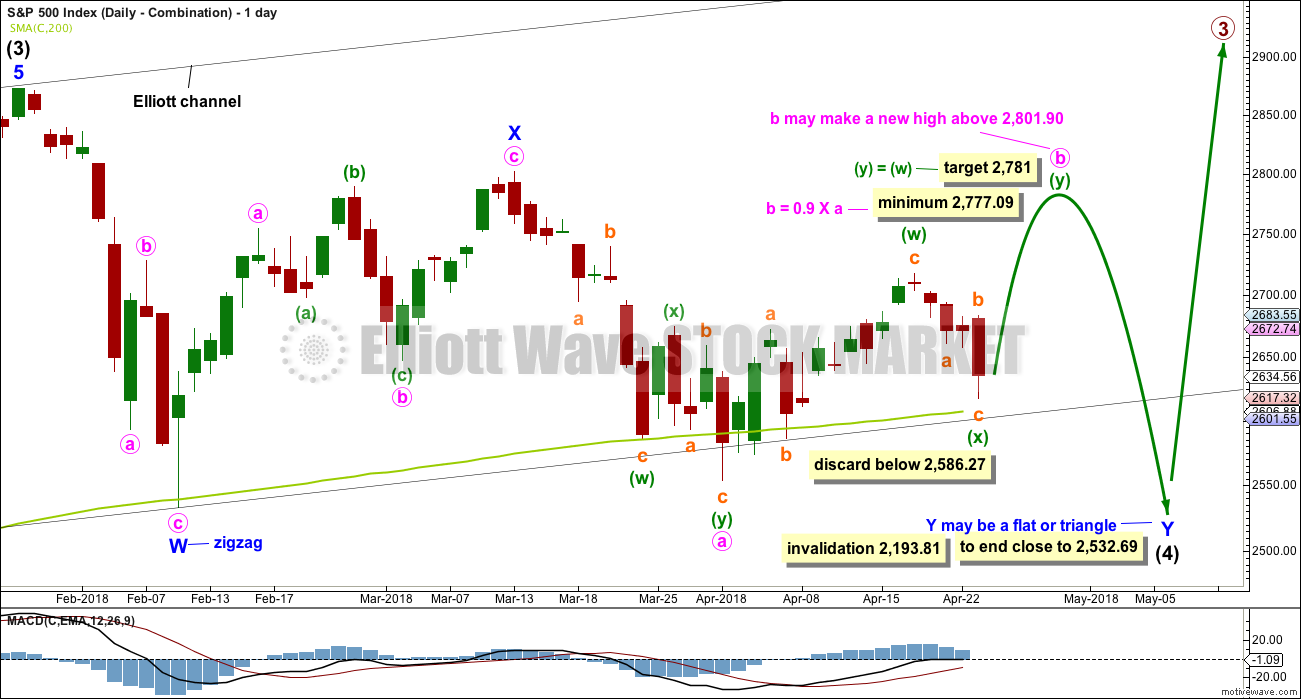
Double combinations are very common structures. The first structure in a possible double combination for intermediate wave (4) would be a complete zigzag labelled minor wave W. The double should be joined by a three in the opposite direction labelled minor wave X, which may be a complete zigzag. X waves within combinations are typically very deep; if minor wave X is over at the last high, then it would be a 0.79 length of minor wave W, which is fairly deep giving it a normal look. There is no minimum nor maximum requirement for X waves within combinations.
The second structure in the double would most likely be a flat correction labelled minor wave Y. It may also be a triangle, but in my experience this is very rare, so it will not be expected. The much more common flat for minor wave Y will be charted and expected.
A flat correction would subdivide 3-3-5. Minute wave a must be a three wave structure, most likely a zigzag. It may also be a double zigzag.
Minute wave b must now reach a minimum 0.90 length of minute wave a. The structure of minute wave b is relabelled to have a better fit with most recent price movement. Minute wave b may be unfolding as a double zigzag. Within a double zigzag, the second zigzag exists to deepen the correction when the first zigzag did not move price deep enough. Double zigzags normally have a strong slope like single zigzags. To achieve a strong slope the X wave within a double zigzag is normally brief and shallow, most importantly shallow (it rarely moves beyond the start of the first zigzag). A new low now below 2,586.27 should see the idea of a double zigzag for minute wave b discarded.
The purpose of combinations is to take up time and move price sideways. To achieve this purpose the second structure in the double usually ends close to the same level as the first. Minor wave Y would be expected to end about the same level as minor wave W at 2,532.69. This would require a strong overshoot or breach of the 200 day moving average, which looks unlikely but does have precedent in this bull market.
Minute wave b may make a new high above the start of minute wave a if minor wave Y is an expanded flat. There is no maximum length for minute wave b, but there is a convention within Elliott wave that states when minute wave b is longer than twice the length of minute wave a the idea of a flat correction continuing should be discarded based upon a very low probability. That price point would be at 3,050. However, if price makes a new all time high and upwards movement exhibits strength, then this idea would be discarded at that point. Minute wave b should exhibit obvious internal weakness, not strength.
DAILY CHART – FLAT
Click chart to enlarge.
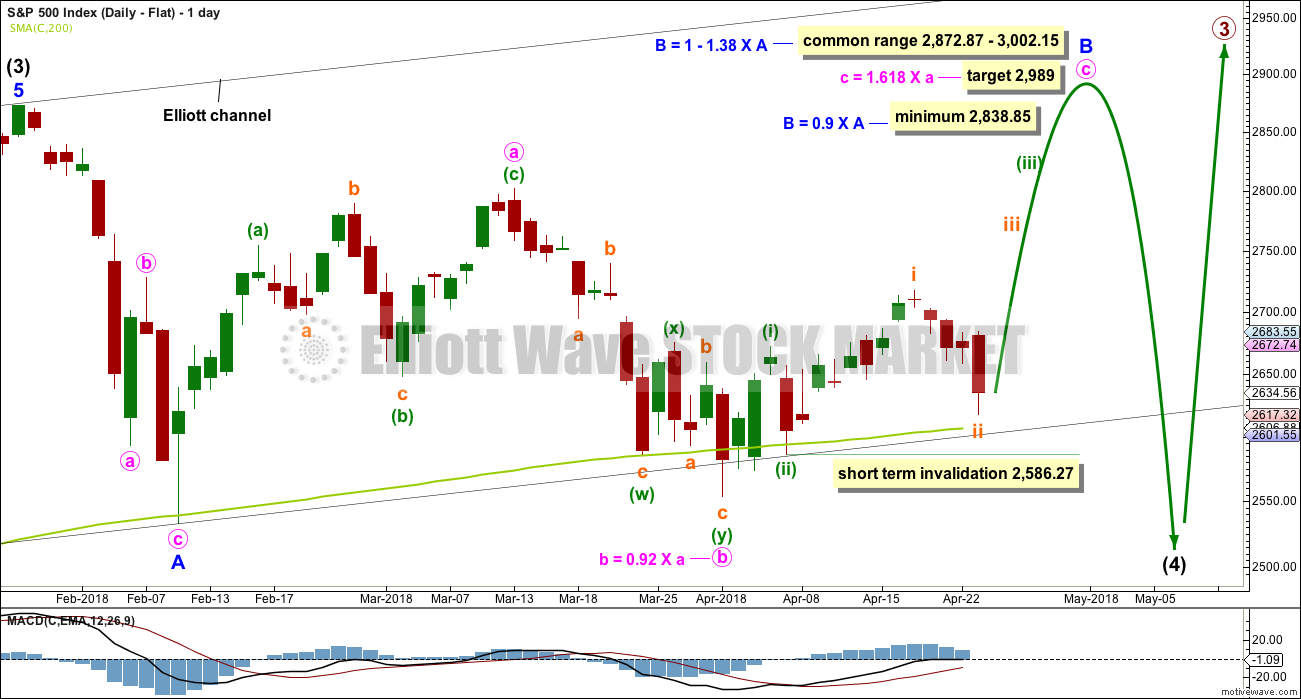
Flat corrections are very common. The most common type of flat is an expanded flat. This would see minor wave B move above the start of minor wave A at 2,872.87.
Within a flat correction, minor wave B must retrace a minimum 0.9 length of minor wave A at 2,838.85. The most common length for minor wave B within a flat correction would be 1 to 1.38 times the length of minor wave A at 2,872.87 to 3,002.15. An expanded flat would see minor wave B 1.05 times the length of minor wave A or longer, at 2,889.89 or above. A target is today calculated for minor wave B to end, which would see it end within the common range.
Minor wave B may be a regular flat correction, and within it minute wave a may have been a single zigzag and minute wave b may have been a double zigzag. This has a very good fit.
However, minute wave c must be a five wave structure for this wave count and now the depth and duration of subminuette wave ii looks wrong. The probability that minute wave c upwards is unfolding as an impulse is now reduced. It is possible that it could be a diagonal, but that too has a relatively low probability as the diagonal would need to be expanding to achieve the minimum price target for minor wave B, and expanding ending diagonals are not very common.
At its end minor wave B should exhibit obvious weakness. If price makes a new all time high and exhibits strength, then this wave count should be discarded.
This wave count would require a very substantial breach of the 200 day moving average for the end of intermediate wave (4). This is possible but may be less likely than a smaller breach.
TECHNICAL ANALYSIS
WEEKLY CHART
Click chart to enlarge. Chart courtesy of StockCharts.com.
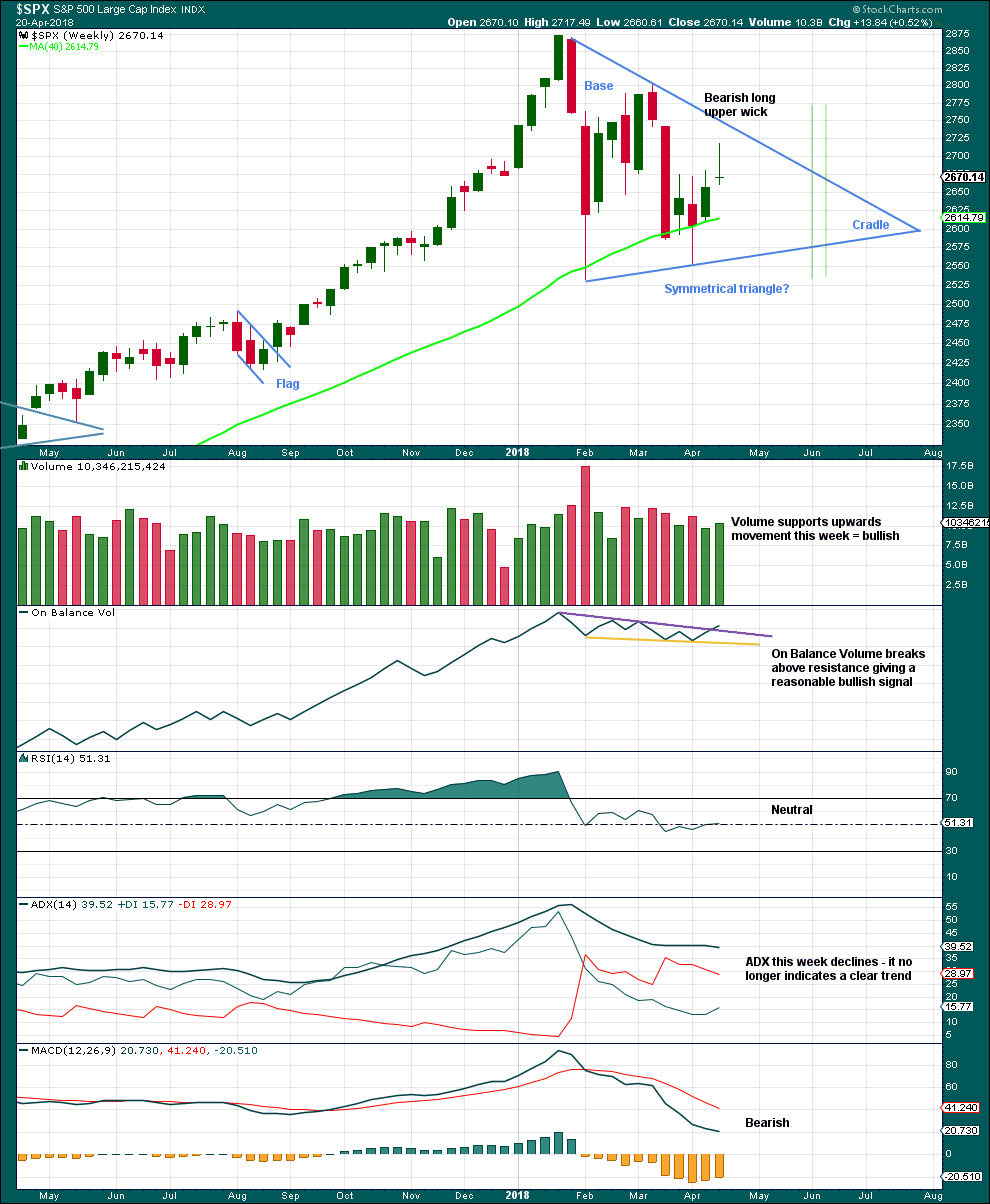
A classic symmetrical triangle pattern may be forming. These are different to Elliott wave triangles. Symmetrical triangles may be either continuation or reversal patterns, while Elliott wave triangles are always continuation patterns and have stricter rules.
The vertical green lines are 73% to 75% of the length of the triangle from cradle to base, where a breakout most commonly occurs.
From Dhalquist and Kirkpatrick on trading triangles:
“The ideal situation for trading triangles is a definite breakout, a high trading range within the triangle, an upward-sloping volume trend during the formation of the triangle, and especially a gap on the breakout.”
For this example, the breakout has not yet happened. There is a high trading range within the triangle, but volume is declining.
The triangle may yet have another 7 – 8 weeks if it breaks out at the green lines.
On Balance Volume gives a reasonable bullish signal last week with a breakout from a small range, above resistance. The signal is neither strong nor weak. The trend line broken has a shallow slope, is somewhat long held, and has been tested three or four times before.
A bullish signal from On Balance Volume and support last week for upwards movement offer good support to the main Elliott wave count. The bearish long upper wick though suggests a pullback for the short term, which is also what the main Elliott wave count expects.
DAILY CHART
Click chart to enlarge. Chart courtesy of StockCharts.com.
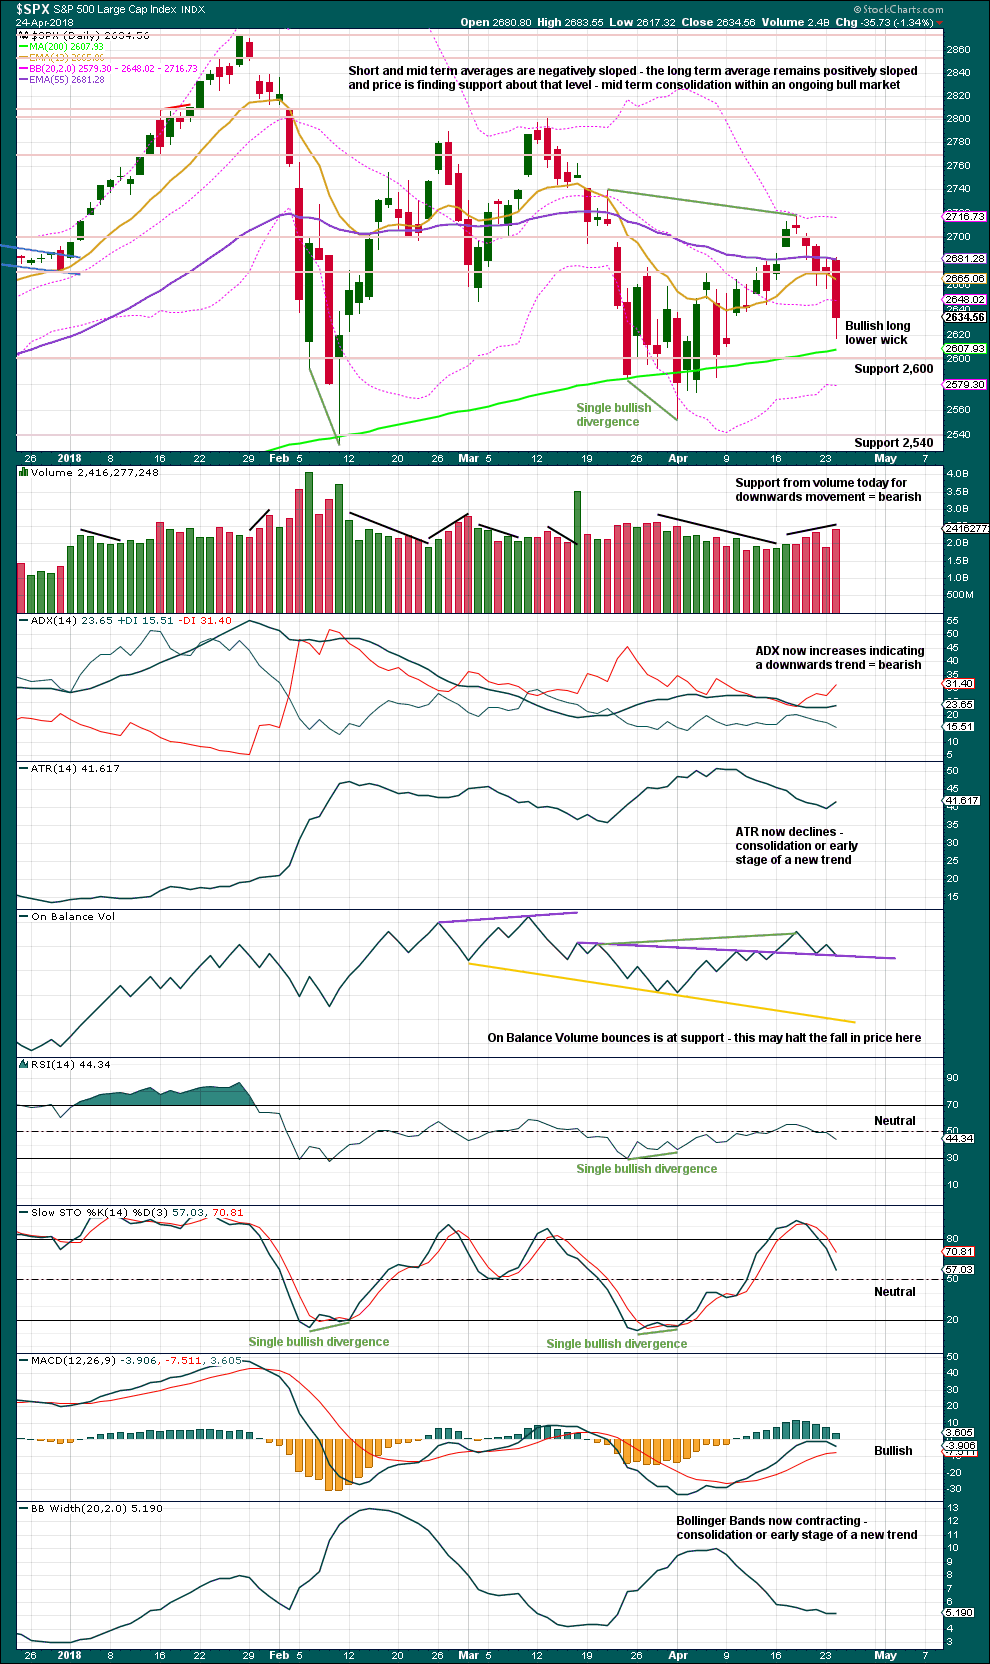
Another long lower wick is bullish, especially as it comes about the 200 day moving average. However, support from volume suggests today that a low may not be in place.
Give weight to On Balance Volume at support. This supports the main Elliott wave count. There is still bullish divergence between price and On Balance Volume.
VOLATILITY – INVERTED VIX CHART
Click chart to enlarge. Chart courtesy of StockCharts.com.
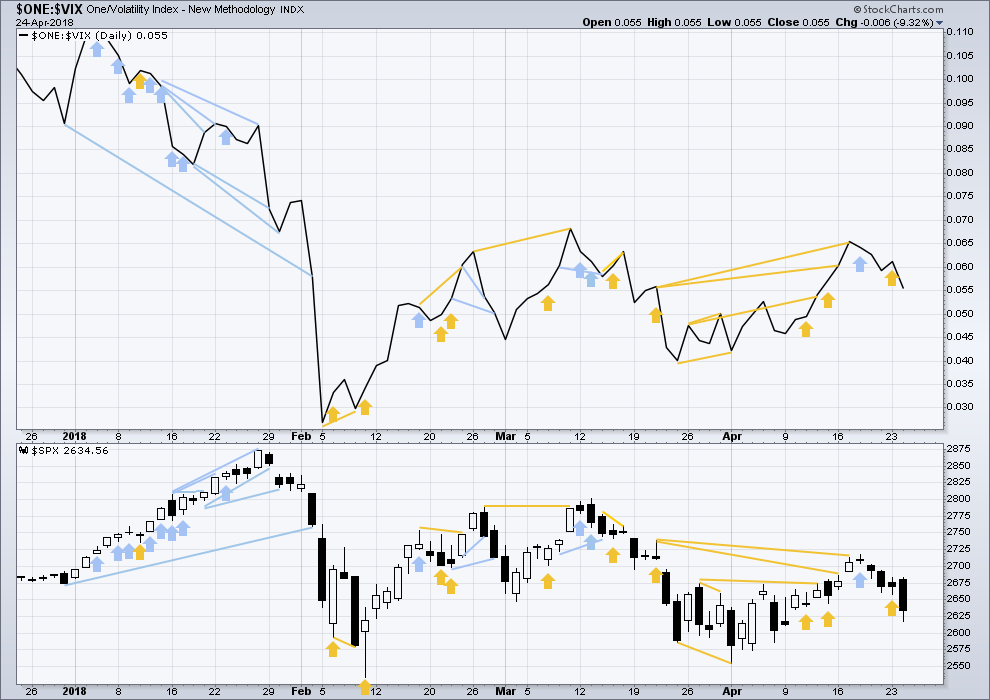
So that colour blind members are included, bearish signals will be noted with blue and bullish signals with yellow.
Normally, volatility should decline as price moves higher and increase as price moves lower. This means that normally inverted VIX should move in the same direction as price.
Bullish divergence noted in yesterday’s analysis has now been followed by a downwards day, so it may have failed.
However, there remains a cluster here of bullish signals from inverted VIX. This may still offer some support to the main Elliott wave count.
BREADTH – AD LINE
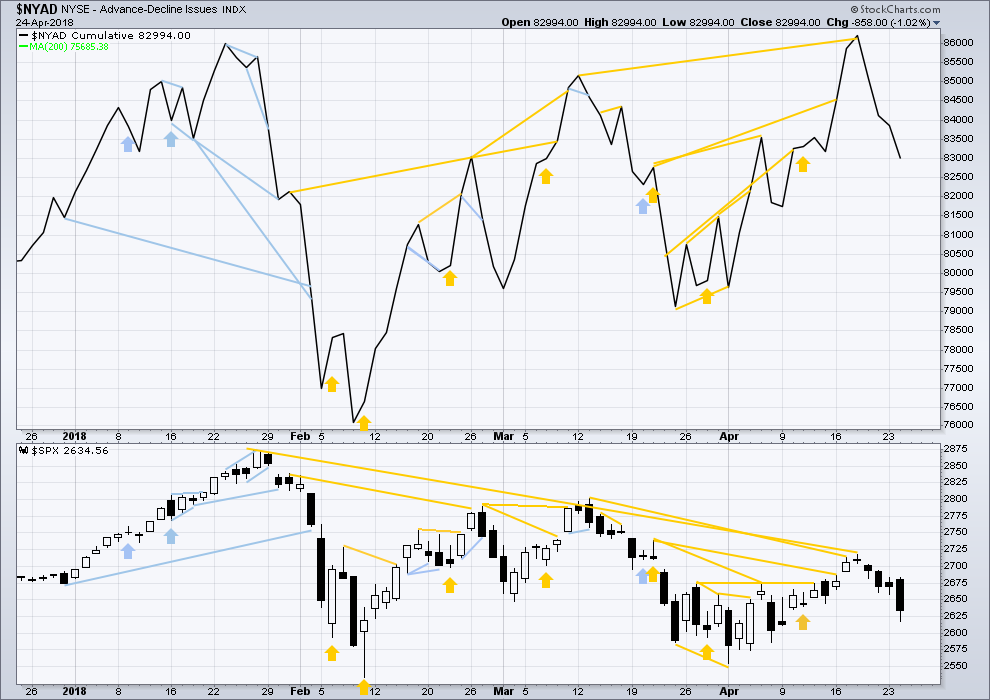
Click chart to enlarge. Chart courtesy of StockCharts.com.
There is normally 4-6 months divergence between price and market breadth prior to a full fledged bear market. This has been so for all major bear markets within the last 90 odd years. With no longer term divergence yet at this point, any decline in price should be expected to be a pullback within an ongoing bull market and not necessarily the start of a bear market. A new all time high from the AD line this week means that any bear market may now be an absolute minimum of 4 months away.
As of today both mid and large caps have made new swing lows below the prior low of the 13th of April, but small caps have not. This divergence is interpreted as bullish; small caps may be leading the market here.
Breadth should be read as a leading indicator.
The new all time high from the AD line remains very strongly bullish and supports the main Elliott wave count.This new all time high from the AD line will be given much weight in this analysis. This is the piece of technical evidence on which I am today relying most heavily in expecting a low may be in place here or very soon.
There has been a cluster of bullish signals from the AD line in the last few weeks. This also overall offers good support to the main Elliott wave count.
Both price and the AD line have again moved lower. The fall today in price has support from falling market breadth. This is bearish.
DOW THEORY
The following lows need to be exceeded for Dow Theory to confirm the end of the bull market and a change to a bear market:
DJIA: 23,360.29.
DJT: 9,806.79.
S&P500: 2,532.69.
Nasdaq: 6,630.67.
At this stage, only DJIA has made a new major swing low. DJT also needs to make a new major swing low for Dow Theory to indicate a switch from a bull market to a bear market. For an extended Dow Theory, which includes the S&P500 and Nasdaq, these two markets also need to make new major swing lows.
Charts showing each prior major swing low used for Dow Theory may be seen at the end of this analysis here.
Published @ 10:20 p.m. EST.
I think the triangle remains incomplete. Looks to me like one more high to compete D then E down. Reversals out of completed triangles are unmistakable. I suspect we will see a final low with the full moon on the 30 of the month.
Hi Verne
How high do you think the D will go considering if you think theres going to be a new low by new Monday?
Thank You
I am assuming it will remain a contracting triangle and stay below the b wave high. I plan to exit longs on the first tick past the most recent high or thereabouts…
For the triangle to be continuing, we’d have to see minor D as a double zigzag.
which means minor C down needs to be a single zigzag, and for that to work there’s a truncation in there.
which must necessarily reduce the probability of the idea
This is why we’re here, Lara!
I counted the impulse down for A complete at your third wave to avoid the truncation. Initially I did not think it would work as the third wave just seemed too small, but it would not be the shortest under that scenario, with a bigger fifth down. We should soon know if the triangle is done with a clear breach of the BD trendline, which in my experience, generally occurs the session the triangle completes or certainly the next. Just thinking out loud folk…. 🙂
Whoa… interesting thought, Verne! Gotta ponder that one a while. Looking at the daily chart, it might just be plausible… I suppose… maybe… hmmmmm…
That certainly is a possible final outcome for this Intermediate triangle. If it proves true, then Minor D would certainly be the most complicated wave of the triangle. In any event, under that scenario while the final low of Minor E would be the last low of the series of waves before it breaks out upward, I still think the low of today will remain lower than the proposed Minor E. But it could come very close.
How about that. It turns green right at the close. Do you have a bullish hammer on the daily chart?
Not a hammer because there’s an upper shadow.
But there certainly is a long lower wick today, that’s pretty bullish. And On Balance Volume is bouncing up off support, another bullish signal there.
Updated hourly chart:
Another small push lower. Minute c may still be seen as a five, remember that the S&P just doesn’t always have nice looking waves. The fact here that minuette (iv) shows up clearly on the hourly chart but minuette (ii) does not, doesn’t mean it can’t be a five. And checking all the little subdivisions on the five minute chart may not necessarily give a definitive answer.
For newer members (of which we now have quite a few) you may read that and be unimpressed. I understand the desire to see EW as a definitive tool. But it’s important to understand that there is nothing in TA that is definitive, so expecting EW to be so would be unrealistic.
Anyway….
price is back within the Elliott channel. Now let us see if it can get to the upper edge and then how it behaves when it gets there. If it slices cleanly through that would be very bullish. If it reacts down not so much.
if price keeps rising through this last hour then we shall have two long lower wicks on the last two daily candlesticks, that’s pretty bullish.
a new low, followed by an overall upwards day may see a single day divergence between price and the AD line today. if that happens I’ll be reading that as bullish and will give it reasonable weight in the analysis.
in my experience to date the AD line gives good signals, much more often reliable than not.
but not always. there is nothing in TA that is 100% true all the time.
oh how I wish there was, we’d all be billionaires.
And when everybody’s a billionaire, nobody is! Thanks, Lara, for the late-day update and words of caution about TA!
you’re welcome
members may notice that my updates are closer to 4pm EST than previously
it’s due to daylight savings, it ended here in NZ and I think it started there in the USA
so through your summer the afternoon updates must be later from me because it’s now very early, getting darker and rather cold down here
Hi Lara
It looks like we are back under that line again
price has closed within the Elliott channel.
so we really need to see the upper edge breached for some confidence that a low is in place
This is setting up as a head/shoulders bottom. That said, the longer it goes on without pushing above and staying above the neckline…the more risk it isn’t and resolves with a fresh downward push. As I see it anyway. At the moment, this sequence of higher swing lows on the 5 minute is bullish, if it lasts. Backing and filling appears to be the primary market mode today.
did we just finish an ABC and now heading back down?
If anything it looks a 5 wave up on the 5 min chart from today’s lows to the highs so far, and now we’re having an ABC correction down…
This bounce looks pretty convincing so far. Bottom of E in place now maybe?
Last couple hours look less convincing…
It’s not “strong” off the bottom (ala a big V bottom) but to me it is reasonably (acceptably) convincing. Because (1) the clean hit and turn off a critical 62% fibo, and (2) a fairly close hit on the daily 200 sma. StochasticRSI on hourly triggered long, and there’s now a sequence of green uptrending hourly bars in place. Lastly, there’s the H/W bottom structure formed at the 5/15 minute level. That’s “convincing” to me in the lower timeframes anyway. At the daily level it’ll be a green day with a long tail that barely exceeds yesterday’s low; call it an inside bullish up day, and we can even call it a double bottom! Acceptably convincing to me.
Yep. Possibly 1 and a choppy sideways 2. Or a series of 1-2 waves?
Happy to defer to better clarity.
If we break out of the triangle to the upside, classical TA gives a target of 3015 which is a bit above Lara’s first EW target for intermediate 5 of 2944.
My hourly has flashed a buy, and i have to take it (but not full boat; I’ll add if/as the uptrend develops and pullbacks occur). The buy trigger here for me is the combination of a clean hit and turn on key support (the 62% fibo at 2615) and the buy signal on the hourly stochasticRSI. We’ll see if it all holds…
Hi Kevin
Are you currently long on the SPX?
Thanks
Yes I am Eric.
Note though that I may at times be short as well, to take advantage of the price volatility at lower timeframes.
The SPX weekly has what I call a “half-squeeze” going on. The lower bollinger band is inside the lower keltner channel (by alot; I use 21 period for both btw). I’ve noticed that when price approaches the inner band in a half-squeeze set up, there’s a strong tendency for a sharp move in the other direction. Another small piece of evidence on the side of a motive wave launching soon here. See chart: orange lines are the bollinger bands, blue lines the keltner channels.
interesting… very interesting
thanks for sharing the chart Kevin!
Wow! Look at the options on those futures explode!
I am taking the rest of the day off as they made it really easy today.
I love these am gifts!! Yikes!
Kevin,
I almost forgot our important $1 wager. At what point will you concede the Intermediate 4 correction is a triangle and pay up? I would guess and upwards break of 2718 should be sufficient. What say you?
It looks like Minor E was not quite complete. One more wave to the downside? Perhaps a round number like 2600 will provide the support or the 200 day ma approximately 2608.
When Lara concludes it is/was a triangle Rodney. I’m sure it’s close. Let’s figure out the next one….double or nothin’??
I nabbed my upro profits right after open…and a load of TBT profits too. For upro, definitely the right decision for me. Bottom, bottom, where’s the bottom? Lol!!! Bounced off a bunch of fibo’s in the 2610-15 range and pretty much the daily 200 ma here, but will those hold? I’ll be reentering if it does and I get decent buy triggers.
Me too.
How about when all my other alternates are either invalidated or discarded based upon exceptionally low probability?
I can only conclude the banksters are expecting a massive bear raid in the cash session today…we will see….
More freebies in futures? This is nuts! 🙂
Yesterday someone unloaded a phenomenal amount of CAT stock. The biggest dump I have seen of a blue chip in a very long time…
I’m sorry, I should have mentioned, that would have been me. I hate cats. You know my mountain partner is a yellow lab named Hunter. BTW he chases and hunts down rabbits!
PS – I don’t really hate cats. They are just not my favorite animal especially for a pet.
As far as the market goes, I will be looking for more long positions today.
HyukHyuk! 🙂
Something, or someone, is terrifying the banksters, but what??, who??….
YM?
DOW futures…June contracts…
What’s up with all this free money the banksters are throwing around?! Instant double on options on YM futures!!!
What am I missing here? 🙂
The criminal behind the scenes machinations notwithstanding, it is rare to see such a public display of outright PANIC.
There must be something to the rumors about DJI 24 K. This is creepy!
Hi Verne
What do you mean by outright panic
with the dow at 24K
Are you saying that they are trying to keep at least at that level?
Thank You
He’s referring to the large 15 or so minute sell off to open the session today. “They” jacked the price up overnight, and it sold off hard and fast. Panic is a bit hyperbolic about it, but as it’s happening…it would feel like panic. After the fact when you see it only returned to yesterday’s low…not so much panic really.
Are you kidding me??!!!
I know the banksters are worried about the DAX slide but that YM green candle is beyond ridiculous. I suspect it is going to be a tough day for the cartel…
The. B bands are definitely worth watching as the lower band is startimg to curl downwards, offering weaker support. I quicky got booted out of my last big bullish trade but fortunately I was able to povot as it was a spread. I held onto a few “canary” SPY 265 strile puts expiring tomorrow and they are still simging!
Seems like a poke down to that lower bollinger band on the daily is quite likely here.
Also, there’s been two recent Larry William’s “oops” days (a day after significant selling with an open below the prior bar and a close in the body of the prior bar) immediately after selloff days like Tuesday, one in early February and another early March. That would not surprise me. Nor would a “blow off bottom” long tail day that reaches down to the area of the recent lows, below the lower bollinger. Most likely I suppose is general backing/filling that takes price slowly sideways and down. And who knows, maybe the market turns on a dime here, not impossible. I’m going to have a plan for every contingency, myself.
All is quiet on the Western front Doc…until the open…. 🙂