
Short term movement fits the Elliott wave count at the hourly chart level very well. The target remains the same.
Summary: Look out for most likely upwards movement tomorrow to a short term target at 2,694 – 2,696. If price moves above the target, look for very strong resistance at the upper triangle B-D trend line. Thereafter, expect a pullback to 2,587 – 2,578 to continue.
When this pullback is done, then a new bull run to new all time highs may begin. At its end this pullback may offer an excellent entry opportunity to a long term position. The pullback may end about the end of this week or possibly next week.
Always practice good risk management. Always trade with stops and invest only 1-5% of equity on any one trade.
New updates to this analysis are in bold.
The biggest picture, Grand Super Cycle analysis, is here.
Last historic analysis with monthly charts is here. Video is here.
An alternate idea at the monthly chart level is given here at the end of this analysis.
An historic example of a cycle degree fifth wave is given at the end of the analysis here.
MAIN ELLIOTT WAVE COUNT
WEEKLY CHART
Click chart to enlarge.
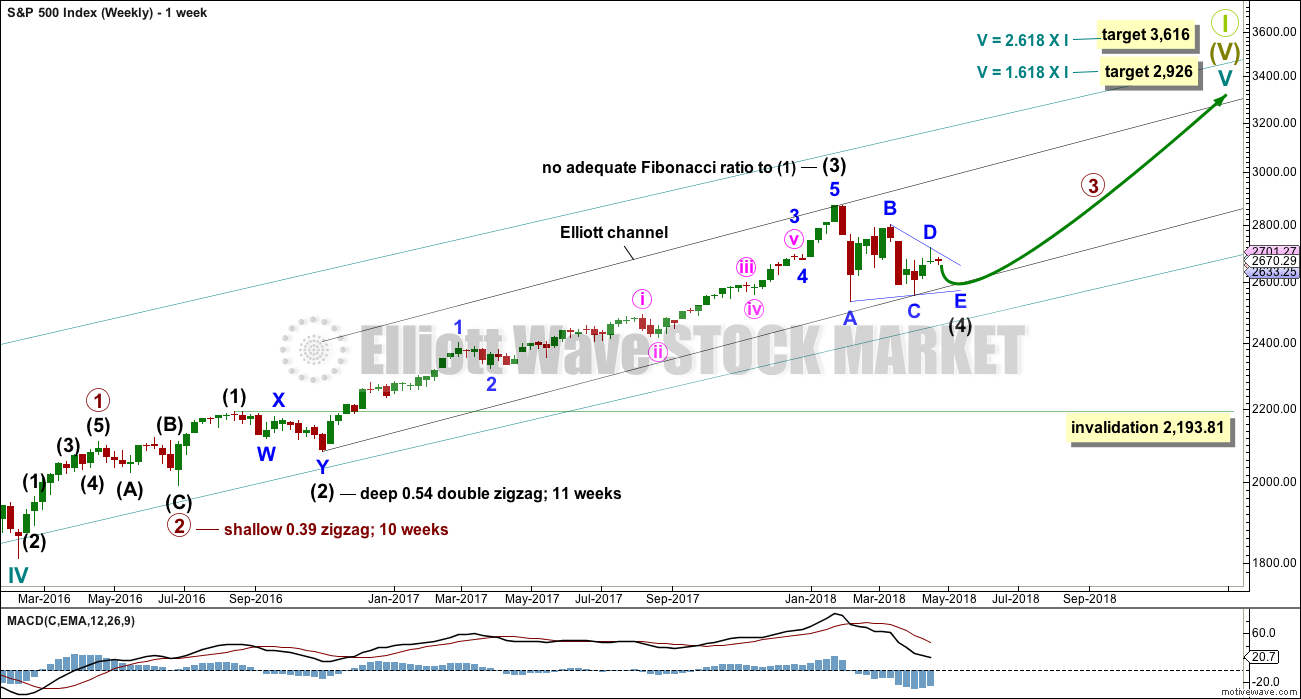
Cycle wave V must complete as a five structure, which should look clear at the weekly chart level. It may only be an impulse or ending diagonal. At this stage, it is clear it is an impulse.
Within cycle wave V, the third waves at all degrees may only subdivide as impulses.
Intermediate wave (4) has breached an Elliott channel drawn using Elliott’s first technique. The channel is redrawn using Elliott’s second technique with a slight adjustment. The upper edge may provide resistance for intermediate wave (5).
Intermediate wave (4) may not move into intermediate wave (1) price territory below 2,193.81. However, it would be extremely likely to remain within the wider teal channel (copied over from the monthly chart) if it were to be reasonably deep. This channel contains the entire bull market since the low in March 2009, with only two small overshoots at the end of cycle wave IV. If this channel is breached, then the idea of cycle wave V continuing higher would be discarded well before the invalidation point is breached.
If intermediate wave (4) now continues for one more week, it may end in a total Fibonacci thirteen weeks.
At this stage, there are still three possible structures for intermediate wave (4): a triangle, a combination, and a flat correction. All three will be published. The triangle is preferred because that would see price continue to find support about the 200 day moving average. While this average continues to provide support, it is reasonable to expect it to continue (until it is clearly breached).
DAILY CHART
Click chart to enlarge.
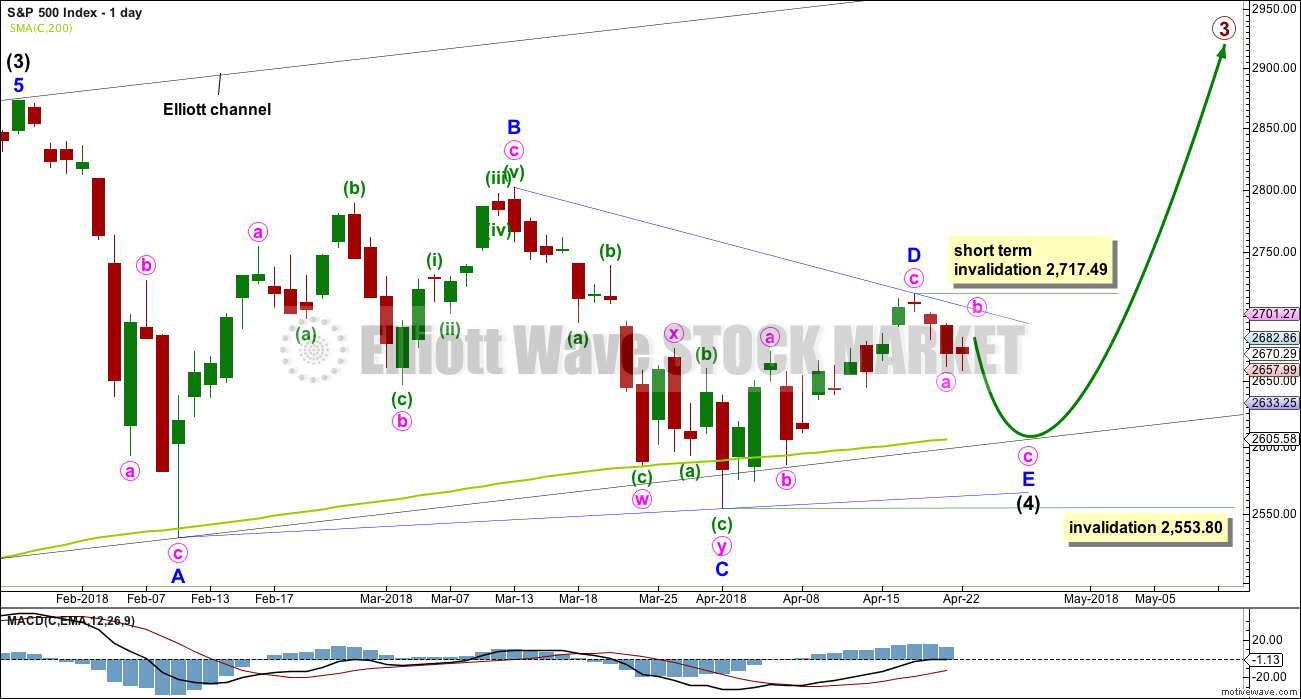
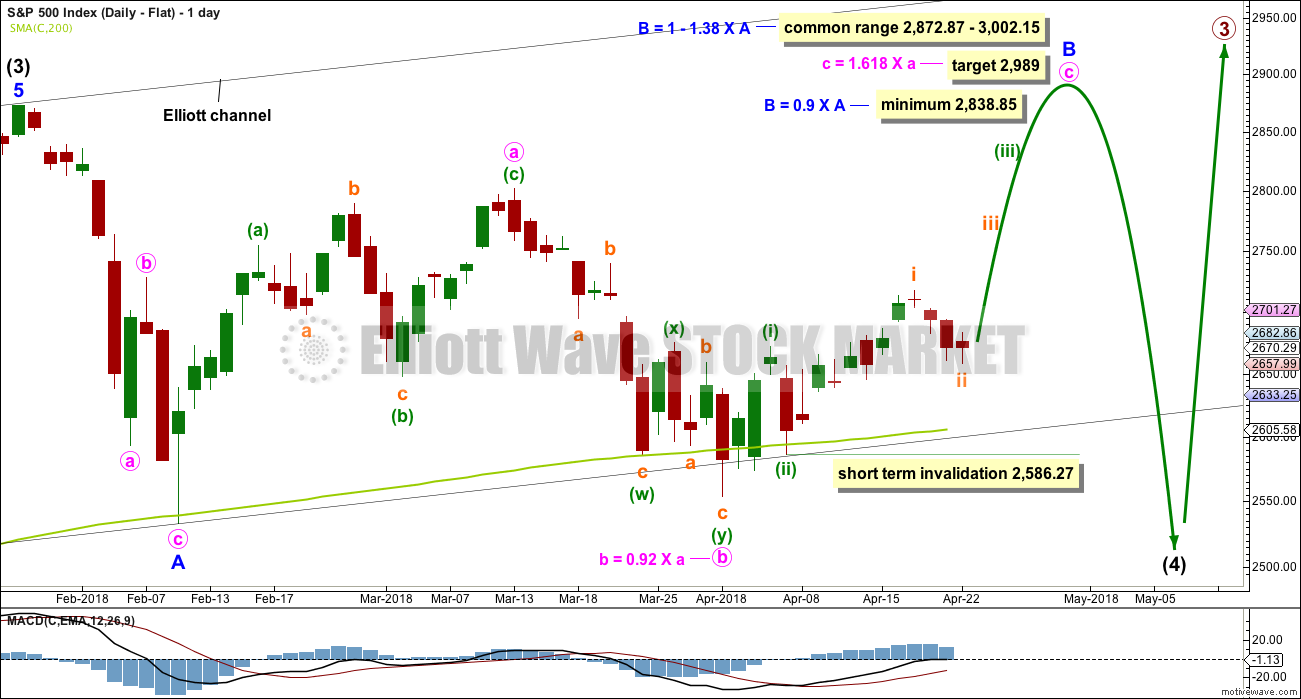
Intermediate wave (4) may be an incomplete regular contracting triangle. The final sub-wave of minor wave E downwards may be unfolding, which may not move in a straight line. Look for a bounce within minor wave E for minute wave b. Minor wave E may last a few days and would most likely fall short of the A-C trend line. This may see it find support about the 200 day moving average. If it does not end there, then the next most likely place for it to end would be with a small overshoot of the A-C trend line.
When intermediate wave (4) could be labelled as a complete triangle, then a new bull run to new all time highs would be expected. Intermediate wave (5) may be expected to make a new high above the end of intermediate wave (3) to avoid a truncation. When the end of intermediate wave (4) and the start of intermediate wave (5) is known, then a target for intermediate wave (5) to end may be calculated. That cannot be done yet.
Within minor wave E, minute wave b may not move beyond the start of minute wave a above 2,717.49.
Minor wave E may not move beyond the end of minor wave C below 2,553.80.
HOURLY CHART
Click chart to enlarge.
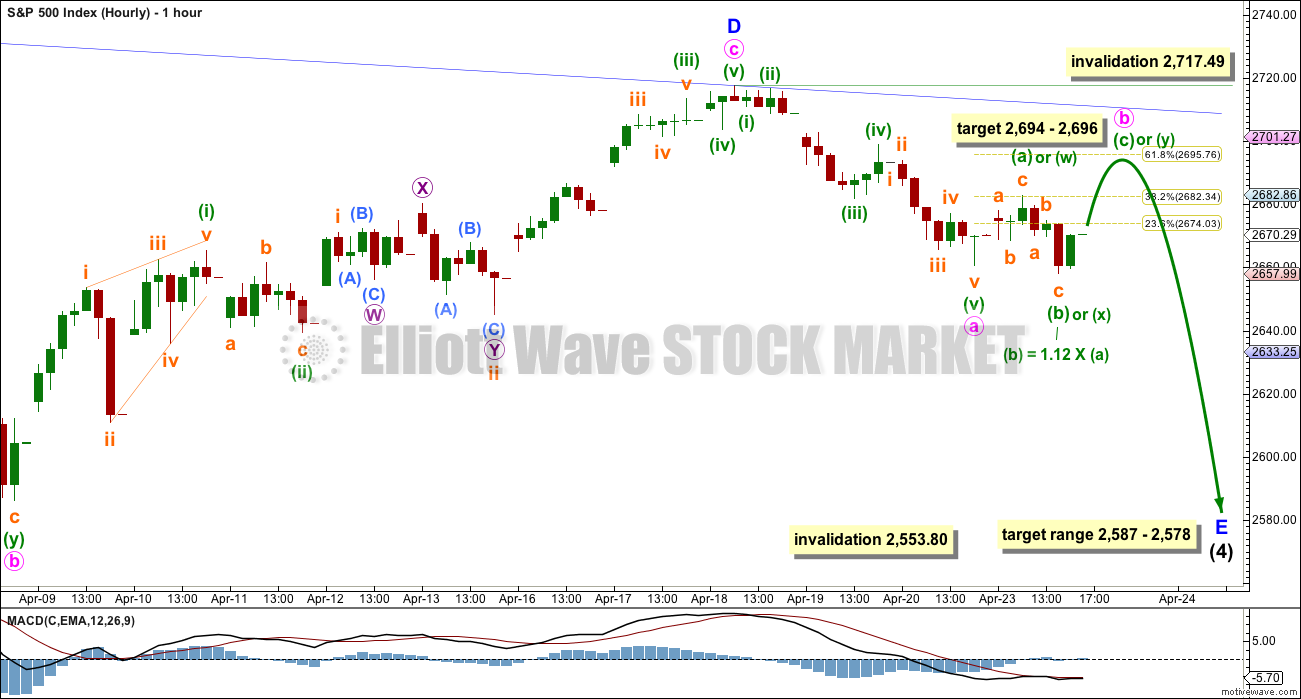
Minor wave E should subdivide as a zigzag. The most common length for triangle sub-waves, in my experience, is from 0.8 to 0.85 the length of the prior sub-wave. This gives a target range for minor wave E to end from 2,587 to 2,578.
Within the zigzag of minor wave E, when minute waves a and b are complete, a target for minute wave c may be calculated using the Fibonacci ratio between minute waves a and c. That cannot be done yet.
Minute wave a fits well as a five wave impulse, complete at Friday’s low. Subsequent movement now looks too large to be a correction within minute wave a, so minute wave a looks complete. Sideways movement for Monday looks like a new wave, which may be minute wave b.
Minute wave b may continue further for at least one more day, so that it shows up on the daily chart and for minor wave E to have a three wave look at the daily chart level.
Minute wave b may be an expanded flat correction, which is a very common structure. At 2,674 minuette wave (c) would reach 1.618 the length of minuette wave (a). This is just 2 points below the 0.618 Fibonacci ratio of minute wave a at 2,696, giving a 2 point target zone. If minute wave b does not end there and moves higher, then expect it to find very strong resistance at the upper blue B-D triangle trend line copied over from the daily chart. Triangles normally adhere strictly to their trend lines. They may have small overshoots, but the trend lines are not normally breached while the triangle is incomplete.
It is also possible that minute wave b may be a running triangle and may continue sideways in an ever decreasing range for another few days.
It is also possible that minute wave b may be a combination with the first structure in a double a complete zigzag labelled minuette wave (w). The double may now be joined by a three in the opposite direction, a zigzag labelled minuette wave (x). A flat correction may now continue sideways for a couple of days or so for minuette wave (y) to complete a double combination. Minuette wave (y) may be expected to reach about the same level as minuette wave (w) at about 2,683, so that the whole structure takes up time and moves price sideways.
ALTERNATE WAVE COUNTS
DAILY CHART – COMBINATION
Click chart to enlarge.
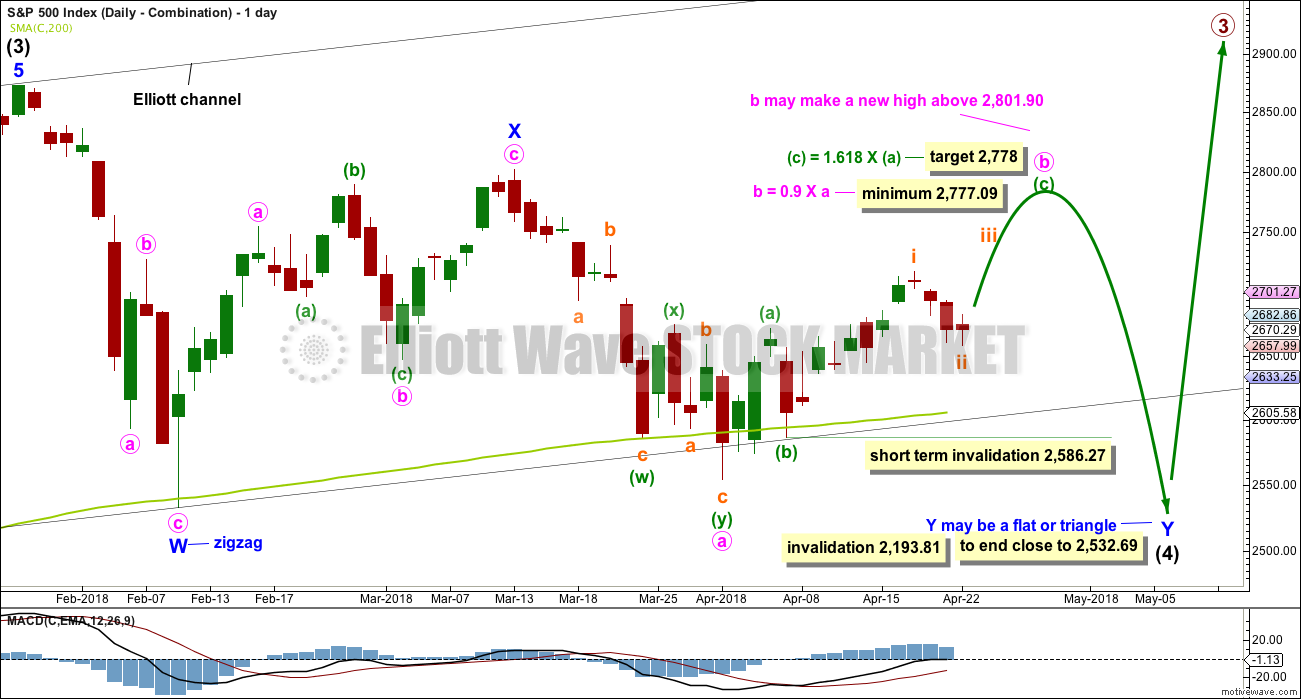
Double combinations are very common structures. The first structure in a possible double combination for intermediate wave (4) would be a complete zigzag labelled minor wave W. The double should be joined by a three in the opposite direction labelled minor wave X, which may be a complete zigzag. X waves within combinations are typically very deep; if minor wave X is over at the last high, then it would be a 0.79 length of minor wave W, which is fairly deep giving it a normal look. There is no minimum nor maximum requirement for X waves within combinations.
The second structure in the double would most likely be a flat correction labelled minor wave Y. It may also be a triangle, but in my experience this is very rare, so it will not be expected. The much more common flat for minor wave Y will be charted and expected.
A flat correction would subdivide 3-3-5. Minute wave a must be a three wave structure, most likely a zigzag. It may also be a double zigzag.
Minute wave b must now reach a minimum 0.90 length of minute wave a. Minute wave b must be a corrective structure. It may be any corrective structure. It may be unfolding as a zigzag. A target is calculated for it to end. Within minuette wave (c), subminuette wave ii may not move beyond the start of subminuette wave i below 2,586.27.
At this stage, the duration of subminuette wave ii no longer looks right. This wave count is reducing in probability.
The purpose of combinations is to take up time and move price sideways. To achieve this purpose the second structure in the double usually ends close to the same level as the first. Minor wave Y would be expected to end about the same level as minor wave W at 2,532.69. This would require a strong overshoot or breach of the 200 day moving average, which looks unlikely but does have precedent in this bull market.
Minute wave b may make a new high above the start of minute wave a if minor wave Y is an expanded flat. There is no maximum length for minute wave b, but there is a convention within Elliott wave that states when minute wave b is longer than twice the length of minute wave a the idea of a flat correction continuing should be discarded based upon a very low probability. That price point would be at 3,050. However, if price makes a new all time high and upwards movement exhibits strength, then this idea would be discarded at that point. Minute wave b should exhibit obvious internal weakness, not strength.
DAILY CHART – FLAT
Click chart to enlarge.
Flat corrections are very common. The most common type of flat is an expanded flat. This would see minor wave B move above the start of minor wave A at 2,872.87.
Within a flat correction, minor wave B must retrace a minimum 0.9 length of minor wave A at 2,838.85. The most common length for minor wave B within a flat correction would be 1 to 1.38 times the length of minor wave A at 2,872.87 to 3,002.15. An expanded flat would see minor wave B 1.05 times the length of minor wave A or longer, at 2,889.89 or above. A target is today calculated for minor wave B to end, which would see it end within the common range.
Minor wave B may be a regular flat correction, and within it minute wave a may have been a single zigzag and minute wave b may have been a double zigzag. This has a very good fit.
At its end minor wave B should exhibit obvious weakness. If price makes a new all time high and exhibits strength, then this wave count should be discarded.
This wave count would require a very substantial breach of the 200 day moving average for the end of intermediate wave (4). This is possible but may be less likely than a smaller breach.
TECHNICAL ANALYSIS
WEEKLY CHART
Click chart to enlarge. Chart courtesy of StockCharts.com.
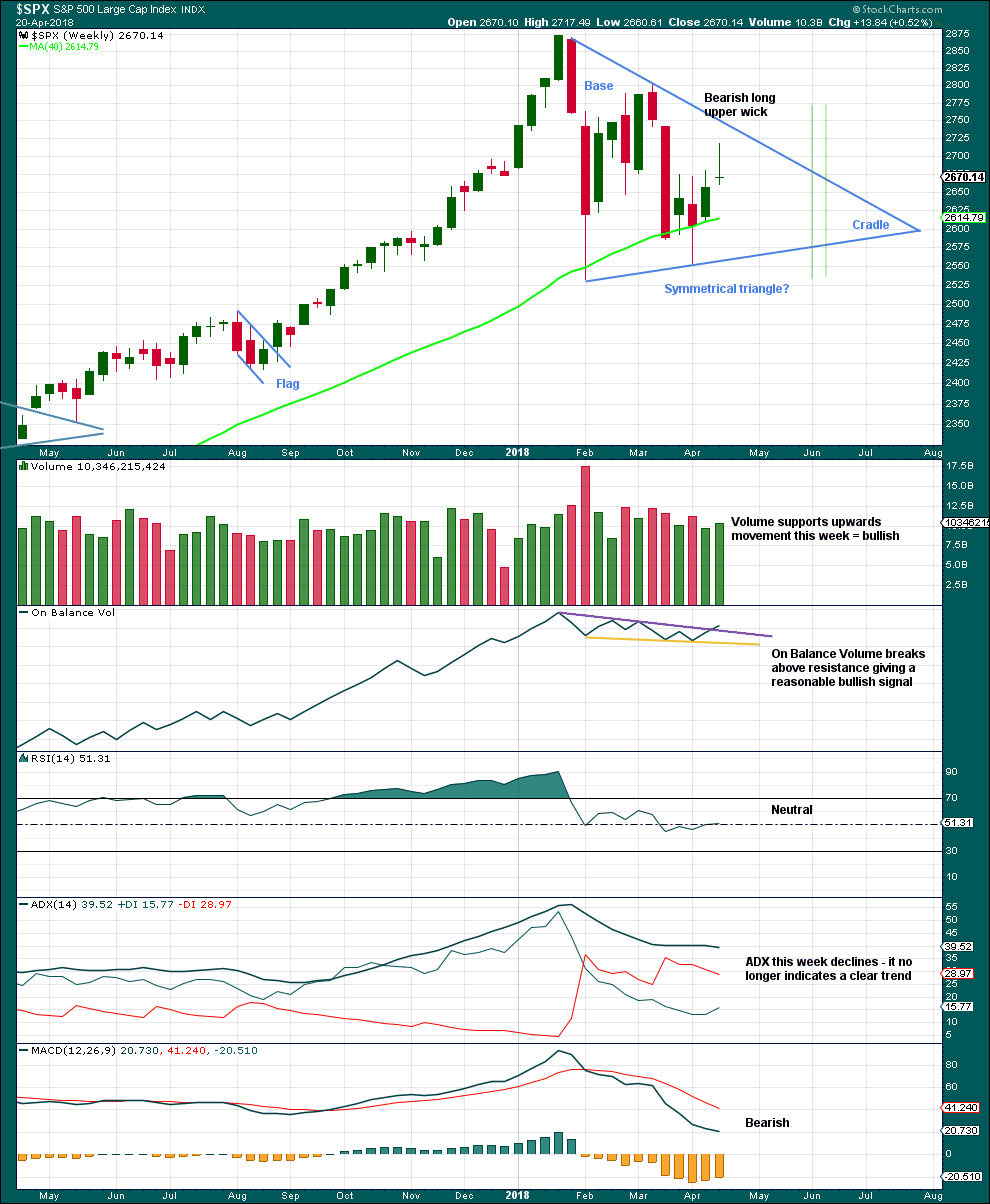
A classic symmetrical triangle pattern may be forming. These are different to Elliott wave triangles. Symmetrical triangles may be either continuation or reversal patterns, while Elliott wave triangles are always continuation patterns and have stricter rules.
The vertical green lines are 73% to 75% of the length of the triangle from cradle to base, where a breakout most commonly occurs.
From Dhalquist and Kirkpatrick on trading triangles:
“The ideal situation for trading triangles is a definite breakout, a high trading range within the triangle, an upward-sloping volume trend during the formation of the triangle, and especially a gap on the breakout.”
For this example, the breakout has not yet happened. There is a high trading range within the triangle, but volume is declining.
The triangle may yet have another 7 – 8 weeks if it breaks out at the green lines.
On Balance Volume gives a reasonable bullish signal last week with a breakout from a small range, above resistance. The signal is neither strong nor weak. The trend line broken has a shallow slope, is somewhat long held, and has been tested three or four times before.
A bullish signal from On Balance Volume and support last week for upwards movement offer good support to the main Elliott wave count. The bearish long upper wick though suggests a pullback for the short term, which is also what the main Elliott wave count expects.
DAILY CHART
Click chart to enlarge. Chart courtesy of StockCharts.com.
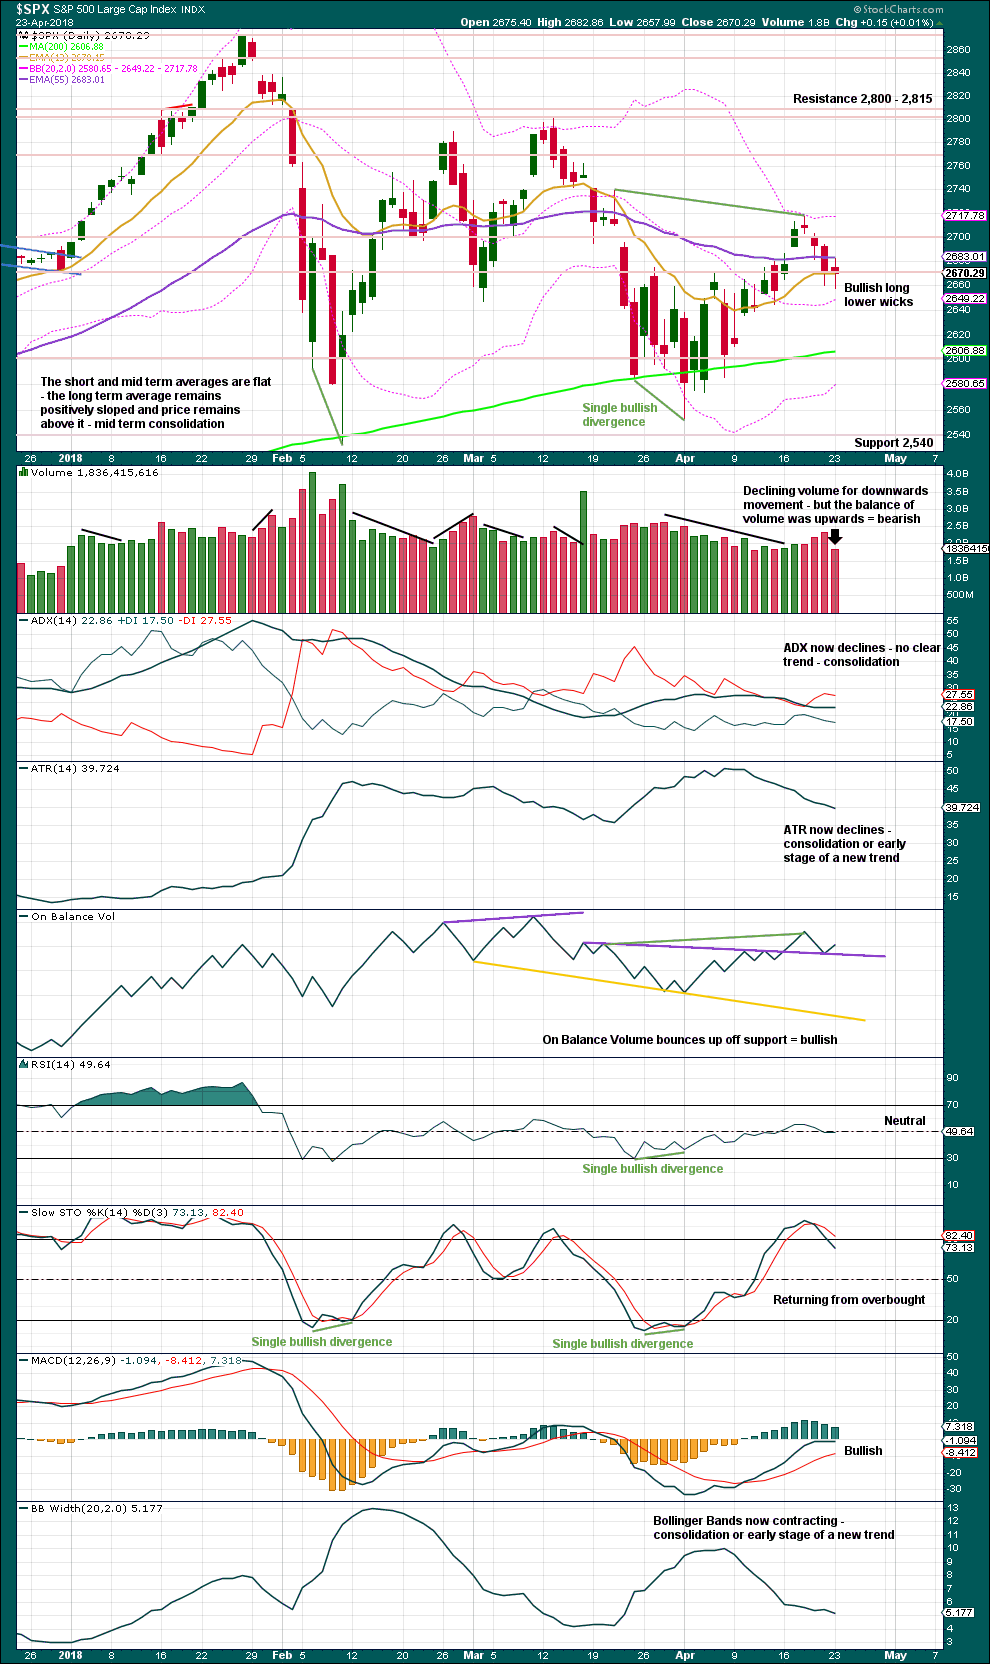
Now three long lower wicks and a bullish signal today from On Balance Volume support the idea of a bounce about here. This supports the Elliott wave count. Volume suggests it may be weak as there is little support for upwards movement and reasonable recent support for downwards movement.
VOLATILITY – INVERTED VIX CHART
Click chart to enlarge. Chart courtesy of StockCharts.com.
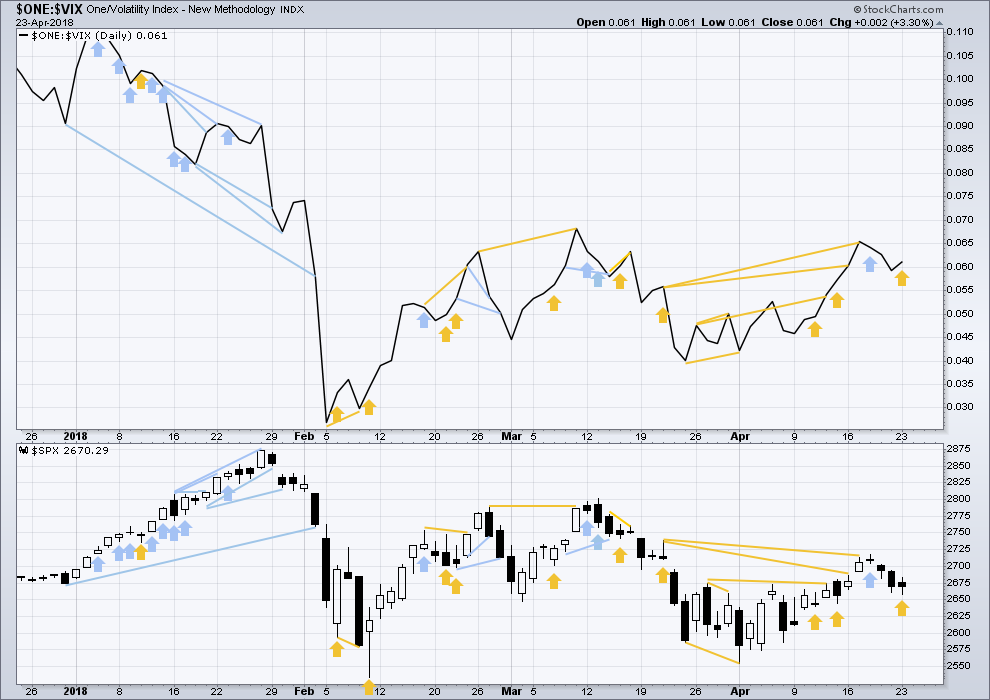
So that colour blind members are included, bearish signals will be noted with blue and bullish signals with yellow.
Normally, volatility should decline as price moves higher and increase as price moves lower. This means that normally inverted VIX should move in the same direction as price.
Price moved lower today, but inverted VIX moved higher. This divergence is bullish and supports the Elliott wave count.
BREADTH – AD LINE
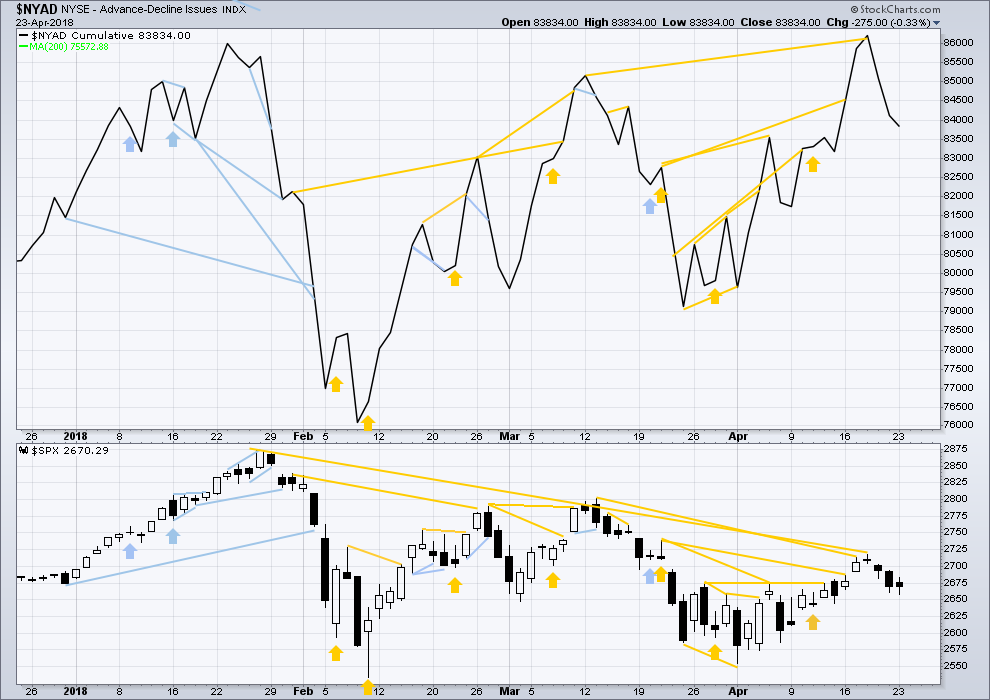
Click chart to enlarge. Chart courtesy of StockCharts.com.
There is normally 4-6 months divergence between price and market breadth prior to a full fledged bear market. This has been so for all major bear markets within the last 90 odd years. With no longer term divergence yet at this point, any decline in price should be expected to be a pullback within an ongoing bull market and not necessarily the start of a bear market. A new all time high from the AD line this week means that any bear market may now be an absolute minimum of 4 months away.
All of small, mid and large caps last week moved higher. There is no divergence to indicate underlying weakness. The small caps this week are rising faster than mid and large. Small caps made a slight new high above the prior swing high of the 13th of March. Small caps are very close to a new all time high.
Breadth should be read as a leading indicator.
The new all time high from the AD line remains very strongly bullish and supports the main Elliott wave count.This new all time high from the AD line will be given much weight in this analysis.
There has been a cluster of bullish signals from the AD line in the last few weeks. This also overall offers good support to the main Elliott wave count.
Price and the AD line moved lower today. The fall in price has support from falling market breadth. This is bearish. There is no divergence today.
DOW THEORY
The following lows need to be exceeded for Dow Theory to confirm the end of the bull market and a change to a bear market:
DJIA: 23,360.29.
DJT: 9,806.79.
S&P500: 2,532.69.
Nasdaq: 6,630.67.
At this stage, only DJIA has made a new major swing low. DJT also needs to make a new major swing low for Dow Theory to indicate a switch from a bull market to a bear market. For an extended Dow Theory, which includes the S&P500 and Nasdaq, these two markets also need to make new major swing lows.
Charts showing each prior major swing low used for Dow Theory may be seen at the end of this analysis here.
Published @ 08:09 p.m. EST.
When you have headlines like this, the bottom is either in or not too far away:
“Investors Just Gave up on the Bull Market.”
From the article: “April’s Conference Board survey capped three months of deteriorating sentiment toward the stock market, with the latest reading pushing the slide to the biggest since the period ended August 2011. That was the height of the debt-ceiling drama…”
https://www.bloomberg.com/news/articles/2018-04-24/americans-see-stocks-lower-in-a-year-bulls-see-a-time-to-buy
There may be more downside as this day is closing out as well as for tomorrow’s open. Be that as it may, I have begun scaling in my long positions. Stop loss point does not need to be very far away.
As have I Rodney, as have I. I jumped on it at 2625. I’ll exit with the loss if/as fresh lows occur tomorrow, and try again at the next appropriate indication of a bottom (at yet larger size). It’s time to start trying as I view it. If it takes 2-3 shots…so be it.
2 ES contracts at 2623, similar exit strategy….
Probably one more low guys…the market makers like to ambush you eager beavers! hehe! 🙂
That’s my guess, too, Verne. I’m standing by to go long, but not quite yet. Two-minute chart this afternoon looks to me like there should be at least one more stab lower.
can you post your count? always learning….
I wish I could, Peter, but I’ve never figured out how to do that in a way that’s easy to post online. All I can say is that at lower timeframes this afternoon’s price action looks corrective to me, and not like the beginning of a new trend. Just my best guess…
Yep. Fortunately for me, I had a trailer load of bearish call spreads so I am already positioned for any upside the next day or two without loosing too much sleep about being early. Completion of a wave of this degree should also see some kind of VIX capitulation, so plenty of time to get in for a new impulse up…. 🙂
It’s possible that it’s over folks. It looks like this daily candlesticks is forming a long lower shadow, and if the current hourly chart closes green well into the real body of the last red hourly candlestick 2 hours ago, we shall have a Morning Doji Star reversal pattern on the hourly chart.
The low today is very close to the 200 day MA. And very close to the black trend line I have on the daily chart.
Now, it most certainly could move lower. The invalidation point must remain at 2,553.80.
But I have seen triangles come to a very quick conclusion before, I’ve been surprised by it. Let us not be surprised here, let us consider this possibility.
E waves do very often fall reasonably sort of the A-C trend line. This one looks so typical.
I will certainly await Lara’s update. But as of now at SPX 2628, I am thinking we may have seen the low for Minor E. It is possible to count a three wave pattern down from the top of Minor D at approx 2717. On the 5 minute chart it is possible to count 5 down from today’s high of minute b for the completion of minute c and thus, Minor E. Let’s see what our fearless leader thinks.
Yep. The slowing of momentum as we approached the 200 day was a dead giveaway. It is possible we may not tag it as expected. DJI 24K is an important pivot I am told.
Hi Verne
I would agree about the Dow 24k
Lets see if they close it above the 24k today.
They have already shown their hand! 🙂
Fearless? Yeah… nah.
Just focussing here on the technicals Sir.
We should get a long shadow tomorrow with a tag of the 200 day….”Should”….
We will probably get a heads up from futures as to where this is headed folk.
Mr. Market answers to no one but himself….have a great rest of the day everyone!
Wow, if Lara’s analysis is right and a bear market is still 4 months off, this looks like an outstanding buying opportunity. Looks like I was wise to close a few longs last week after all!
I see support around 2620-2610, and then another round at 2580. We shall see. If it doesn’t hold there, there’s no telling where the bottom may be.
I heard a rumor a few weeks back about DJI 24K that has to do with bankster frenzy buying, madness, and all things derivative. Let’s just say expect them to go bat guano trying to defend it… haha!
Just added more AG… last 15 min.
I thought about going long the VIX after the close yesterday. Could not pull the trigger.
I should have!
Certainly at the open…. I know Chris fired that bazooka! 🙂
Hope he got a good price near the open… it moved fast 1st 1/2 hour and last 1/2 hour pre-mkt.
It traded red for well into the open….I could not believe what I was seeing!
Down we go
Selling VIX 15 strike calls for quick double. Closing short 17 strike puts of 15/17 bull put credit spread. (triple).May roll full spread out another week depending on what transpires at 200 day….
VIX is giving away free money…lol! 🙂
I’m too dense to understand this hint……
Simple. The price action in futures meant VIX trading in the red at the open was free money – calls, put spreads, whatever your preferred vehicle should have returned an effortless double. Are we looking at the same market people??!! 🙂
We are. Just some here aren’t au fait with the vehicles you use.
Long, short; buy, sell. That’s easy. Spreads and options are another game.
There’s lots of folks coming and going through this membership who aren’t experienced traders and may not understand how you do what you do. Not saying Peter S that you don’t understand, only that others may not.
I am here to learn….. and yeah I don’t know squat, yet
Don’t worry Peter, I’m still learning too. Every day.
We can all learn from each other here. That’s one of the most awesome things about this membership and the comments daily.
Google is my friend too
The next key market event is the price action around the 200 day SMA.
Perhaps. Though NDX has a significant divergence in price and stochasticRSI right now, indicating a possible bottom. And in SPX my hourly is actually in a “buy” mode off yesterday’s final hour, and today the action so far is only “up” from there. So I’m still suspicious that Lara’s short term B or X wave targets might get hit before the E wave continues.
Could be. Maybe a c move up of the b wave getting us to 2695. If we move below yesterday’s low will this be invalidated? Lara’s work detailing the AD line making new highs has the bear in me wanting to go hibernate after this move down. I am also concerned about a midterm election ramp job. That might end wave 5 up and the bull but that is a way off, got to keep short term and take it day by day.
It took me a few years to figure it out, but if you want to stop leaving a lot of money on the table, pay attention to Lara’s price targets. It is one of the most valuable pieces of info her analysis provides.
so are we still heading to 2694 before the 200 SMA?
extremely unlikely I’d say! The 200 sma is getting quite close now…
The next important event is a test of the 200 day…focus there….
Rat-a-tat-a-tat-a-tat!!! Awesome head fake to the upside to open. Then…the big money selling it hard, to drive profits on all the short positions they’ve quietly accumulated. The big long set up is getting closer….all those shorts will be buying back big time at the 200 sma/lower triangle line.
In the shorter term, SPX price approaching a 50% fibo and two symmetric projections, 2630-35. Could turn price for a bit.
nope, right through those levels. Next up is a bunch of fibo’s including a 62% and of course right there…the daily 200 sma! Also a lower 21 period keltner channel. All in the 2606-2615 range. I think that area will “satisfy” re: a completed E, but there’s plenty more room for it to rumble down and still be in a legitimate triangle. Of course, there’s the massive down channel lines WAY down there around 2440 waiting for it too…should the bottom REALLY fall out. Anything is possible here.
🙂
Enuf relaxin’!!! Time to get to woork, wabbit!
So, it appears both you guys are Loony Tunes! I knew it. I knew it.
Working hard enough for ya Doc? 🙂