
A new low below 2,671.17 indicated a deeper pullback was underway.
Summary: A pullback may continue towards 2,587 – 2,578. There should be a bounce for a B wave on the way down that may turn up Monday or Tuesday. When this pullback is done, then a new bull run to new all time highs may begin. At its end this pullback may offer an excellent entry opportunity to a long term position.
Always practice good risk management. Always trade with stops and invest only 1-5% of equity on any one trade.
New updates to this analysis are in bold.
The biggest picture, Grand Super Cycle analysis, is here.
Last historic analysis with monthly charts is here. Video is here.
An alternate idea at the monthly chart level is given here at the end of this analysis.
An historic example of a cycle degree fifth wave is given at the end of the analysis here.
MAIN ELLIOTT WAVE COUNT
WEEKLY CHART
Click chart to enlarge.
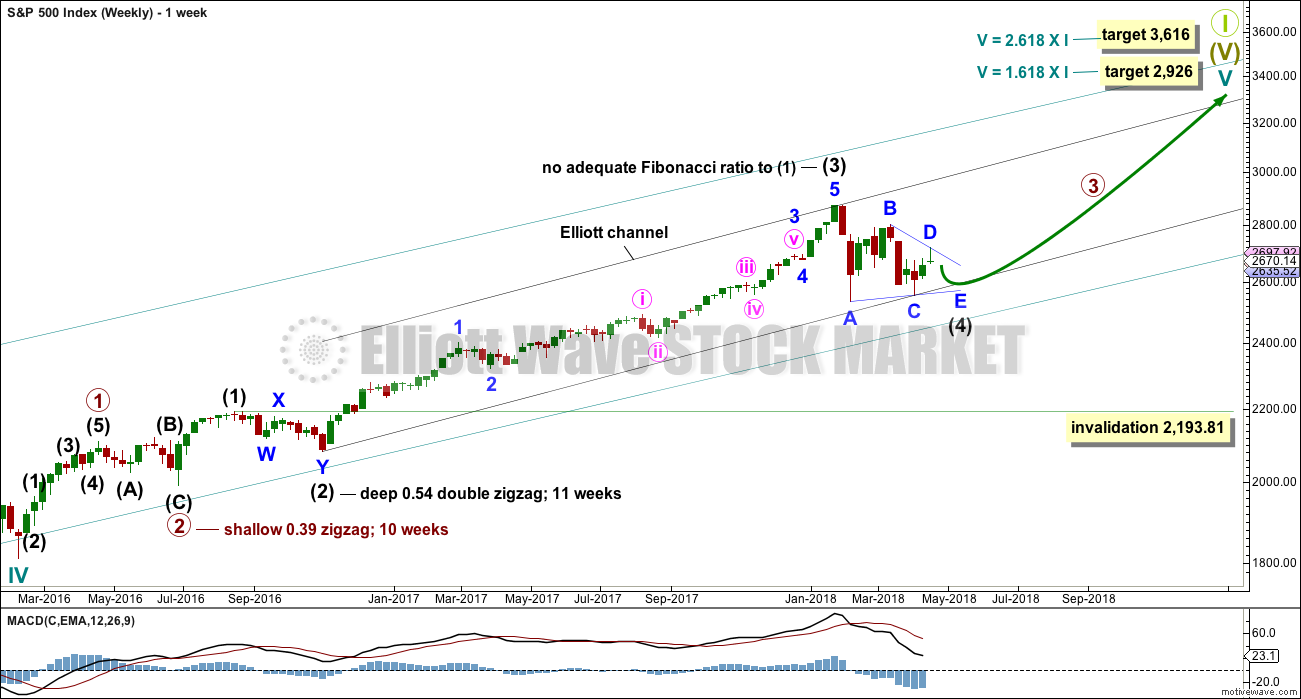
Cycle wave V must complete as a five structure, which should look clear at the weekly chart level. It may only be an impulse or ending diagonal. At this stage, it is clear it is an impulse.
Within cycle wave V, the third waves at all degrees may only subdivide as impulses.
Intermediate wave (4) has breached an Elliott channel drawn using Elliott’s first technique. The channel is redrawn using Elliott’s second technique with a slight adjustment. The upper edge may provide resistance for intermediate wave (5).
Intermediate wave (4) may not move into intermediate wave (1) price territory below 2,193.81. However, it would be extremely likely to remain within the wider teal channel (copied over from the monthly chart) if it were to be reasonably deep. This channel contains the entire bull market since the low in March 2009, with only two small overshoots at the end of cycle wave IV. If this channel is breached, then the idea of cycle wave V continuing higher would be discarded well before the invalidation point is breached.
If intermediate wave (4) now continues for one more week, it may end in a total Fibonacci thirteen weeks.
At this stage, there are still three possible structures for intermediate wave (4): a triangle, a combination, and a flat correction. All three will be published. The triangle is preferred because that would see price continue to find support about the 200 day moving average. While this average continues to provide support, it is reasonable to expect it to continue (until it is clearly breached).
DAILY CHART
Click chart to enlarge.
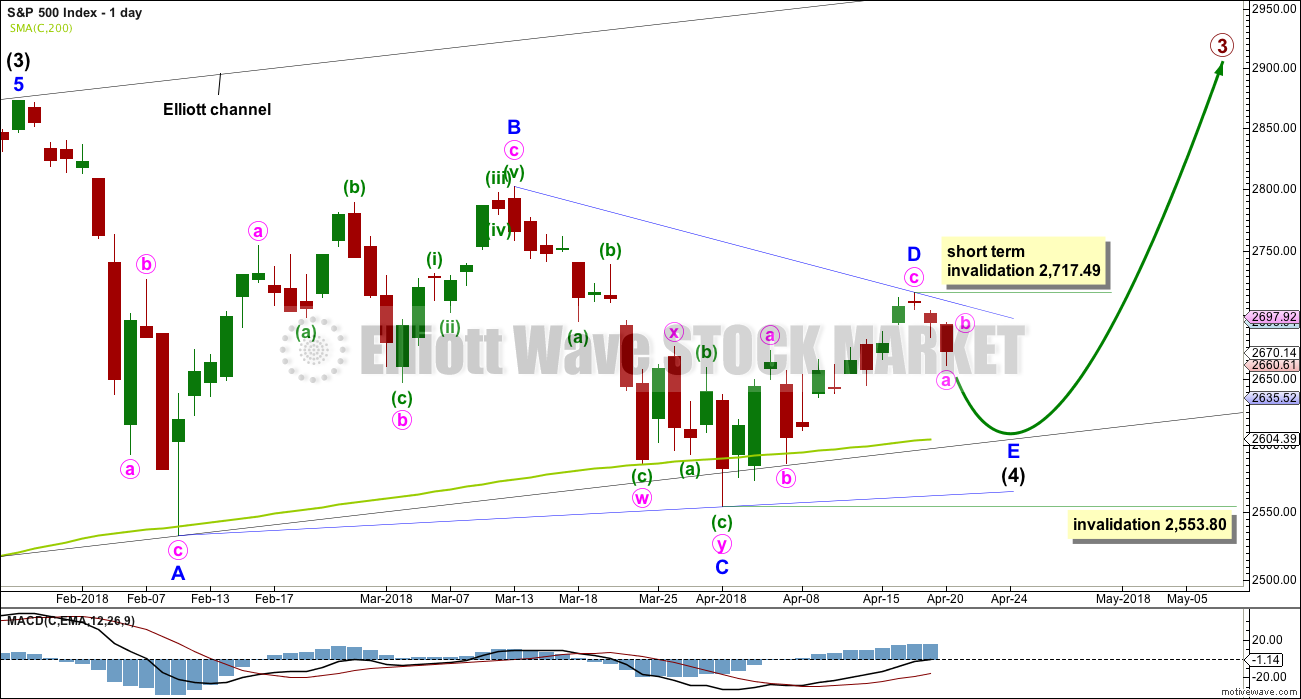
Intermediate wave (4) will again be labelled as an incomplete regular contracting triangle. The final sub-wave of minor wave E downwards may be unfolding, which may not move in a straight line. Look for a bounce within minor wave E for minute wave b. Minor wave E may last a few days and would most likely fall short of the A-C trend line. This may see it find support about the 200 day moving average. If it does not end there, then the next most likely place for it to end would be with a small overshoot of the A-C trend line.
When intermediate wave (4) could be labelled as a complete triangle, then a new bull run to new all time highs would be expected. Intermediate wave (5) may be expected to make a new high above the end of intermediate wave (3) to avoid a truncation. When the end of intermediate wave (4) and the start of intermediate wave (5) is known, then a target for intermediate wave (5) to end may be calculated. That cannot be done yet.
Within minor wave E, minute wave b may not move beyond the start of minute wave a above 2,717.49.
Minor wave E may not move beyond the end of minor wave C below 2,553.80.
HOURLY CHART
Click chart to enlarge.
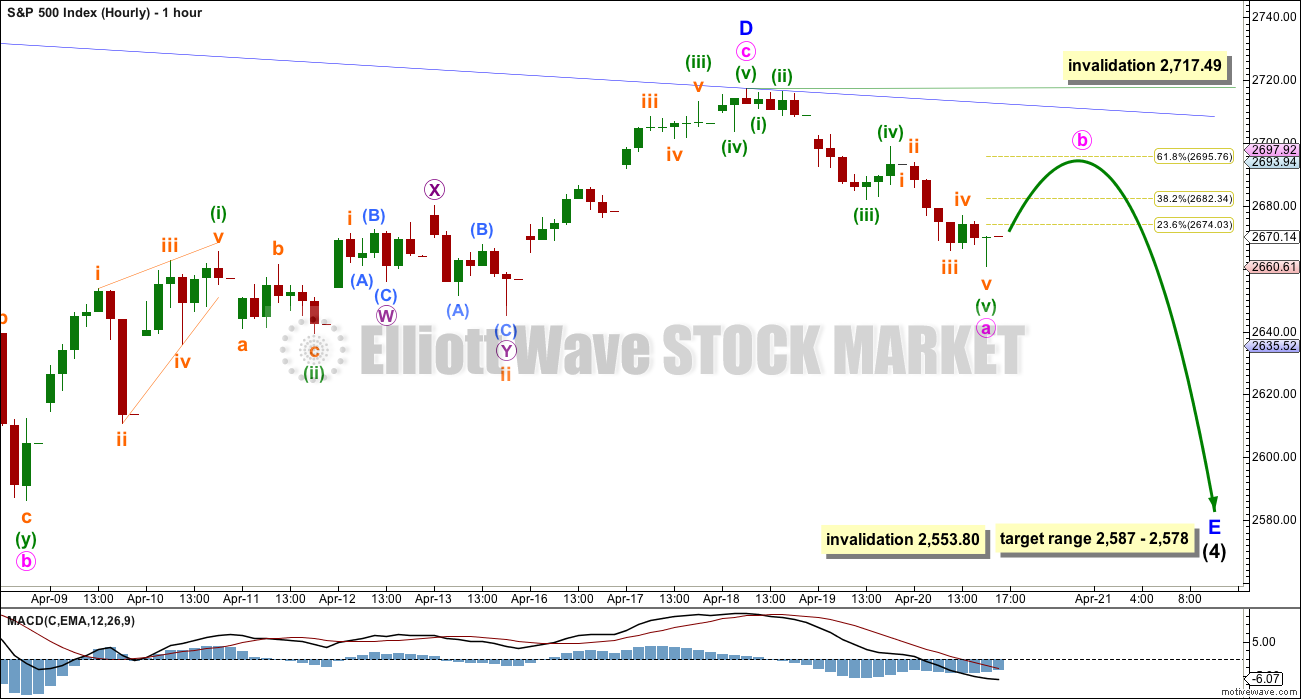
Minor wave E should subdivide as a zigzag. The most common length for triangle sub-waves, in my experience, is from 0.8 to 0.85 the length of the prior sub-wave. This gives a target range for minor wave E to end from 2,587 to 2,578.
Within the zigzag of minor wave E, when minute waves a and b are complete, a target for minute wave c may be calculated using the Fibonacci ratio between minute waves a and c. That cannot be done yet.
It is possible that a five down may be complete at Friday’s low, which may be minute wave a. It is also possible that subminuette wave v may extend lower before minute wave a is complete.
If minute wave a is complete at Friday’s low, then minute wave b may bounce to about either of the the 0.382 or 0.618 Fibonacci ratios. If minute wave b is very deep, then it should find very strong resistance at the upper triangle B-D trend line. Triangles normally adhere very well to their trend lines, so that line should not be breached (and is highly unlikely to even be overshot) while the triangle is incomplete.
ALTERNATE WAVE COUNTS
DAILY CHART – COMBINATION
Click chart to enlarge.
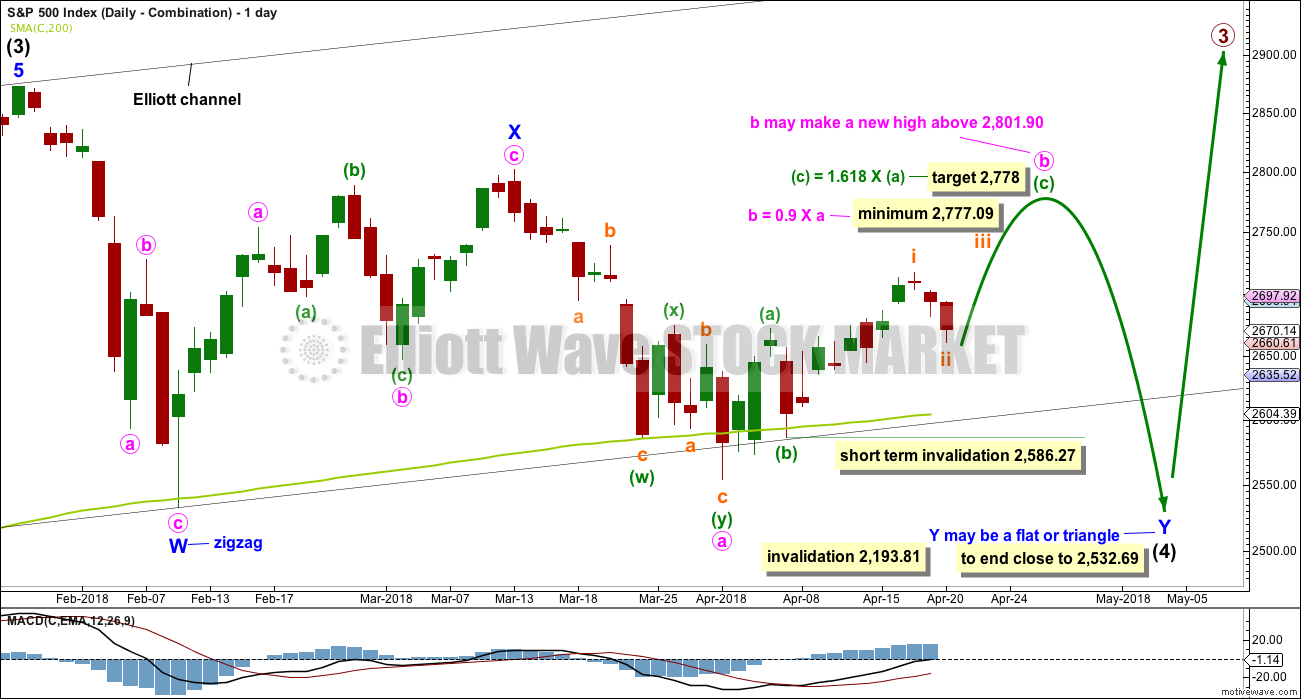
Double combinations are very common structures. The first structure in a possible double combination for intermediate wave (4) would be a complete zigzag labelled minor wave W. The double should be joined by a three in the opposite direction labelled minor wave X, which may be a complete zigzag. X waves within combinations are typically very deep; if minor wave X is over at the last high, then it would be a 0.79 length of minor wave W, which is fairly deep giving it a normal look. There is no minimum nor maximum requirement for X waves within combinations.
The second structure in the double would most likely be a flat correction labelled minor wave Y. It may also be a triangle, but in my experience this is very rare, so it will not be expected. The much more common flat for minor wave Y will be charted and expected.
A flat correction would subdivide 3-3-5. Minute wave a must be a three wave structure, most likely a zigzag. It may also be a double zigzag.
Minute wave b must now reach a minimum 0.90 length of minute wave a. Minute wave b must be a corrective structure. It may be any corrective structure. It may be unfolding as a zigzag. A target is calculated for it to end. Within minuette wave (c), subminuette wave ii may not move beyond the start of subminuette wave i below 2,586.27.
The purpose of combinations is to take up time and move price sideways. To achieve this purpose the second structure in the double usually ends close to the same level as the first. Minor wave Y would be expected to end about the same level as minor wave W at 2,532.69. This would require a strong overshoot or breach of the 200 day moving average, which looks unlikely but does have precedent in this bull market.
Minute wave b may make a new high above the start of minute wave a if minor wave Y is an expanded flat. There is no maximum length for minute wave b, but there is a convention within Elliott wave that states when minute wave b is longer than twice the length of minute wave a the idea of a flat correction continuing should be discarded based upon a very low probability. That price point would be at 3,050. However, if price makes a new all time high and upwards movement exhibits strength, then this idea would be discarded at that point. Minute wave b should exhibit obvious internal weakness, not strength.
DAILY CHART – FLAT
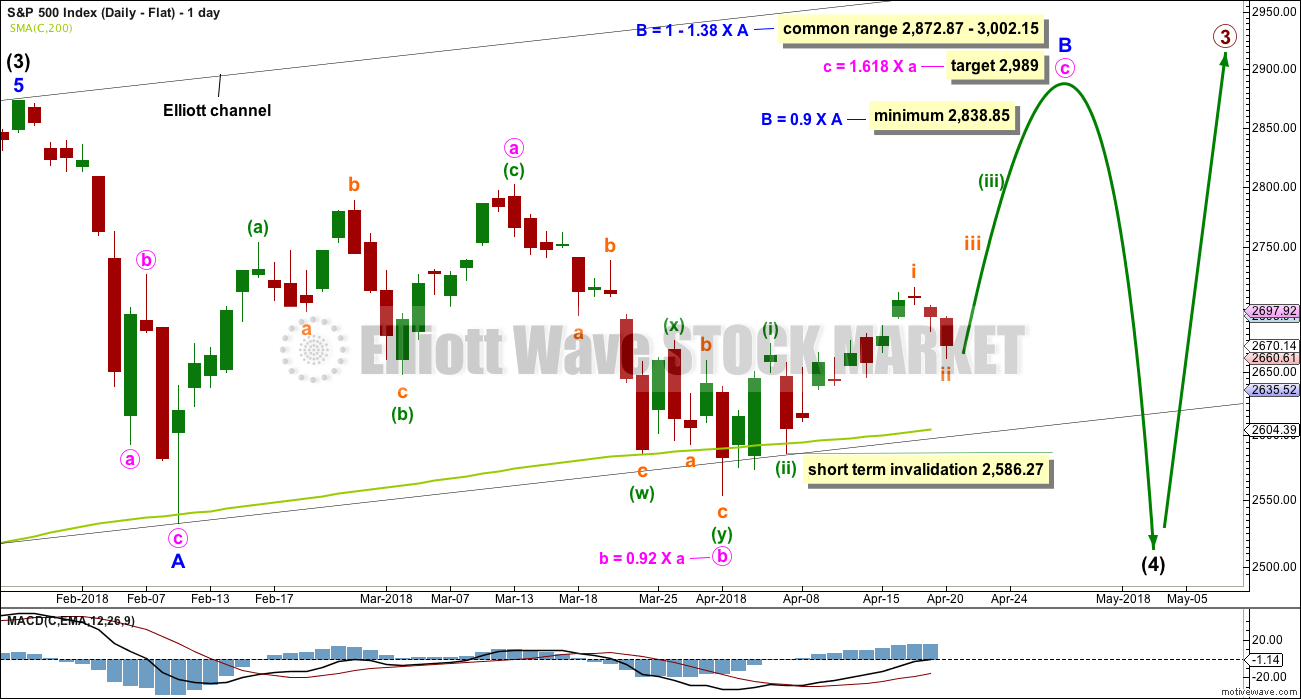
Click chart to enlarge.
Flat corrections are very common. The most common type of flat is an expanded flat. This would see minor wave B move above the start of minor wave A at 2,872.87.
Within a flat correction, minor wave B must retrace a minimum 0.9 length of minor wave A at 2,838.85. The most common length for minor wave B within a flat correction would be 1 to 1.38 times the length of minor wave A at 2,872.87 to 3,002.15. An expanded flat would see minor wave B 1.05 times the length of minor wave A or longer, at 2,889.89 or above. A target is today calculated for minor wave B to end, which would see it end within the common range.
Minor wave B may be a regular flat correction, and within it minute wave a may have been a single zigzag and minute wave b may have been a double zigzag. This has a very good fit.
At its end minor wave B should exhibit obvious weakness. If price makes a new all time high and exhibits strength, then this wave count should be discarded.
This wave count would require a very substantial breach of the 200 day moving average for the end of intermediate wave (4). This is possible but may be less likely than a smaller breach.
TECHNICAL ANALYSIS
WEEKLY CHART
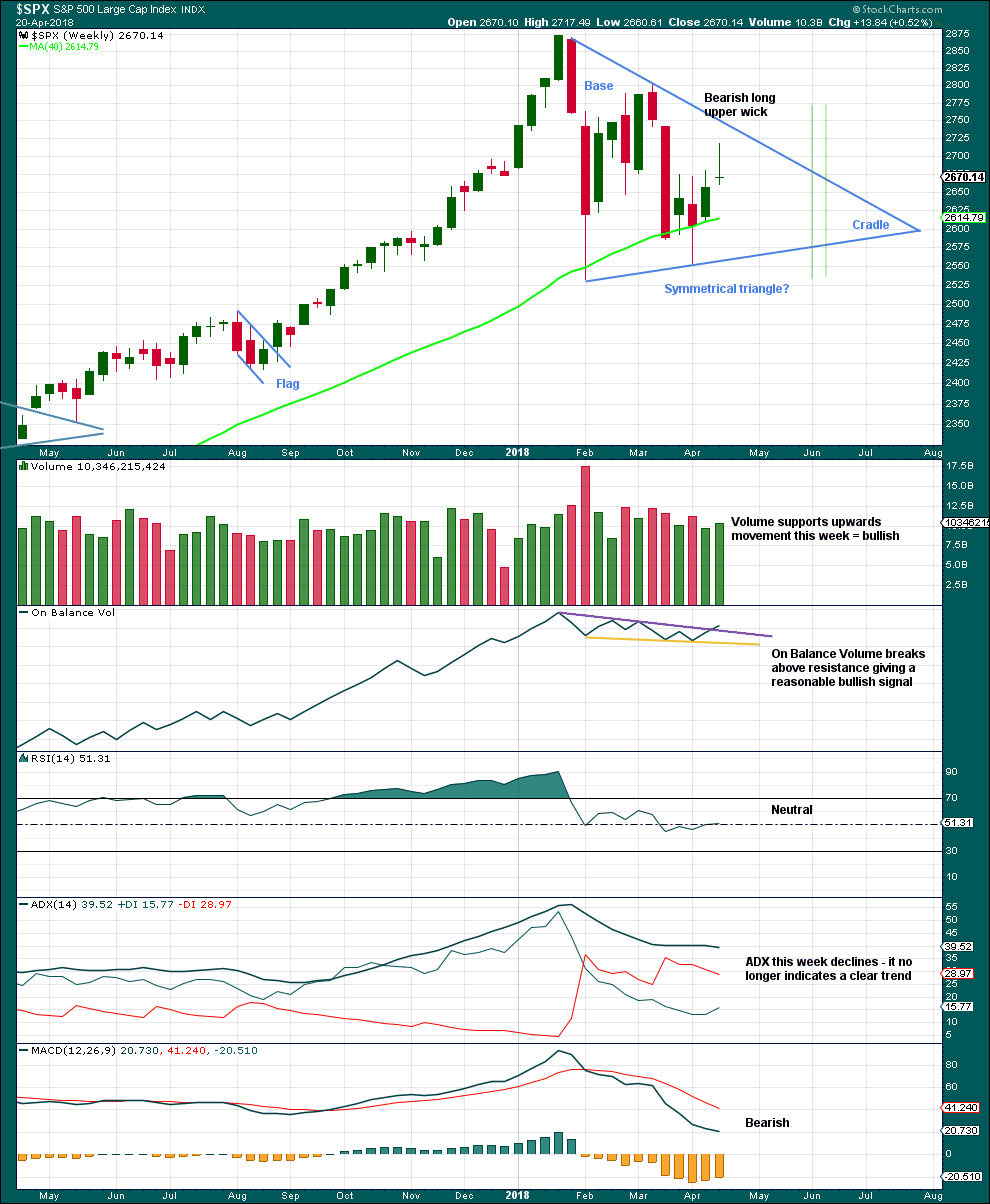
Click chart to enlarge. Chart courtesy of StockCharts.com.
A classic symmetrical triangle pattern may be forming. These are different to Elliott wave triangles. Symmetrical triangles may be either continuation or reversal patterns, while Elliott wave triangles are always continuation patterns and have stricter rules.
The vertical green lines are 73% to 75% of the length of the triangle from cradle to base, where a breakout most commonly occurs.
From Dhalquist and Kirkpatrick on trading triangles:
“The ideal situation for trading triangles is a definite breakout, a high trading range within the triangle, an upward-sloping volume trend during the formation of the triangle, and especially a gap on the breakout.”
For this example, the breakout has not yet happened. There is a high trading range within the triangle, but volume is declining.
The triangle may yet have another 8 – 9 weeks if it breaks out at the green lines.
On Balance Volume gives a reasonable bullish signal this week with a breakout from a small range, above resistance. The signal is neither strong nor weak. The trend line broken has a shallow slope, is somewhat long held, and has been tested three or four times before.
A bullish signal from On Balance Volume and support this week for upwards movement offer good support to the main Elliott wave count. The bearish long upper wick though suggests a pullback for the short term, which is also what the main Elliott wave count expects.
DAILY CHART
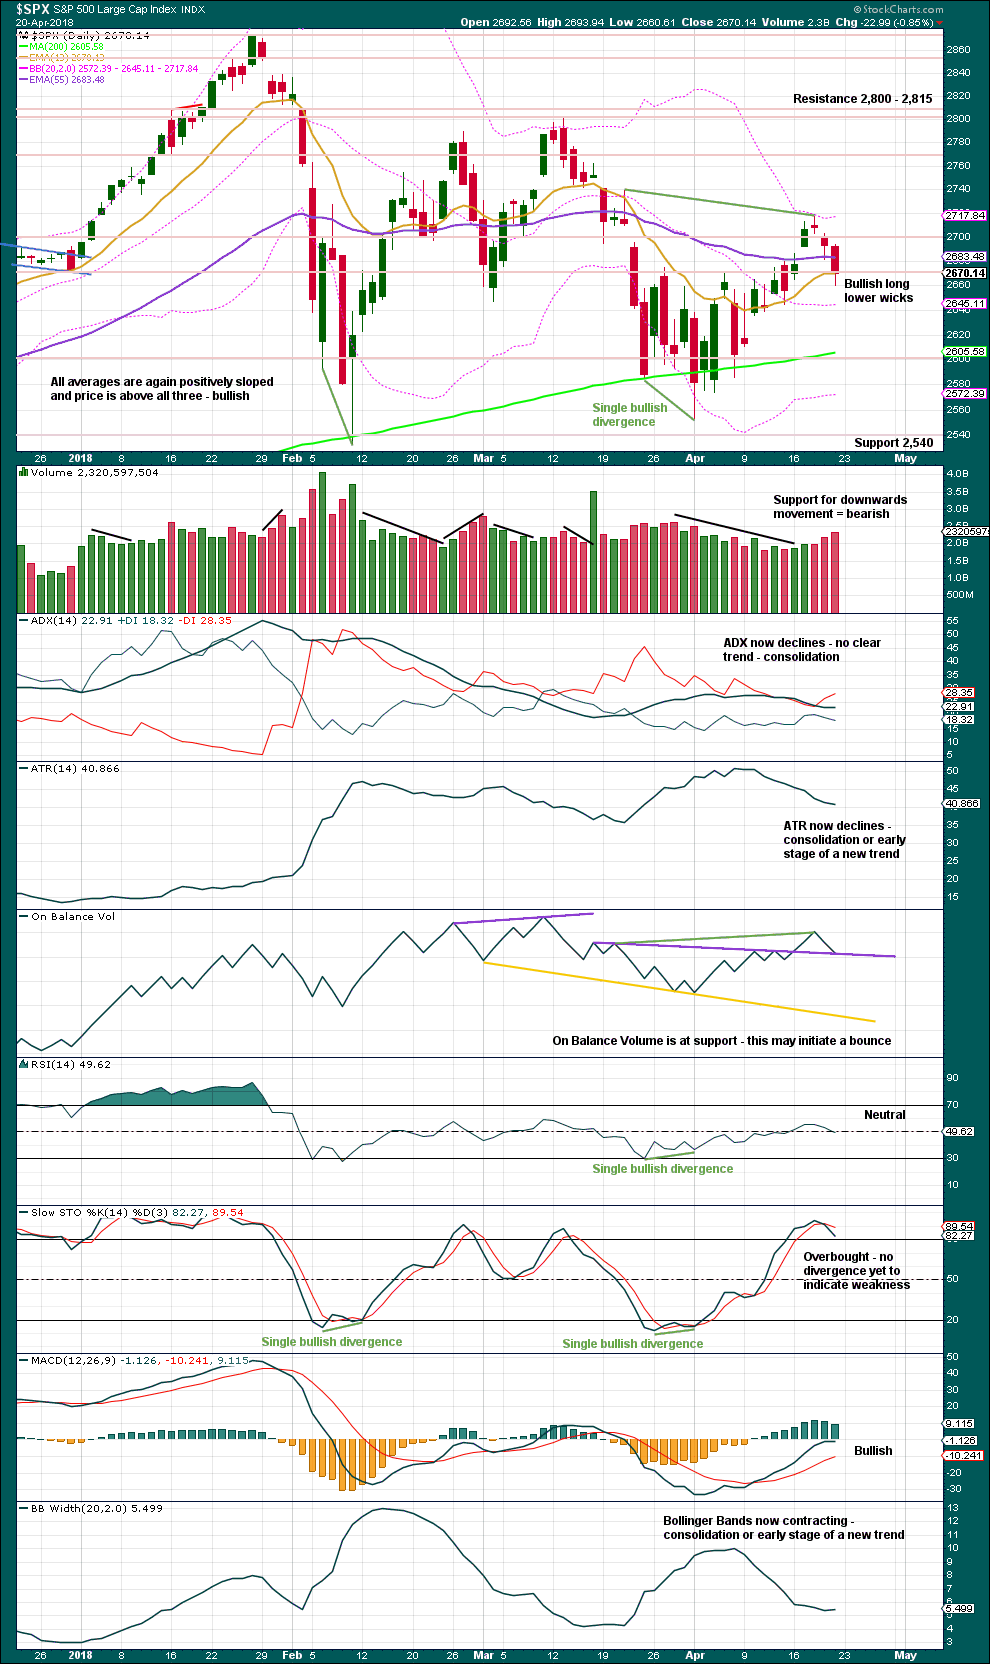
Click chart to enlarge. Chart courtesy of StockCharts.com.
Long lower wicks and support from On Balance Volume suggest a bounce Monday / Tuesday. Support from volume for downwards movement though contradicts this view.
VOLATILITY – INVERTED VIX CHART
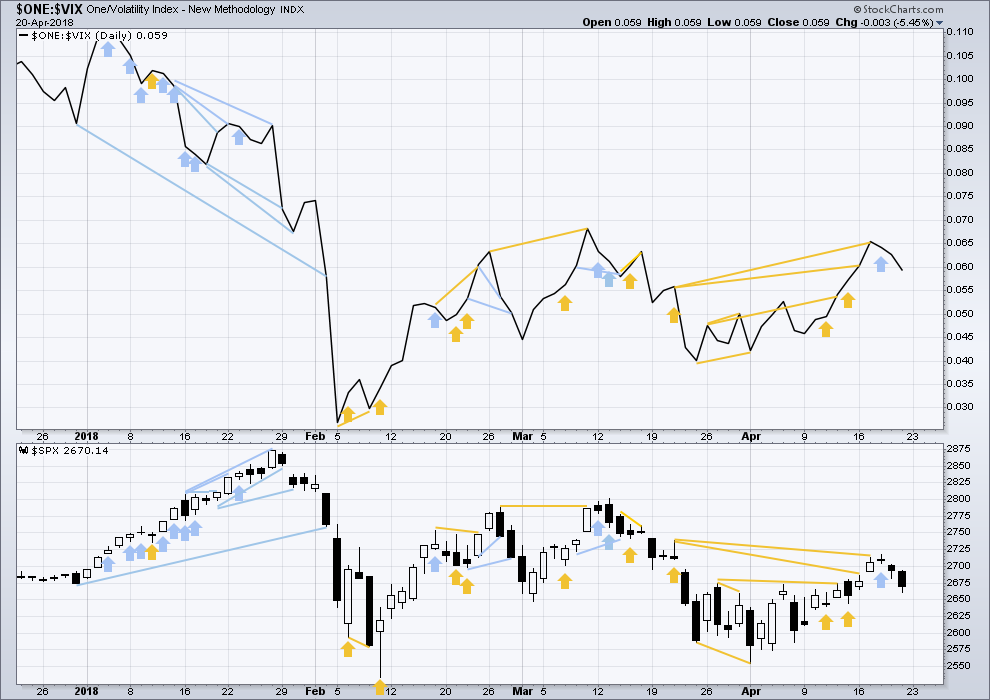
Click chart to enlarge. Chart courtesy of StockCharts.com.
So that colour blind members are included, bearish signals will be noted with blue and bullish signals with yellow.
Normally, volatility should decline as price moves higher and increase as price moves lower. This means that normally inverted VIX should move in the same direction as price.
There is no new divergence today between price and inverted VIX.
BREADTH – AD LINE
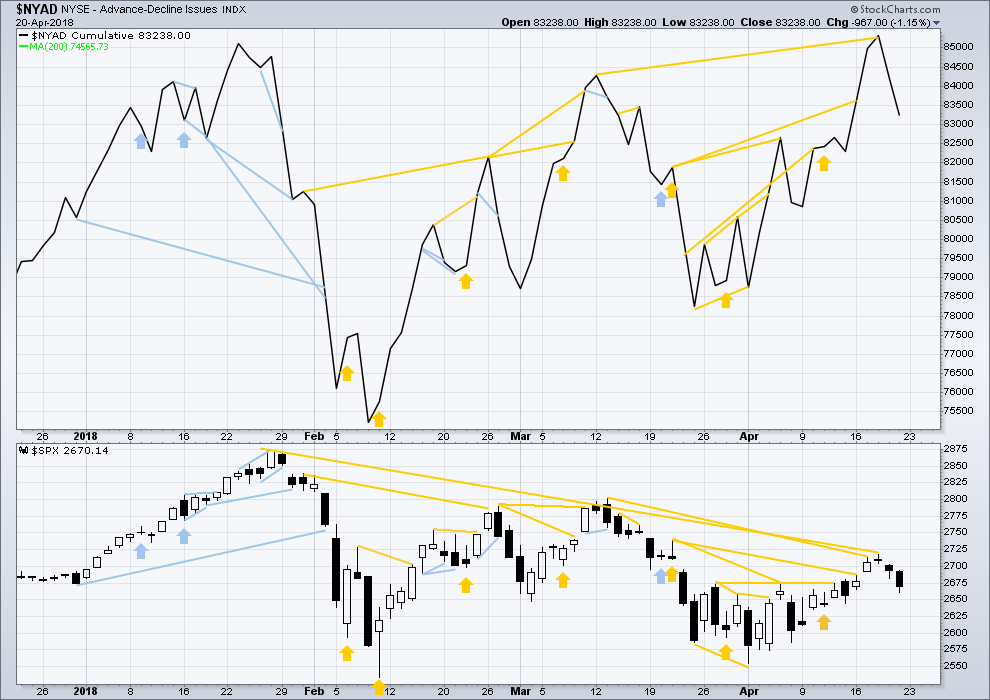
Click chart to enlarge. Chart courtesy of StockCharts.com.
There is normally 4-6 months divergence between price and market breadth prior to a full fledged bear market. This has been so for all major bear markets within the last 90 odd years. With no longer term divergence yet at this point, any decline in price should be expected to be a pullback within an ongoing bull market and not necessarily the start of a bear market. A new all time high from the AD line this week means that any bear market may now be an absolute minimum of 4 months away.
All of small, mid and large caps last week moved higher. There is no divergence to indicate underlying weakness. The small caps this week are rising faster than mid and large. Small caps made a slight new high above the prior swing high of the 13th of March. Small caps are very close to a new all time high.
Breadth should be read as a leading indicator.
The new all time high from the AD line remains very strongly bullish and supports the main Elliott wave count. This new all time high from the AD line will be given much weight in this analysis.
There has been a cluster of bullish signals from the AD line in the last few weeks. This also overall offers good support to the main Elliott wave count.
For the short term though, downwards movement from price over the last two days has good support from declining market breadth. This is bearish.
DOW THEORY
The following lows need to be exceeded for Dow Theory to confirm the end of the bull market and a change to a bear market:
DJIA: 23,360.29.
DJT: 9,806.79.
S&P500: 2,532.69.
Nasdaq: 6,630.67.
At this stage, only DJIA has made a new major swing low. DJT also needs to make a new major swing low for Dow Theory to indicate a switch from a bull market to a bear market. For an extended Dow Theory, which includes the S&P500 and Nasdaq, these two markets also need to make new major swing lows.
Charts showing each prior major swing low used for Dow Theory may be seen at the end of this analysis here.
Published @ 01:40 a.m. EST on 21st April, 2018.
While it’s possible minute b was over at today’s high, that would be rather brief. The wave count would have better proportion if it were to continue.
So far within it minuette (b) is 1.11 X minuette (a), so minute b may be an expanded flat. Very common structures.
The most common Fibonacci ratio of minuette (c) = 1.618 X minuette (a) yields a target at 2,694, which is just below the 0.618 Fibonacci ratio of minute a at 2,696.
So that’s the target for a bounce: 2,694 – 2,696
Went long SPY on 30 min at gap fill, 200m and trendline from 4/2, 4/6 today. Will close out if SPY closes below 265.
DJT has quietly made a new closing low below the Feb 9 close on April 9, exactly two months later. What is absolutely fascinating is that you can scour the web all you want and virtually no one is talking about this major development. Why the crickets? 🙂
? I’m not seeing that at all?
AFAIK DJT remains above it’s important Feb 9 low
the April 6 low was much higher
That was my first reaction when the guys at Artemis drew it to my attention. Key is CLOSING low. 🙂
but the closing low for 6th April was way above both the low and close of 9th February?
so this “DJT has quietly made a new closing low below the Feb 9 close on April 9” makes no sense?
Yeah closed 2/9 at 10,136 and 4/9 at 10,119
OMG you’re right
*embarrassed*
yes, it did make a close below the prior close
Don’t feel bad. As I said, exactly my first reaction. No wonder we all missed it….very subtle indeed! Those guys are quants and don’t miss much. I had an email all ready to point out their error and…oopsie! 🙂
LOL
brilliant that you didn’t click “send” on that email then!
looks like a triangle forming before we head down.
I count a 1 and 2 down completed off the most recent high…. anyone?
and now a 3 and a 4…
Does anyone have an opinion or comment about the commitment of traders report on the ES (SPX futures…). The commercials have accumulated a record net short position over the last few weeks…
In of itself it’s not a good predictor of future market performance … but I do think it is interesting when it was brought to my attention.
Speaks to the power of the motive wave up that eventually will launch off the end of this bit intermediate 4!! Sooner or later, it’s coming. Today is interesting. The high is exactly the bullish symmetry size of Friday’s down move, indicating that the downmove is not yet over. And now a little battle as to whether that was enough up before the selling gets seriously rolling again, or whether a higher headfake is necessary. I already entered and took profits on my first SPX short, holding a tad still, would like to get bigger at a higher price on a clean turn at a fibo band area with sell triggers. I also grabbed a long profit or two soon after open (GBTC and MRK). Lastly, I continue to build and trade TBT, which over time appears it just might go to the moon.
It is entirely possible that D is not done and in that case we take out the recent highs as D extends higher broadening the triangle a bit. If we head up on Monday I will assume that is what we have unfolding and we will get yet another headfake jump above the 50 day and won’t THAT be loverly! If that happens I expect we will again see negative divergences as price heads up, giving a great set-up to ride E down. I realise a smaller bounce could be a b bounce of E. Either way, I am expecting if E is underway it completes by session’s end. A sharp bounce off the 200 day would be a great signal. E waves tend to complete with a signature rapidity that will leave you in the dust if you are not paying attention.
E’s completion should take us through the top of the top of the BD trendline intraday to confirm we are done.
Some levels I’ll be watching for turns and triggers off of on Monday (on the SPY daily). Fibo retrace levels, the prior resistance zone now functioning as a support zone, fibo fan lines, and three different symmetric projections. That results in three clusters, 2642-48 zone, 2625-28, and 2605-10. First price would have to break below the low of Friday. A move to the lower of these levels off the low of Friday would be a -1.9% move, pretty large for a 1-2 day move but quite common currently. Also note the stochasticRSI triggering short; a longer term views shows that signals bee quite good recent at the daily level. On the other hand, higher lows starting to form here would be pretty bullish for the intermediate term.
And, if the market should move UP instead of lower, I’ll be focused on the retrace upward on the hourly chart show to (a) try to reduce a long position or two, perhaps even with a small profit and (b) get a nice portfolio risk reduction/scalp the market short launched at a probability turning point. The first key level is the bullish symmetry of the downmove (large countertrend move so far). Then the fibo’s start appearing, and I’ve put in the recent move projections in white horizatonal lines. Then there’s the strong double top. There’s also the red fast descending keltner channel, it could intersect price right at a key fibo+projection zone of 2683-88 for a really strong potential turn zone.
So far SPY/SPX has tagged that first cluster (267.89 high in SPY). No real sell triggers though; I’m suspecting it’s going to move up to the next cluster, at least. The 269.19 cluster with the 62% fibo wouldn’t suprise me before a turn. It might be tomorrow though. Or who knows, maybe it’s done right here. The market will tell us.
Excellent analysis and commentary. 2900 SPX coming this summer to a theater near you.
Another t-shirt saying
” I’m just looking for the end of E.
What’s your problem?”
Have a great one Lara et al.
An Elliott Wave walks into a bar…
Bartender says “we don’t serve your type in here!”…
Elliott wave says “Watch it buddy, I’m the impulsive type by nature but if motivated I will get corrective on you.”
Bartender says “Alright, alright, calm down: now what’ll ya have?”
Elliott wave: (laughing) I’m mad now: give me a double combination!
ker-splash!!!
ROFL!
okay one little refinement and i promise never again:
An Elliott Wave walks into a bar…
Bartender says “we don’t serve you fractal types in here!”…
Elliott wave says “Watch it buddy, I’m impulsive by nature but if motivated I will get corrective on you.”
Bartender says “Alright, alright, calm down: now what’ll ya have?”
Elliott wave says (laughing) “I’m mad now: give me a double combination with two flats and a triangle!”
Now, back to something I’m better at….
I can’t believe I’m laughing at this! Lol…
ROTFL
That’s brilliant! Love it!