
Upwards movement was still expected.
There is today a new very important signal from the AD line, which prompts me to publish a new wave count. The expected direction is the same, but the target is new.
Summary: The target for a primary degree third wave to end is now at 2,913. This target may be reached in several weeks.
For the short term, any pullbacks may remain above 2,671.17. A low degree fourth wave may unfold tomorrow. If it does, then the target is either about 2,700 or 2,690; neither target may be favoured.
Always practice good risk management. Always trade with stops and invest only 1-5% of equity on any one trade.
New updates to this analysis are in bold.
The biggest picture, Grand Super Cycle analysis, is here.
Last historic analysis with monthly charts is here. Video is here.
An alternate idea at the monthly chart level is given here at the end of this analysis.
An historic example of a cycle degree fifth wave is given at the end of the analysis here.
MAIN ELLIOTT WAVE COUNT
WEEKLY CHART
Click chart to enlarge.
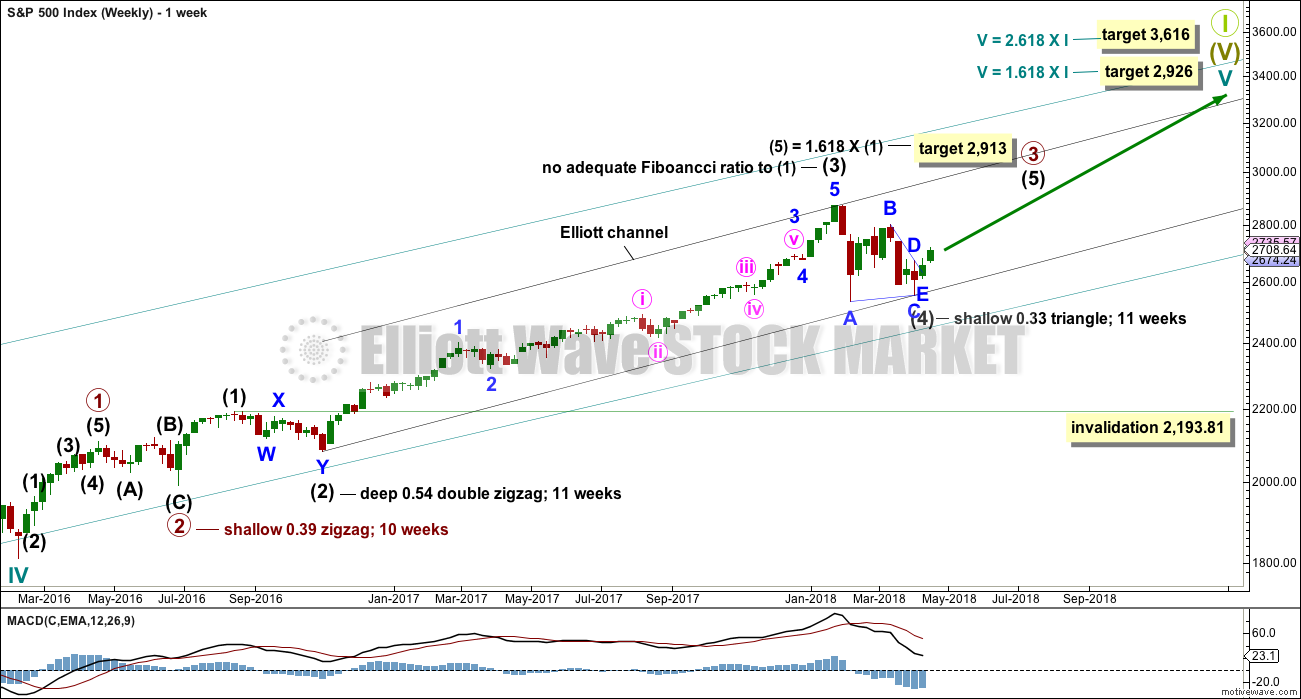
Cycle wave V must complete as a five structure, which should look clear at the weekly chart level. It may only be an impulse or ending diagonal. At this stage, it is clear it is an impulse.
Within cycle wave V, the third waves at all degrees may only subdivide as impulses.
Intermediate wave (4) has breached an Elliott channel drawn using Elliott’s first technique. The channel is redrawn using Elliott’s second technique with a slight adjustment. The upper edge may provide resistance for intermediate wave (5).
Intermediate wave (4) may not move into intermediate wave (1) price territory below 2,193.81. However, it would be extremely likely to remain within the wider teal channel (copied over from the monthly chart) if it were to be reasonably deep. This channel contains the entire bull market since the low in March 2009, with only two small overshoots at the end of cycle wave IV. If this channel is breached, then the idea of cycle wave V continuing higher would be discarded well before the invalidation point is breached.
Intermediate wave (4) will be labelled as a complete triangle today, lasting 11 weeks. If this labelling is correct, then there would be perfect proportion and perfect alternation between intermediate waves (2) and (4).
There is no adequate Fibonacci ratio between intermediate waves (3) and (1). This would make it more likely that intermediate wave (5) may exhibit a Fibonacci ratio to either of intermediate waves (3) or (1). The most common Fibonacci ratio for intermediate wave (5) would be equality in length with intermediate wave (1), but that would expect a truncation, which is unlikely. The next likely Fibonacci ratio in the sequence is used to calculate a target.
In terms of weeks none of intermediate waves (1), (2), (3) or (4) exhibit a Fibonacci duration. Intermediate wave (5) may also not exhibit a Fibonacci duration, which makes an estimate on how long it may last very difficult. It may be expected to last several weeks, at least 8.
DAILY CHART
Click chart to enlarge.
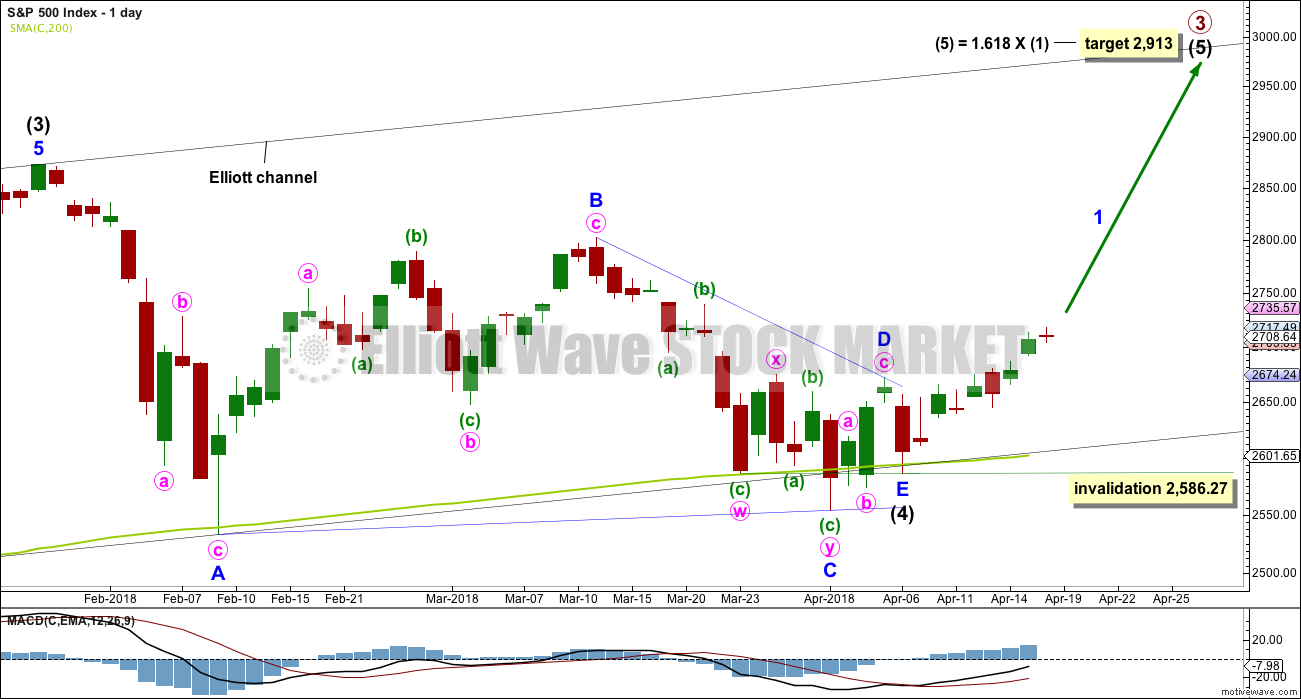
Intermediate wave (4) may be a complete regular contracting triangle, which may have come to a quicker than expected end nine sessions ago.
All sub-waves subdivide as single or multiple zigzags. Only one sub-wave is a more complicated multiple, which was minor wave C, which is the most common triangle sub-wave to subdivide as a multiple. Minor wave E falls well short of the A-C trend line, which is the most common way for triangles to end.
Intermediate wave (5) must subdivide as a five wave structure. It may only be an ending diagonal or an impulse. An impulse is much more common, so it will be expected until proven otherwise. Within both an impulse or diagonal, minor wave 2 may not move beyond the start of minor wave 1 below 2,586.27.
HOURLY CHART
Click chart to enlarge.
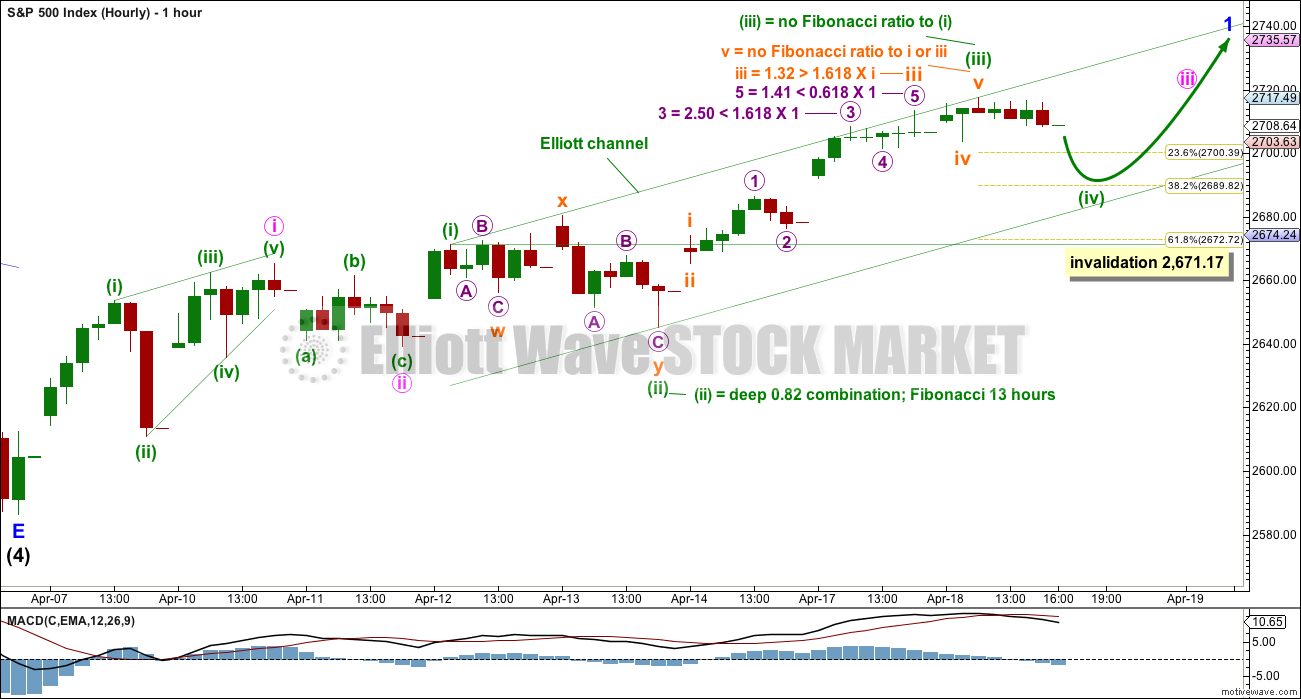
Within intermediate wave (5), minor wave 1 may be an incomplete impulse.
So far within minor wave 1, minute wave i fits as a leading contracting diagonal. This was followed by a shallow zigzag for minute wave ii. Minute wave iii may be incomplete.
Minute wave iii may only subdivide as an impulse. So far within it minuette waves (i), (ii) and now (iii) may be complete.
Minuette wave (iv) may move lower tomorrow. It may end close to the 0.236 or 0.382 Fibonacci ratios of minuette wave (iii); neither ratio may be favoured as a target. Minuette wave (iv) may be expected to most likely be a single or double zigzag, but it may also be a flat or triangle to exhibit alternation with minuette wave (ii). If minuette wave (iv) exhibits perfect proportion with minuette wave (ii), then it may last a further eight hours so that they both last a Fibonacci thirteen hours.
Minuette wave (iv) may not move into minuette wave (i) price territory below 2,671.17.
If the new wave count is correct and if minuette wave (iv) does move lower, then it may offer a good entry point for a long term position within a new bullish trend.
ALTERNATE WAVE COUNTS
DAILY CHART – TRIANGLE
Click chart to enlarge.
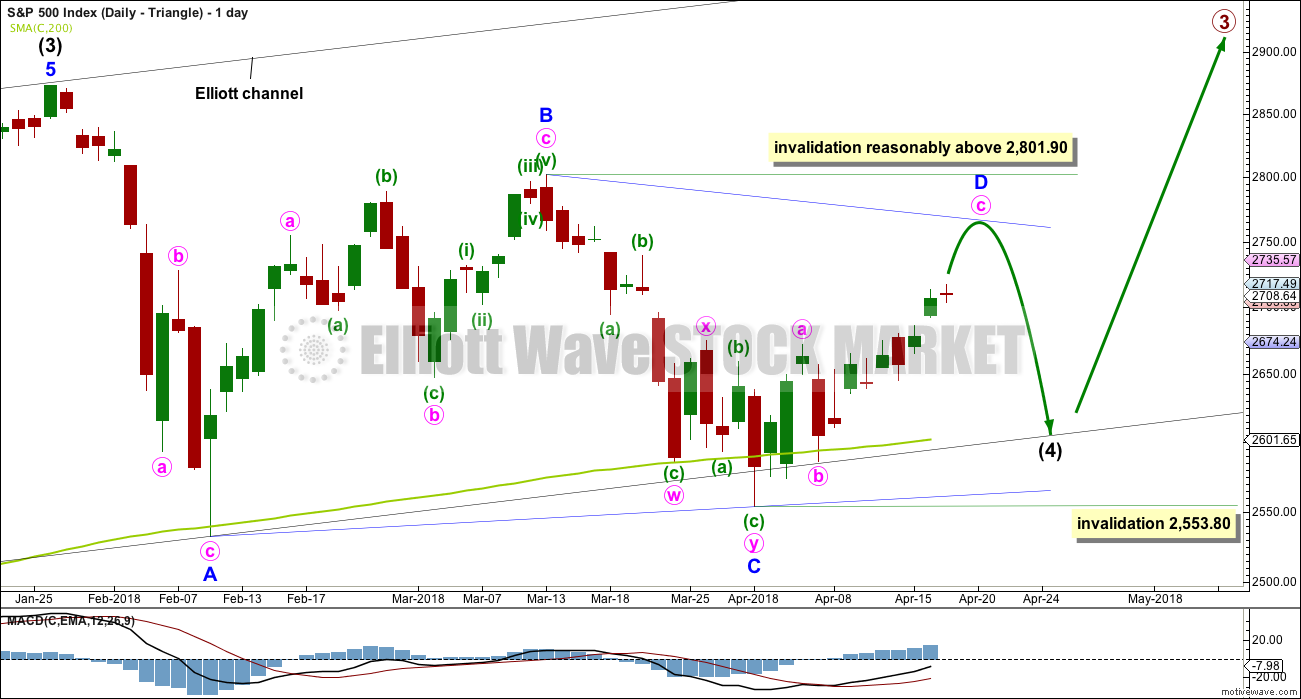
This was the main wave count up until today. It remains possible that the triangle is incomplete.
The triangle may be either a regular contracting or regular barrier triangle. Within the triangle, minor waves A, B and C may be complete.
If intermediate wave (4) is a regular contracting triangle, the most common type, then minor wave D may not move beyond the end of minor wave B above 2,801.90.
If intermediate wave (4) is a regular barrier triangle, then minor wave D may end about the same level as minor wave B at 2,801.90. As long as the B-D trend line remains essentially flat a triangle will remain valid. In practice, this means the minor wave D can end slightly above 2,801.90 as this rule is subjective.
When a zigzag upwards for minor wave D is complete, then this wave count would expect a final smaller zigzag downwards for minor wave E, which would most likely fall reasonably short of the A-C trend line.
If this all takes a further two weeks to complete, then intermediate wave (4) may total a Fibonacci 13 weeks and would be just two weeks longer in duration than intermediate wave (2). There would be very good proportion between intermediate waves (2) and (4), which would give the wave count the right look. However, two more weeks at this time does not look like it may be long enough for a triangle to complete. It may not exhibit a Fibonacci duration.
There are now a few overshoots of the 200 day moving average. This is entirely acceptable for this wave count; the overshoots do not mean price must now continue lower. The A-C trend line for this wave count should have a slope, so minor wave C should now be over.
Within the zigzag of minor wave D, minute wave b may not move beyond the start of minute wave a below 2,553.80.
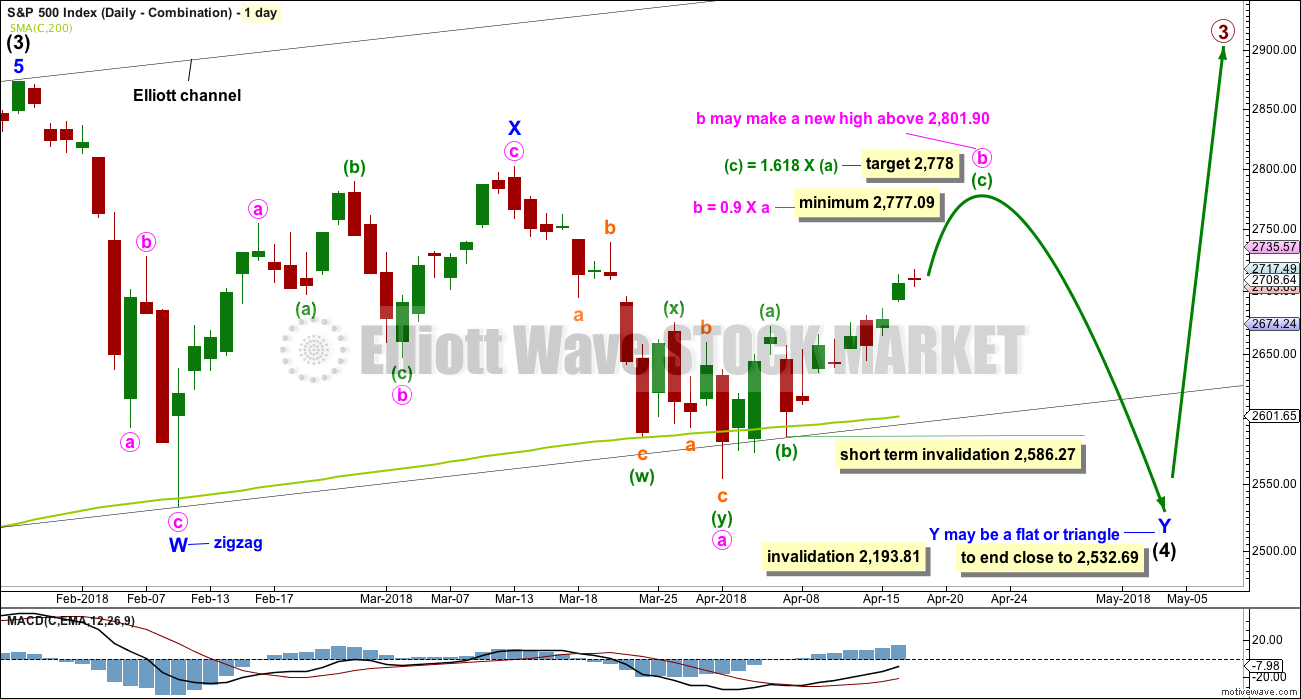
DAILY CHART – COMBINATION
Click chart to enlarge.
Double combinations are very common structures. The first structure in a possible double combination for intermediate wave (4) would be a complete zigzag labelled minor wave W. The double should be joined by a three in the opposite direction labelled minor wave X, which may be a complete zigzag. X waves within combinations are typically very deep; if minor wave X is over at the last high, then it would be a 0.79 length of minor wave W, which is fairly deep giving it a normal look. There is no minimum nor maximum requirement for X waves within combinations.
The second structure in the double would most likely be a flat correction labelled minor wave Y. It may also be a triangle, but in my experience this is very rare, so it will not be expected. The much more common flat for minor wave Y will be charted and expected.
A flat correction would subdivide 3-3-5. Minute wave a must be a three wave structure, most likely a zigzag. It may also be a double zigzag.
Minute wave b must now reach a minimum 0.90 length of minute wave a. Minute wave b must be a corrective structure. It may be any corrective structure. It may be unfolding as a zigzag. A target is calculated for it to end. Within minuette wave (b), no second wave correction may move beyond its start below 2,586.27.
The purpose of combinations is to take up time and move price sideways. To achieve this purpose the second structure in the double usually ends close to the same level as the first. Minor wave Y would be expected to end about the same level as minor wave W at 2,532.69. This would require a strong overshoot or breach of the 200 day moving average, which looks unlikely but does have precedent in this bull market.
Minute wave b may make a new high above the start of minute wave a if minor wave Y is an expanded flat. There is no maximum length for minute wave b, but there is a convention within Elliott wave that states when minute wave b is longer than twice the length of minute wave a the idea of a flat correction continuing should be discarded based upon a very low probability. That price point would be at 3,050. However, if price makes a new all time high and upwards movement exhibits strength, then this idea would be discarded at that point. Minute wave b should exhibit obvious internal weakness, not strength.
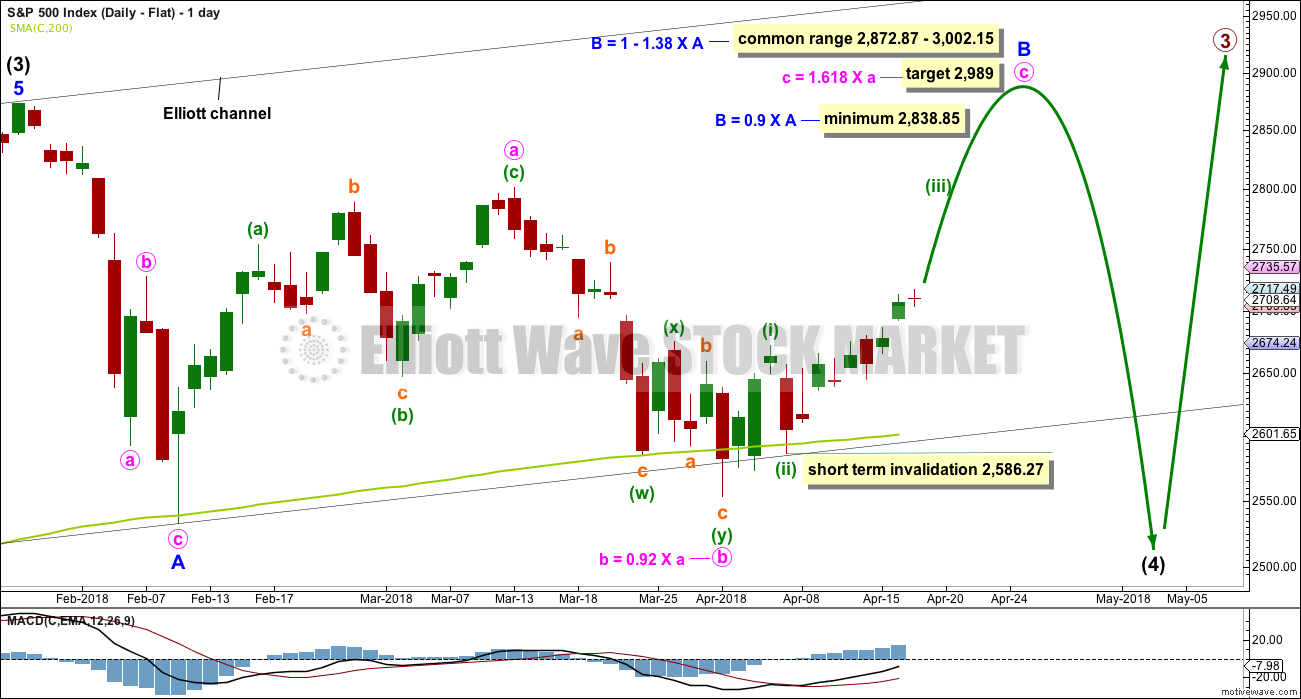
DAILY CHART – FLAT
Click chart to enlarge.
Flat corrections are very common. The most common type of flat is an expanded flat. This would see minor wave B move above the start of minor wave A at 2,872.87.
Within a flat correction, minor wave B must retrace a minimum 0.9 length of minor wave A at 2,838.85. The most common length for minor wave B within a flat correction would be 1 to 1.38 times the length of minor wave A at 2,872.87 to 3,002.15. An expanded flat would see minor wave B 1.05 times the length of minor wave A or longer, at 2,889.89 or above. A target is today calculated for minor wave B to end, which would see it end within the common range.
Minor wave B may be a regular flat correction, and within it minute wave a may have been a single zigzag and minute wave b may have been a double zigzag. This has a very good fit.
At its end minor wave B should exhibit obvious weakness. If price makes a new all time high and exhibits strength, then this wave count should be discarded.
This wave count would require a very substantial breach of the 200 day moving average for the end of intermediate wave (4). This is possible but may be less likely than a smaller breach.
TECHNICAL ANALYSIS
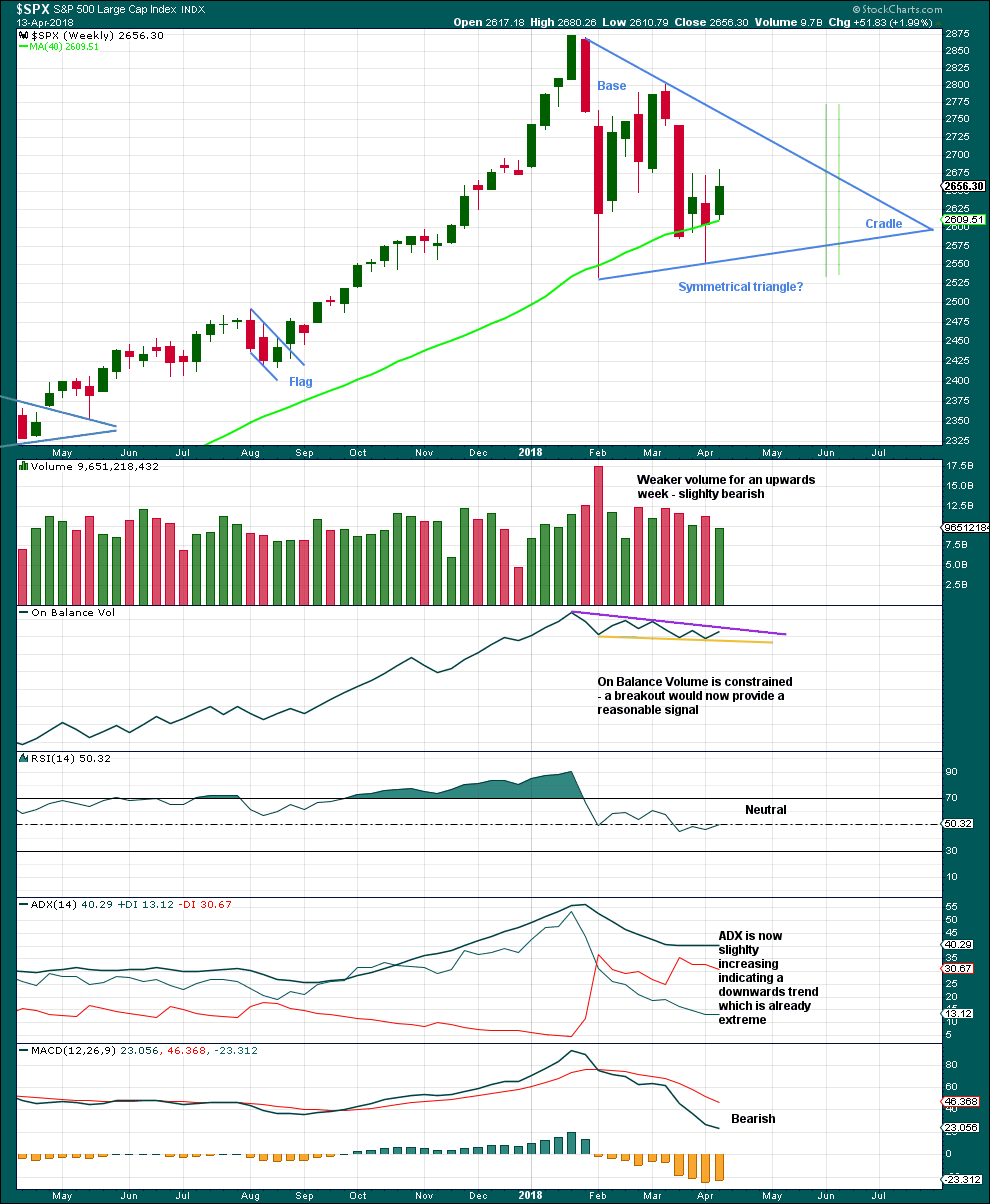
WEEKLY CHART
Click chart to enlarge. Chart courtesy of StockCharts.com.
A classic symmetrical triangle pattern may be forming. These are different to Elliott wave triangles. Symmetrical triangles may be either continuation or reversal patterns, while Elliott wave triangles are always continuation patterns and have stricter rules.
The vertical green lines are 73% to 75% of the length of the triangle from cradle to base, where a breakout most commonly occurs.
From Dhalquist and Kirkpatrick on trading triangles:
“The ideal situation for trading triangles is a definite breakout, a high trading range within the triangle, an upward-sloping volume trend during the formation of the triangle, and especially a gap on the breakout.”
For this example, the breakout has not yet happened. There is a high trading range within the triangle, but volume is declining.
The triangle may yet have another 8 – 9 weeks if it breaks out at the green lines.
Before that happens though On Balance Volume may give a signal. It must give a signal in the next one to very few weeks as the trend lines are converging.
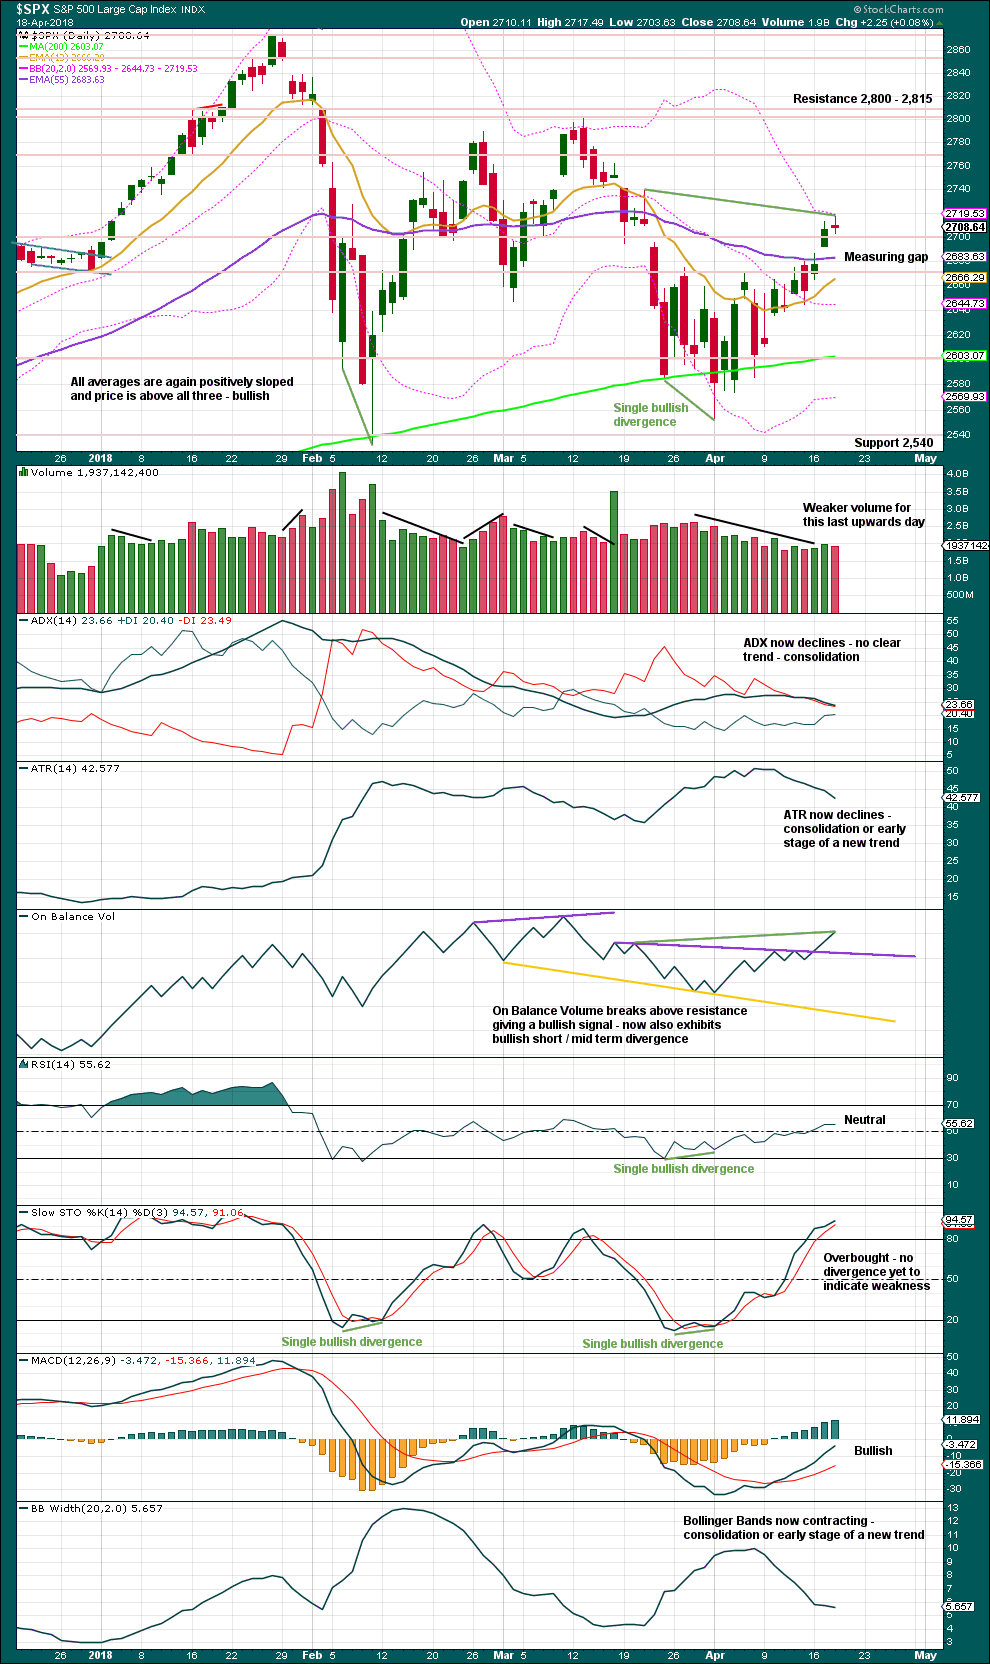
DAILY CHART
Click chart to enlarge. Chart courtesy of StockCharts.com.
The gap on yesterday’s open has its lower edge at 2,686.49. The gap may be assumed to be a measuring gap while it remains open and may be used now to pull stops up on any long positions; stops may now be set just below 2,686.49. If this gap is closed, it would be relabelled an exhaustion gap.
The measuring gap yields a target 2,792.
On Balance Volume gives another bullish signal today with a new high above the prior point of the 21st of March. Price has not yet made a corresponding new high. On Balance Volume is interpreted here as a leading indicator. Divergence noted with green trend lines is bullish.
Stochastics may remain overbought for weeks when the S&P has a strong bullish trend. Only when it is overbought and then exhibits divergence with price may it signal a trend change.
VOLATILITY – INVERTED VIX CHART
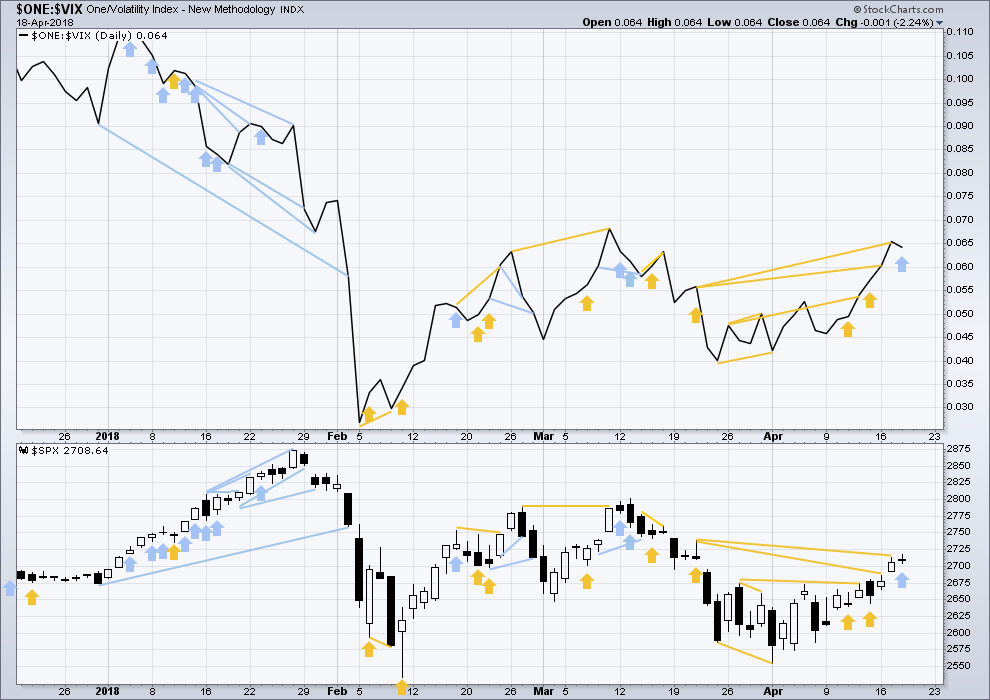
Click chart to enlarge. Chart courtesy of StockCharts.com.
So that colour blind members are included, bearish signals will be noted with blue and bullish signals with yellow.
Normally, volatility should decline as price moves higher and increase as price moves lower. This means that normally inverted VIX should move in the same direction as price.
Today price moved higher and the balance of volume was upwards, but inverted VIX has moved lower. This divergence is bearish and supports the idea of a small pullback tomorrow.
BREADTH – AD LINE

Click chart to enlarge. Chart courtesy of StockCharts.com.
There is normally 4-6 months divergence between price and market breadth prior to a full fledged bear market. This has been so for all major bear markets within the last 90 odd years. With no longer term divergence yet at this point, any decline in price should be expected to be a pullback within an ongoing bull market and not necessarily the start of a bear market.
All of small, mid and large caps last week moved higher. There is no divergence to indicate underlying weakness. The small caps this week are rising faster than mid and large. Small caps made a slight new high today above the prior swing high of the 13th of March. Small caps are very close to a new all time high.
Breadth should be read as a leading indicator.
The AD line has moved very strongly higher during the last three sessions. It has made a new all time high today. This is a very bullish signal, and is the reason for the new wave count expecting new all times from price to follow.
DOW THEORY
The following lows need to be exceeded for Dow Theory to confirm the end of the bull market and a change to a bear market:
DJIA: 23,360.29.
DJT: 9,806.79.
S&P500: 2,532.69.
Nasdaq: 6,630.67.
At this stage, only DJIA has made a new major swing low. DJT also needs to make a new major swing low for Dow Theory to indicate a switch from a bull market to a bear market. For an extended Dow Theory, which includes the S&P500 and Nasdaq, these two markets also need to make new major swing lows.
Charts showing each prior major swing low used for Dow Theory may be seen at the end of this analysis here.
Published @ 09:55 p.m. EST.
updated hourly chart:
So far, so good. It looks like the green Elliott channel is showing where minuette (iv) may be finding support. It’s still relatively shallow so there’s good alternation.
Hi Lara
What kind of pullback can we expect after Minute III (V)
What kind of pullback can we expect for Minute IV
Thank You
It may be deep, because minute ii was shallow. It may be a zigzag because minute ii was a combination.
Minute ii shows up on the daily chart so I’d expect minute wave iv to also show up. Minute iv may last about one to three sessions.
Looks to me like the gap is closed.
The EMA 55 and MA 200 cross as the gap closes ….
What does that mean exactly.
Thank You
well spotted! thanks Rodney.
that means it’s not a measuring gap now, it’s an exhaustion gap
so we should expect a pullback or consolidation about here
in terms of the EW count, possibly minuette (v) may not make much of a new high above the end of minuette (iii), and then minute iv may begin.
Hi Lara
If your right what kind of correction can we possibly get after minute (v) unfolds.
Thank You
answered above
Not letting profits sit. Rolling SPY 268 puts backwards after very nice pop! Putting half profits into puts expiring tomorrow…house money baby! 🙂
PGE took out the power (I got a notice, buried in my unopened mail, whoops!) for the day starting 9am (trading starts here 6:30am). Gack!!! Fire up laptop…NO POWER. My modem has its own battery back up. My main computer is on a separate BBU…but not the monitors. So I power down the main computer, and hook the laptop to the BBU for slower drainage, and I’m live but…now I can’t run motivewave (which I use alot) because the MW server still thinks the main computer copy of MW is still running. ANother gack. Oh well, one of those days, at least I’m over 1/2 way to my daily profit target! It could be far worse…
The first time that happened to me, I subsequently made sure I had a plethora of redundancies! Yikes!
Sorry this has happened. Hope it all goes well..
Thankfully the market behaved, not that I’d have any significant problem if it didn’t. But my modem lost BBU mid morning and that was that until after market close and power on the block was restored. I think the market is probably going to roll back into the next 5…but…it’s these little sell offs that recently, if not quickly recovered from, have the proceeded to roll over into rapid waterfall sell offs. I don’t expect that, but I’m not going to let it surprise me either.
Taking profits on rolled VIX bull put spread. Back to my old policy of not letting profits sit in this treacherous market…a good week for the long vol trade!
Exited short leg of SPY bull put spread and now slightly in the green on long puts after being under water initially. This is why I like spreads…will add to long puts if we close below 50 day…
A gallant attempt to negate the developing island reversal pattern by closing this morning’s gap. The bears not only stifled that, they busted through putative support of the initial gap of the island…time to pay attention…
There are few things more menacing to traders than false break-outs. The bullish signals coming with a bearish structure (rising wedge) was a cautionary note. A retest of the 50 day was to be expected, a failure to hold it is a game-changer so far as the immediate trend is concerned imho…
Kevin,
If the new main / preferred count is correct, we owe each other a dollar. This morning’s gap down is to the top of the gap from the open of two days ago. If it holds, the main / preferred count stands. If the gap closes, then Lara states it will be labeled as an exhaustion gap. I can only interpret that to mean the triangle count would be back in play.
Interesting. I am still sitting on hands. The hourly MACD has turned downwards. There is a good chance the gap will be filled.
I have to admit I have some concerns about the new preferred count. Minor D & E seem so small and out of proportion to the rest of the triangle. It just does not look right to me.
I think all 3 major alternatives are still in play Rodney, the triangle, combo, and flat. For now. I buy Lara’s take that this is a “little 4” and I suspect it holds generally around the 2686 area (bottom of gap 2 days ago). If it shoves through there and keeps falling…look out below. What that would do to higher level counts and structures I don’t have time to think about until later or if/when it happens.
I do note with mild concern that NDX has turned down at exactly the 61.8% retrace of the March high to April low. Meaning, the turn could be “significant”. I’d sure like to see it turn back up and push through that quickly myself, but will take what comes!
Hi Kevin
If we break below the 2686 level
Do you think we go to the 2586 level that Lara posted some time ago.
Or do you think we go even lower then that possibily to retest the 2532 level.
Thank You
It’s possible. But I won’t see that as super likely just because we bust 2686 here.
“If the gap closes, then Lara states it will be labeled as an exhaustion gap. I can only interpret that to mean the triangle count would be back in play.”
I can’t do that with the AD line making new all time highs. That’s just too bullish.
I’ll have to run the four daily counts alongside each other. But the main count will be still bullish.
A consolidation following the exhaustion gap may only be of a few days, it could be minute iv.
Looking for some ES wisdom. First, I agree with the mantra that one should always trade with stops. But, I feel that Lara’s stops are too tight for leveraged markets….. I want to hold a few ES contracts long to the target without getting my pockets picked. How do others approach this?
I differentiate between a positional trade and a scalp entry trade. For me, a scalp entry is an entry into a decently (ideally, “fast”) rising market. And the moment it turns against me, I bail. I also like to use a bit more size, and the moment I have a tiny profit…I take 50%, and the stop is then the breakeven sale point below my buy: it becomes a kind of “free trade”. For positional trades, I have to have EW and general confidence in the market direction, and the positional set up. I might use a scale in approach, buying relatively small and adding at key points if the market drops. Or, I might use an outright option purchase, which has the emotional advantage of having a built in stop: you can’t lose more than you paid for the option! All these approaches can be combined in various ways of course. Another technique is to only enter on the confirmed turn off key support (fibo’s + symmetric projections in a cluster are the best IMO), and use VERY TIGHT stops underneath.
Best of luck!
I’ll add that I don’t really understand your comment about Lara’s stops. She really isn’t laying out any sort of detailed trade parameters (appropriately, IMO; her business is the EW/Technical analysis, our job is to structure trades that leverage that info, as I see it). When she points out invalidation levels and “should not go beyond” levels, I don’t view those as stops for my trades at all. Those are levels where the structure she’s talking about does or may become invalid, and you better start thinking about a different wave architecture in play.
Using the “Visual Guide to Elliot Wave Trading” to enter a trade and then raise your stops as the trade unfolds has resulted in many stop outs during this 4th wave…. obviously not a great plan. Want to avoid these mistakes during a potential 5.
I’ve got that book, it’s not bad. But I prefer much tighter risk management than what it suggests, starting with more precise entries ideally. And in sloppy markets, an approach of using smaller size on initial entry and then scale in more on a drop to and turn off a next lower support zone can be a good strategy, if the market is generally healthy (which can turn on a dime I know). An additional approach is to use shorting when the signals present themselves to insure the losses of the held positions. Taking stop exit after stop exit is a sure way to lose money. So again, three methods: SUPER tight stops and “rinse and repeat” until you get it right, or scale in as price drops, and use shorts to temporarily drive effective risk down (or even turn it for a time to a profitable situation).
Of course there are a virtual infinite supply of option based risk management strategies too, such as horizontal spreads. I can’t sell options at this time in my main (IRA) trading account so I don’t use that technique at this time.
It’s occurred to me, that if I was regularly giving trading advice (enter here, put stops here, take profit here) then I wouldn’t bother with all this EW stuff.
I’d just give trading advice. The analysis would be superfluous.
But that’s not what I’m doing.
I did try it for a couple of months, I called it “Trading Room”. And although over the two month period I managed to produce a profit overall, the idea just didn’t seem very popular. The posts had little engagement and the videos on YouTube had less views than usual, and a higher than normal ratio of dislike to likes.
Anyway, my strength is in analysis. And it can be used by many different traders with different trading styles.
Those that come here and are already experienced traders tend to be more likely to stay. Those that come and go are needing to learn how to trade, and that’s not what my analysis is teaching.
All very insightful. Thank you.
Thanks to Chris for the heads up on the long vol trade trigger a few days ago.
Pow! on the fat 13/15 bull put spread. Took profits and rolled yesterday. Hey Chris, send me an invoice! 😀
Thanks, I take beer, cigars or crypto……lol
The action these last few days is starting to look what we saw almost every day in 2017. Intraday range of just 14 SPX points, and the early morning dip was ramped immediately.
Indeed!
I have a slightly different take on the recent wave action. My count is attached (hourly chart). I see a more extended subminuette 3, that starts with a leading diagonal. This count might see a bit more upward action before that 4 hits. I see the overnight is showing another opening gap upward…
“Wrong again, Batman!!”. Lol!!