
More upwards movement fits the main Elliot wave count. With price closing today above resistance and signals from the AD line and VIX, the main Elliot wave count is now favoured.
Summary: While price remains above 2,645.05 the target is at 2,705, or a range from 2,752 to 2,766. Strong divergence between price and the AD line today, and reasonable divergence between price and inverted VIX, support the main wave count.
A new low below 2,645.05 would indicate more downwards movement, and the target would be between 2,586.27 and 2,553.80. Resistance here for On Balance Volume supports this view.
Always practice good risk management. Always trade with stops and invest only 1-5% of equity on any one trade.
New updates to this analysis are in bold.
The biggest picture, Grand Super Cycle analysis, is here.
Last historic analysis with monthly charts is here. Video is here.
An alternate idea at the monthly chart level is given here at the end of this analysis.
An historic example of a cycle degree fifth wave is given at the end of the analysis here.
MAIN ELLIOTT WAVE COUNT
WEEKLY CHART
Click chart to enlarge.
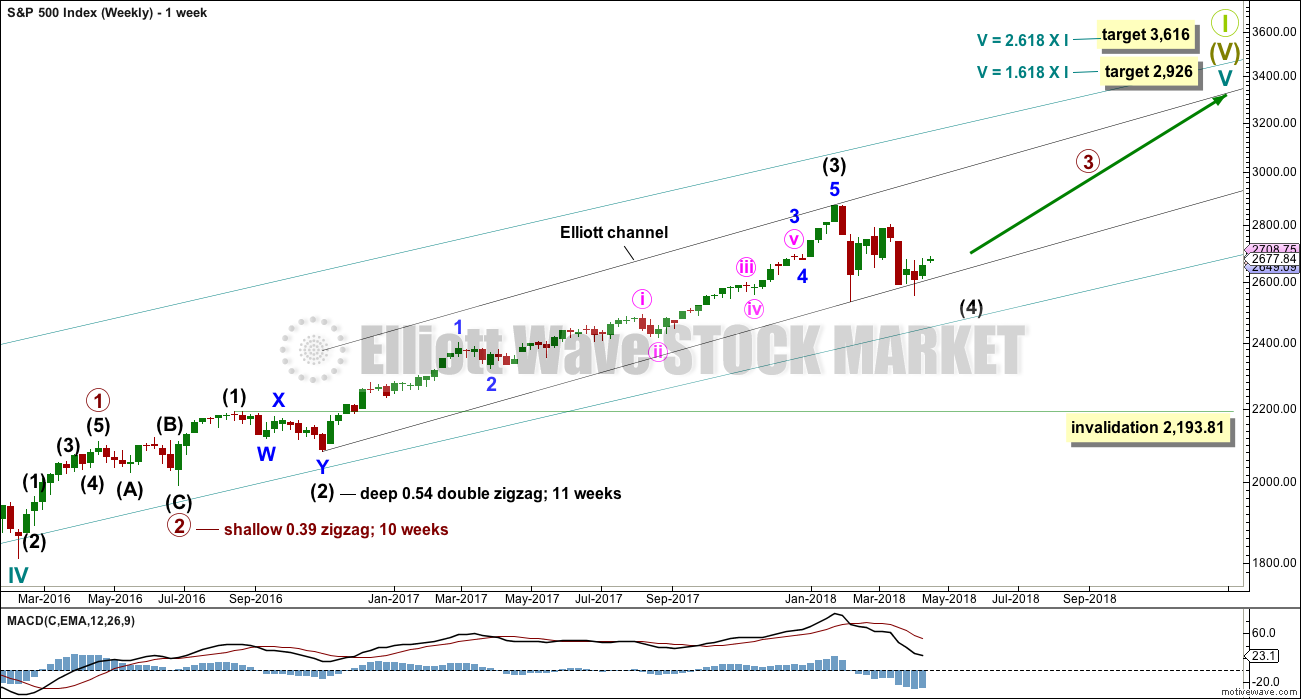
Cycle wave V must complete as a five structure, which should look clear at the weekly chart level. It may only be an impulse or ending diagonal. At this stage, it is clear it is an impulse.
Within cycle wave V, the third waves at all degrees may only subdivide as impulses.
Intermediate wave (4) has breached an Elliott channel drawn using Elliott’s first technique. The channel is redrawn using Elliott’s second technique as if intermediate wave (4) was over at the first swing low within it. If intermediate wave (4) continues sideways, then the channel may be redrawn when it is over. The upper edge may provide resistance for intermediate wave (5).
Intermediate wave (4) may not move into intermediate wave (1) price territory below 2,193.81. However, it would be extremely likely to remain within the wider teal channel (copied over from the monthly chart) if it were to be reasonably deep. This channel contains the entire bull market since the low in March 2009, with only two small overshoots at the end of cycle wave IV. If this channel is breached, then the idea of cycle wave V continuing higher would be discarded well before the invalidation point is breached.
At this stage, it now looks like intermediate wave (4) may be continuing further sideways as a combination, triangle or flat. These three ideas are separated into separate daily charts. All three ideas would see intermediate wave (4) exhibit alternation in structure with the double zigzag of intermediate wave (2).
A double zigzag would also be possible for intermediate wave (4), but because intermediate wave (2) was a double zigzag this is the least likely structure for intermediate wave (4) to be. Alternation should be expected until price proves otherwise.
DAILY CHART – TRIANGLE
Click chart to enlarge.
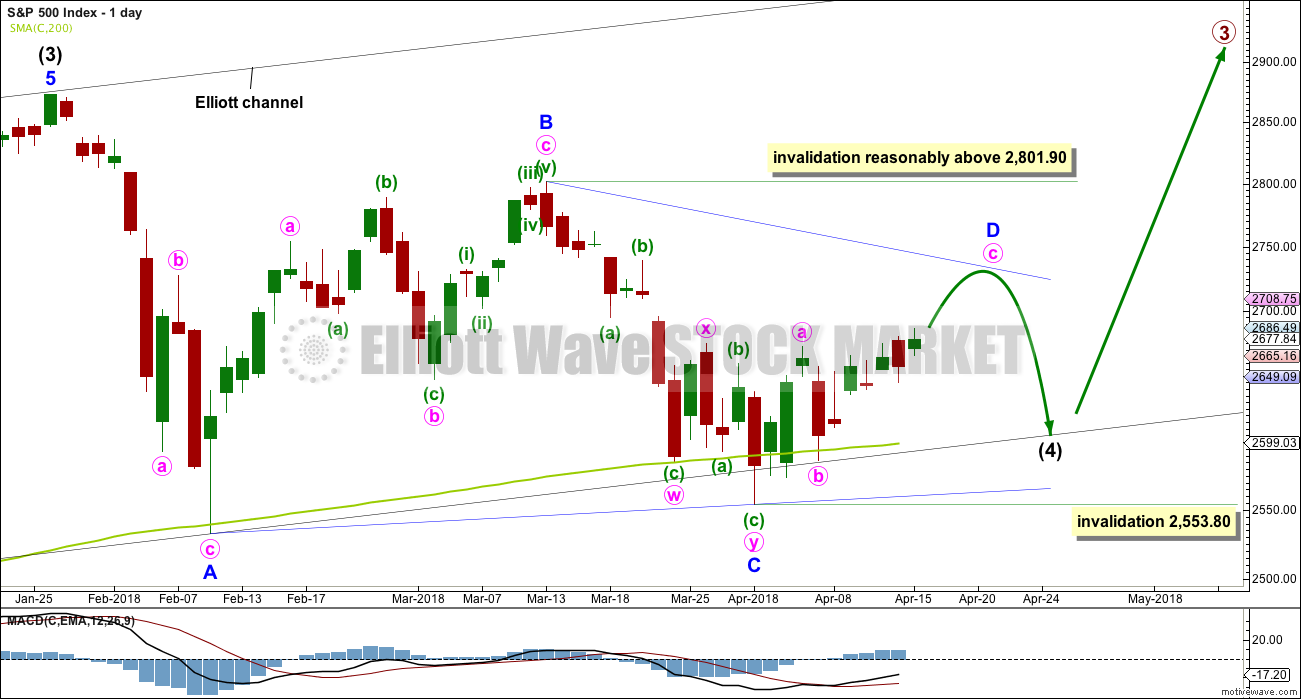
This first daily chart looks at a triangle structure for intermediate wave (4). The triangle may be either a regular contracting or regular barrier triangle. Within the triangle, minor waves A, B and C may be complete.
If intermediate wave (4) is a regular contracting triangle, the most common type, then minor wave D may not move beyond the end of minor wave B above 2,801.90.
If intermediate wave (4) is a regular barrier triangle, then minor wave D may end about the same level as minor wave B at 2,801.90. As long as the B-D trend line remains essentially flat a triangle will remain valid. In practice, this means the minor wave D can end slightly above 2,801.90 as this rule is subjective.
When a zigzag upwards for minor wave D is complete, then this wave count would expect a final smaller zigzag downwards for minor wave E, which would most likely fall reasonably short of the A-C trend line.
If this all takes a further two weeks to complete, then intermediate wave (4) may total a Fibonacci 13 weeks and would be just two weeks longer in duration than intermediate wave (2). There would be very good proportion between intermediate waves (2) and (4), which would give the wave count the right look. However, two more weeks at this time does not look like it may be long enough for a triangle to complete. It may not exhibit a Fibonacci duration.
There are now a few overshoots of the 200 day moving average. This is entirely acceptable for this wave count; the overshoots do not mean price must now continue lower. The A-C trend line for this wave count should have a slope, so minor wave C should now be over.
Within the zigzag of minor wave D, minute wave b may not move beyond the start of minute wave a below 2,553.80.
MAIN HOURLY CHART
Click chart to enlarge.
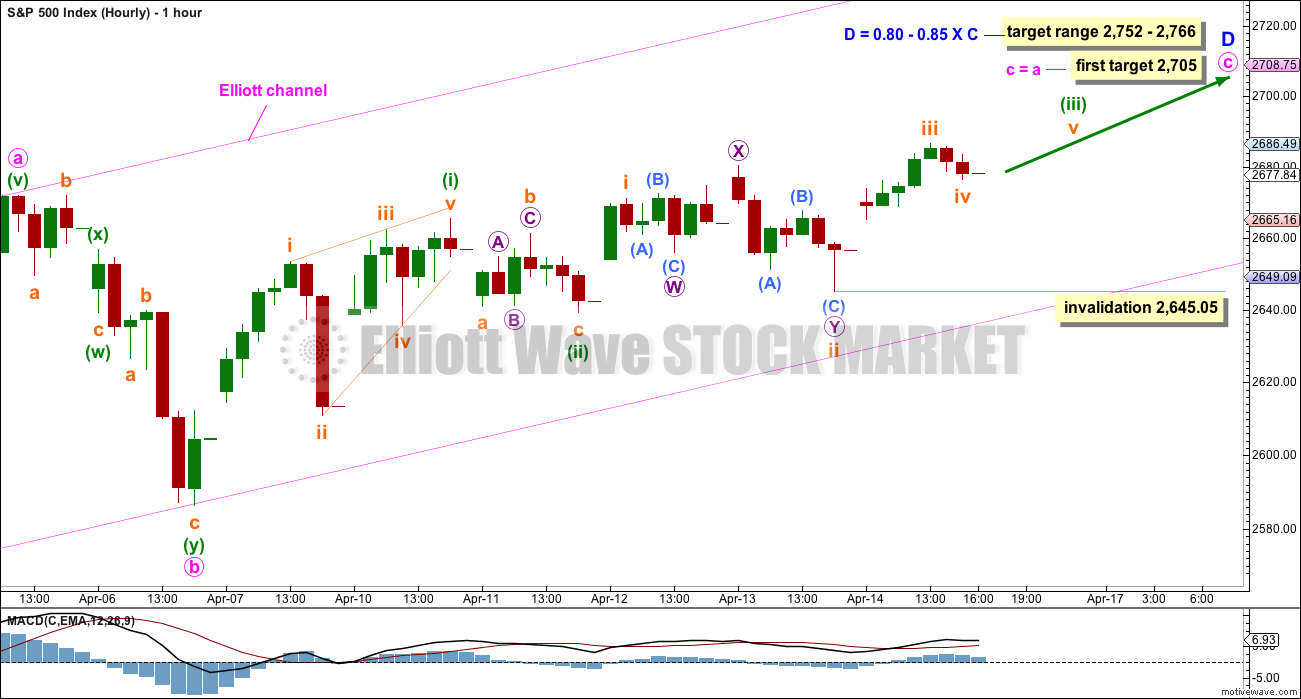
Minor wave D upwards should subdivide as a zigzag. Within the zigzag, minute wave b now shows up on the daily chart as a large red daily candlestick. This would give minor wave D an obvious three wave look on the daily chart, which should be expected.
Minute wave b subdivides as a completed double zigzag. The most common Fibonacci ratio is used to calculate a target for minute wave c.
Minute wave c must subdivide as a five wave structure. So far within it there may now be two overlapping first and second waves complete, labelled minuette waves (i) and (ii), and now subminuette waves i and ii. This wave count expects to see an increase in upwards momentum as the middle of a low degree third wave unfolds.
Minuette wave (iii) may only subdivide as an impulse. Within minuette wave (iii), subminuette iii may be over at today’s high. Or the degree of labelling of this last small wave may be moved down one degree to be only micro wave 1 within subminuette wave iii. Within subminuette wave iii, no second wave correction may move beyond the start of its first wave below 2,645.05.
The target at 2,705 may not be high enough to allow enough room for the structure of minute wave c to complete. If price keeps rising through this target, then use the target zone.
ALTERNATE HOURLY CHART
Click chart to enlarge.
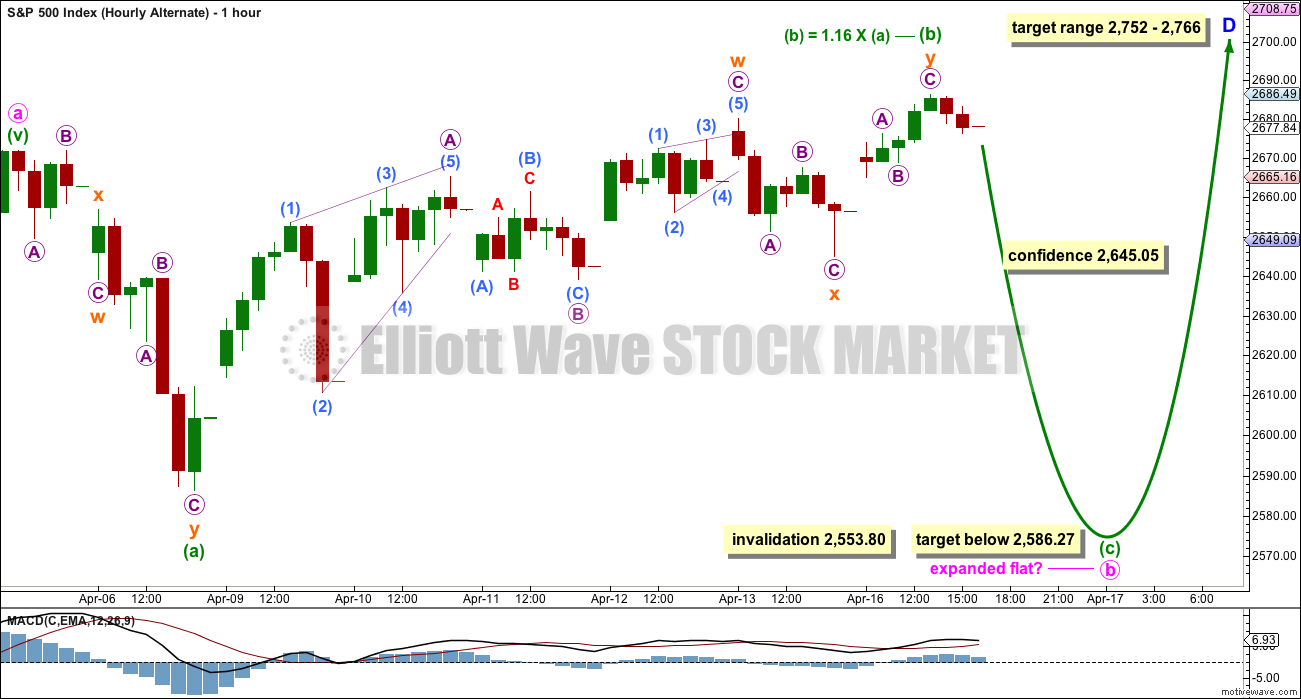
If price makes a new low below 2,645.05, then use this alternate wave count. Expect a deep pullback. This hourly wave count now has more support from classic technical analysis.
By simply moving the degree of labelling down within the last downwards wave, it is possible that minute wave b may be incomplete.
If minute wave b has begun with a double zigzag downwards for minuette wave (a), then it may be either a flat or a triangle. A flat is more common, so that shall be how this chart is labelled.
Within the flat correction, minuette wave (b) has passed the minimum requirement of 0.9 the length of minuette wave (a). The common range for minuette wave (b) would be from 1 to 1.38 times the length of minuette wave (a).
Minuette wave (b) may have continued higher on Monday as a double zigzag. It is still within the common length of 1 to 1.38 times the length of minuette wave (a).
This wave count now expects a large downwards wave for minuette wave (c). Minuette wave (c) would be highly likely to make at least a slight new low below the end of minuette wave (a) at 2,586.27 to avoid a truncation and a very rare running flat.
A target calculation for minuette wave (c) to end using 1.618 the length of minuette wave (a) yields an invalid target. A target for minuette wave (c) to end may need to be calculated at subminuette degree.
Minute wave b may not move beyond the start of minute wave a below 2,553.80.
There is no upper invalidation point today for minuette wave (b). The second zigzag in the double may continue higher. There is no maximum allowable length for B waves within flats, but there is a convention within Elliott wave that states when the possible B wave reaches twice the length of the A wave the idea of a flat should be discarded based upon a very low probability. That price point here would be at 2,757.87.
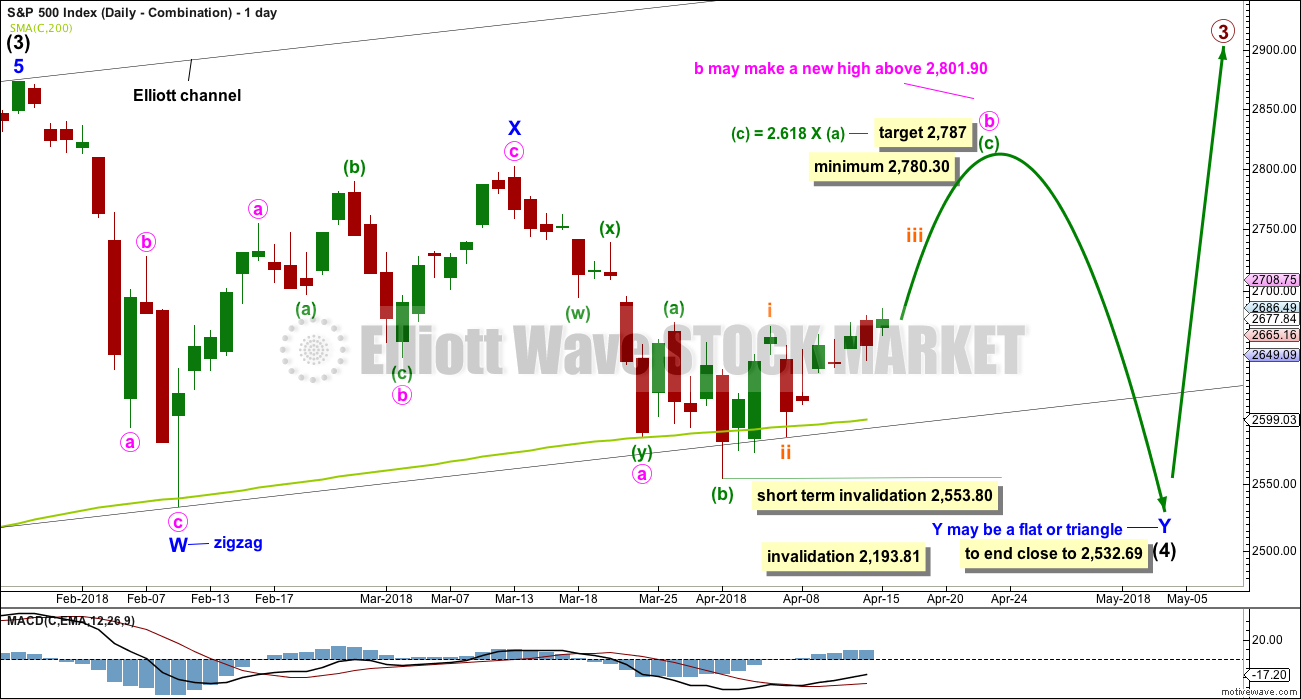
DAILY CHART – COMBINATION
Click chart to enlarge.
Double combinations are very common structures. The first structure in a possible double combination for intermediate wave (4) would be a complete zigzag labelled minor wave W. The double should be joined by a three in the opposite direction labelled minor wave X, which may be a complete zigzag. X waves within combinations are typically very deep; if minor wave X is over at the last high, then it would be a 0.79 length of minor wave W, which is fairly deep giving it a normal look. There is no minimum nor maximum requirement for X waves within combinations.
The second structure in the double would most likely be a flat correction labelled minor wave Y. It may also be a triangle, but in my experience this is very rare, so it will not be expected. The much more common flat for minor wave Y will be charted and expected.
A flat correction would subdivide 3-3-5. Minute wave a must be a three wave structure, most likely a zigzag. It may also be a double zigzag. On the hourly chart, this is now how this downwards movement fits best, and this will now be how it is labelled.
Minute wave b must now reach a minimum 0.90 length of minute wave a. Minute wave b must be a corrective structure. It may be any corrective structure. It may be unfolding as an expanded flat correction. A target is calculated for it to end. Within minuette wave (c), subminuette waves i and ii may now be complete. Within subminuette wave iii, no second wave correction may move beyond its start below 2,586.27.
The purpose of combinations is to take up time and move price sideways. To achieve this purpose the second structure in the double usually ends close to the same level as the first. Minor wave Y would be expected to end about the same level as minor wave W at 2,532.69. This would require a strong overshoot or breach of the 200 day moving average, which looks unlikely but does have precedent in this bull market.
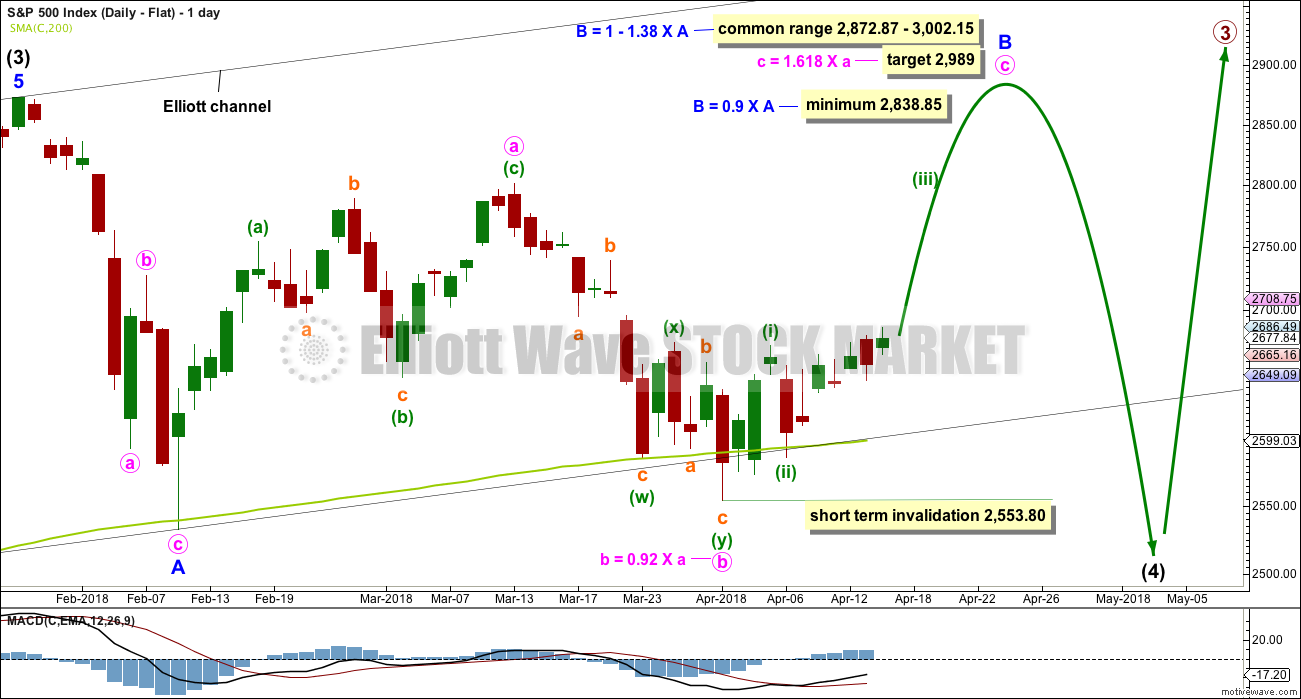
DAILY CHART – FLAT
Click chart to enlarge.
Flat corrections are very common. The most common type of flat is an expanded flat. This would see minor wave B move above the start of minor wave A at 2,872.87.
Within a flat correction, minor wave B must retrace a minimum 0.9 length of minor wave A at 2,838.85. The most common length for minor wave B within a flat correction would be 1 to 1.38 times the length of minor wave A at 2,872.87 to 3,002.15. An expanded flat would see minor wave B 1.05 times the length of minor wave A or longer, at 2,889.89 or above. A target is today calculated for minor wave B to end, which would see it end within the common range.
Minor wave B may be a regular flat correction, and within it minute wave a may have been a single zigzag and minute wave b may have been a double zigzag. This has a very good fit. The subdivisions at the hourly chart level at this stage would be the same for the last wave down as the main wave count.
This wave count would require a very substantial breach of the 200 day moving average for the end of intermediate wave (4). This is possible but may be less likely than a smaller breach.
TECHNICAL ANALYSIS
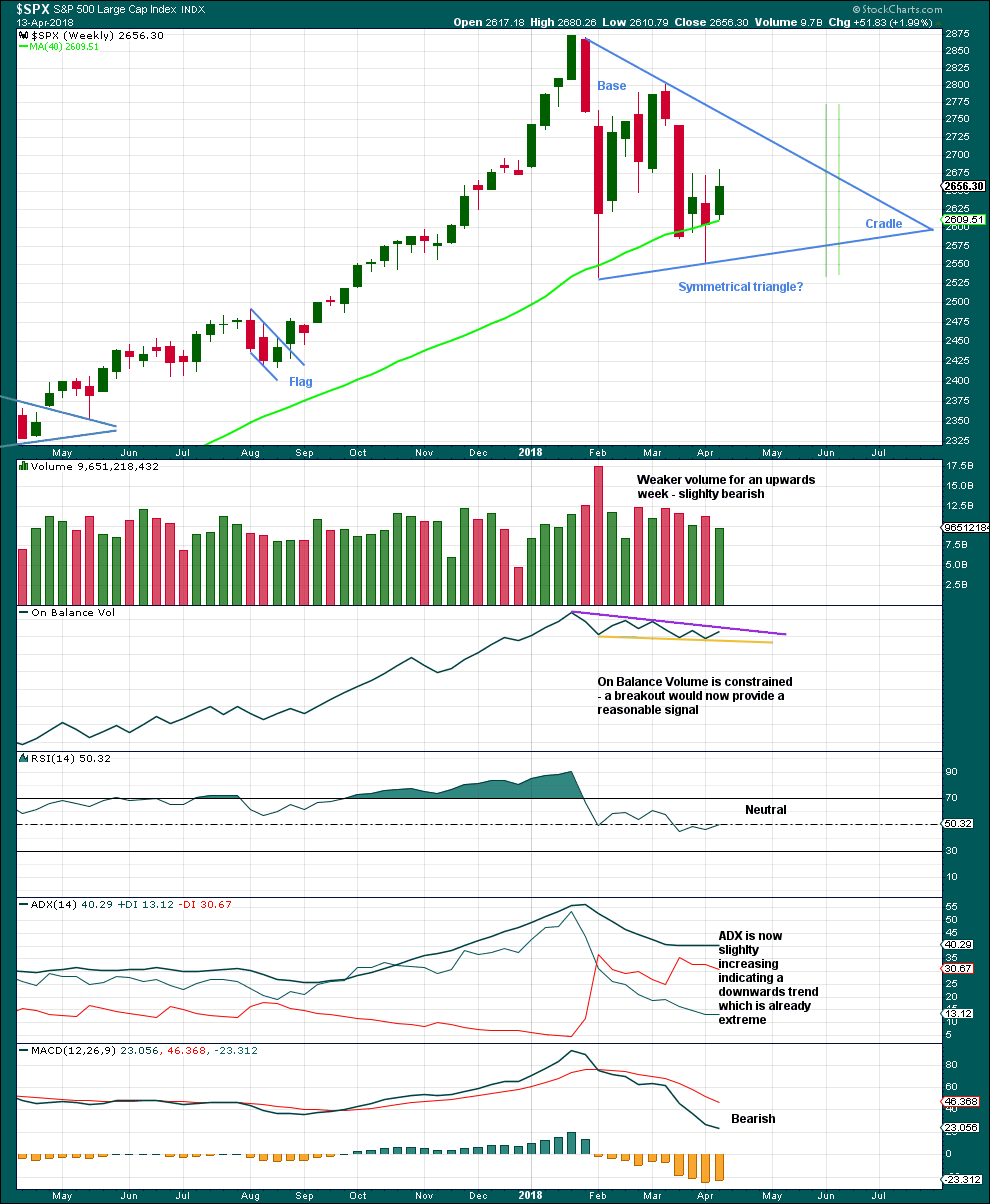
WEEKLY CHART
Click chart to enlarge. Chart courtesy of StockCharts.com.
A classic symmetrical triangle pattern may be forming. These are different to Elliott wave triangles. Symmetrical triangles may be either continuation or reversal patterns, while Elliott wave triangles are always continuation patterns and have stricter rules.
The vertical green lines are 73% to 75% of the length of the triangle from cradle to base, where a breakout most commonly occurs.
From Dhalquist and Kirkpatrick on trading triangles:
“The ideal situation for trading triangles is a definite breakout, a high trading range within the triangle, an upward-sloping volume trend during the formation of the triangle, and especially a gap on the breakout.”
For this example, the breakout has not yet happened. There is a high trading range within the triangle, but volume is declining.
The triangle may yet have another 8 – 9 weeks if it breaks out at the green lines.
Before that happens though On Balance Volume may give a signal. It must give a signal in the next one to very few weeks as the trend lines are converging.
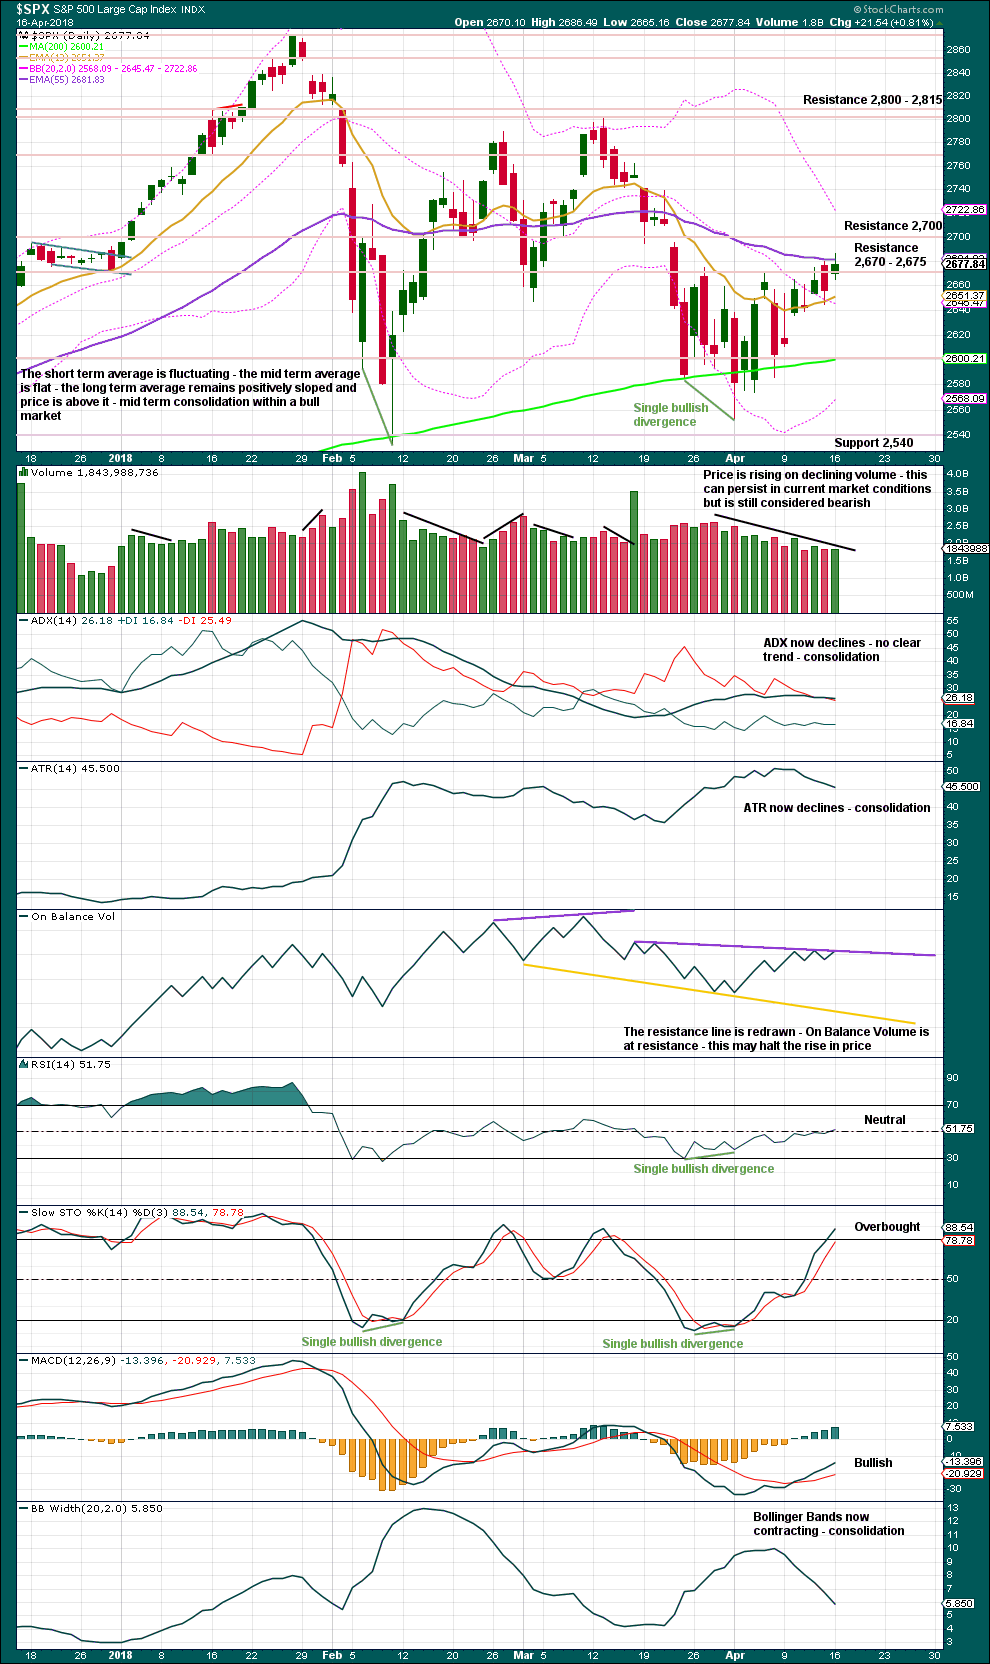
DAILY CHART
Click chart to enlarge. Chart courtesy of StockCharts.com.
Price has closed above resistance today, which was strong about 2,670 – 2,675. Next resistance is just ahead at about 2,700.
Little weight will be given to declining volume as this has been persisting now for some years at all time frames yet price has continued to drift slowly higher. It can certainly continue to do so again.
The strongest piece of technical analysis on this chart today is resistance for On Balance Volume. This trend line is reasonably long held, has a very shallow slope, and has been tested four times so far. This is the fifth test. This line has reasonable technical significance. If this halts the rise in price here, that would suggest the alternate hourly Elliott wave count may be correct and a sharp pullback may be about to occur.
VOLATILITY – INVERTED VIX CHART
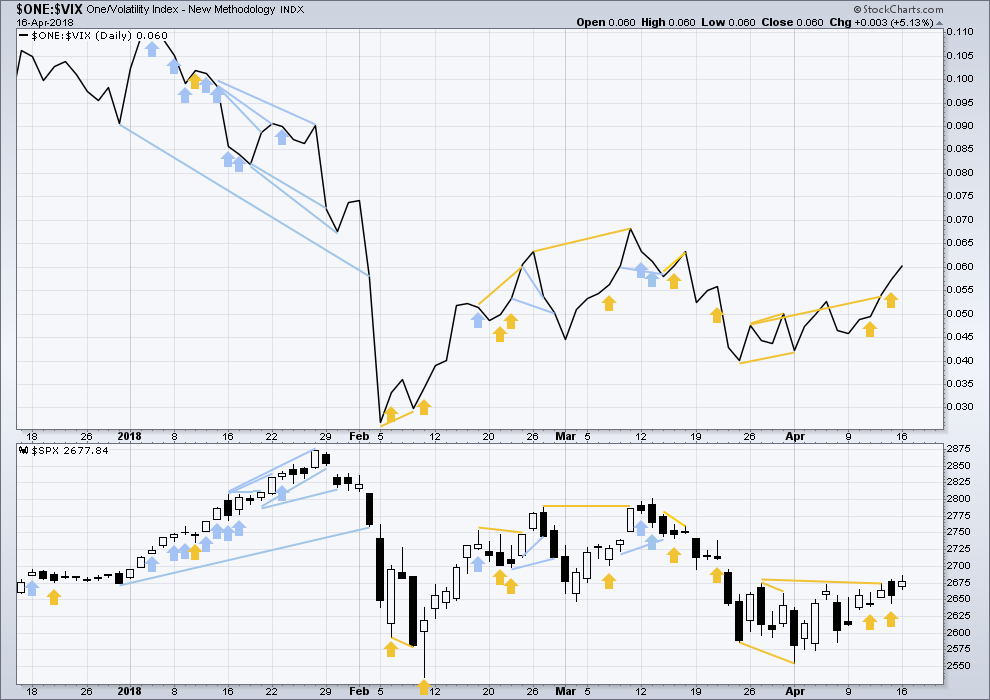
Click chart to enlarge. Chart courtesy of StockCharts.com.
So that colour blind members are included, bearish signals will be noted with blue and bullish signals with yellow.
Normally, volatility should decline as price moves higher and increase as price moves lower. This means that normally inverted VIX should move in the same direction as price.
Inverted VIX has today made a new high above the prior high of the 21st of March, but price has not. If VIX is a leading indicator, then price may follow. This divergence is bullish.
BREADTH – AD LINE
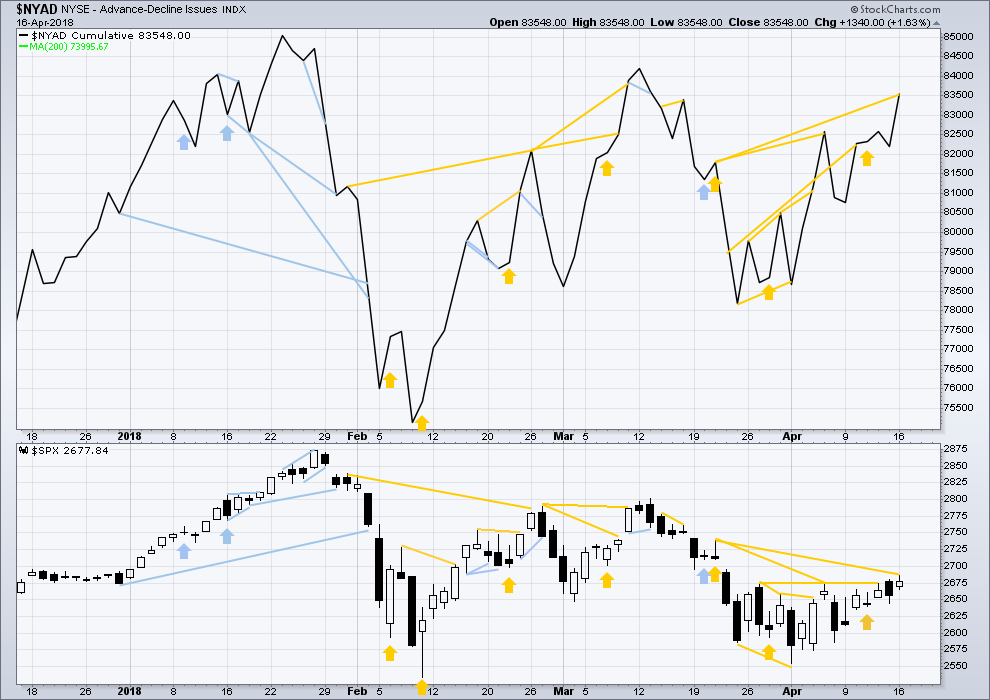
Click chart to enlarge. Chart courtesy of StockCharts.com.
There is normally 4-6 months divergence between price and market breadth prior to a full fledged bear market. This has been so for all major bear markets within the last 90 odd years. With no longer term divergence yet at this point, any decline in price should be expected to be a pullback within an ongoing bull market and not necessarily the start of a bear market.
All of small, mid and large caps last week moved higher. There is no divergence to indicate underlying weakness.
Breadth should be read as a leading indicator.
The AD line has today made a new high above the prior high of the 21st of March, but price has not. This divergence is strong, and it is bullish.
DOW THEORY
The following lows need to be exceeded for Dow Theory to confirm the end of the bull market and a change to a bear market:
DJIA: 23,360.29.
DJT: 9,806.79.
S&P500: 2,532.69.
Nasdaq: 6,630.67.
At this stage, only DJIA has made a new major swing low. DJT also needs to make a new major swing low for Dow Theory to indicate a switch from a bull market to a bear market. For an extended Dow Theory, which includes the S&P500 and Nasdaq, these two markets also need to make new major swing lows.
Charts showing each prior major swing low used for Dow Theory may be seen at the end of this analysis here.
Published @ 08:40 p.m. EST.
GBTC (exchanged tradeable bitcoin) now in and perhaps completed a 4 wave of a 3 up after a clear 5 down (only final section shown on chart), 1 up, 2 down, and 3 up in progress.
Updated hourly chart:
The first target is well passed. Let’s now use the target range.
Great work as usual, Lara!!
Yep. I think we are in a fifth up with multiple momentum divergences accompanying the recent highs. I expect we complete it tomorrow, if we have not already.
Well, all the indicators I was using for trying to predict a pullback have failed. If one eventually comes, I now assume it’ll be out of nowhere like the early February madness and I don’t know of a good way to predict it.
I remember back in mid February and early March people around here were talking about huge fundamental market weaknesses, impending bank failures and massive defaults, VIX over 80, etc. Not trying to be snarky, but where’d y’all go? The correction has continued and yet housing starts are up, earnings are good, and VIX is under 15.
5th straight day of downward movement for VIX. Goldman’s results today show the bankers pulled one of us all with the February shenanigans. Back to ATHs I guess.
My guess is they’ll be talking that smack again when there’s a fresh epic leg down, ie. either the flat model or the combination model play out. I find it hilarious that GS smashed their earnings…and then got smashed because so much proft was “only via trading”. And so successful too! It makes one wonder just how coordinated these banks might be at the encrypted message level of their respective trading desks. Big Time Money working in coordinated ways can definitely move markets. Who’s the got the money? The banks. And they are active. Well, here’s to being more nimble than them!!
Short term, GS is getting into what I consider a potential buy (or “buy as it exits upward”) zone here. There’s a good trend line dfrom early april through Apr 9, and the length of this downmove is getting close to symmetric with thie Apr 5-6 downmove. And there’s alot of support in the 250-252 zone. GS is not going to tank here, not when it’s printing money (even if the business employed is “not legitimate” or “not sustainable” or whatever!).
I agree, I’m not a conspiracy theorist by any means but Goldman’s results make it pretty clear what type of market is better for the bankers. I’m sure they had a field day running stops in early February.
The movement out of the wedge looks parabolic now, and on the one hand I’d say that doesn’t bode well, but on the other hand I don’t have a good guess on where the turn is going to be. The divergence in DJT is pretty striking here, and that was a big red flag in January too. But as we saw then, the market could run up for another two weeks and reverse any time in that span.
No reasonable person could say that NFLX should have doubled in less than a year, yet here we are.
Too busy utilizing the volatility to capture multiple triple digit returns…..I’ll repeat for those who missed, this market has the largest fundamental weakness in human history. 20-40% of publicly listed equities are complete debt zombies, and there will be bank failures, bailouts and consolidations again, real estate likely takes a very long term dip, and yes the VIX will see 89. All which will come once BIS, IMF, and the central banks are in position to handle it, which if you haven’t noticed they been holding it up for huge sellers the past few weeks. Just like I called XIV going to zero, every statement here will also come to pass soon enough. BTW, not trading advice, but this is a near flawless entry point into the VIX.
Agreed, but I still believe we are likely years from the tanking you are describing. (“Mini-tanking” will occur ala smaller but still smack down wave 4’s, next being the primary 4, and perhaps one of those tied to a smaller recession). Cycle wise the large cycle recession/depression/credit collapse/land value collapse is due mid-next decade. We need a lot of interest rate rise over time to put stress on the weak links. Then we need land values to turn tail as easy credit drops off. Then the weaks links started to strain and crack, and all heck breaks lose. Nyet. IMO. But oh yea…that’s coming sure as the sun rises in the east.
It was beginning in 2015-2016 and it was met with the largest central bank intervention in history, so it is certainly plausible it gets delayed a few years. It is also possible it starts this year.
My next possible timing may be this October.
If the structure isn’t complete by this October, then I’d give it another year to October 2019.
That’s reasonable.
Could you send me some reading material that supports your thesis (bolives1969@gmail.com)? I don’t think there’s such a thing as a flawless entry with VIX–what exactly is your time frame here? You mentioned that Lara’s call for October of this year or next as a reasonable target. I’m not even aware of any way to trade volatility that far out. I recall the week of February 5 you were saying that VIX would be in the 80s and a major bank was going to fail “by the middle of next week”. Even if all of what you say does come to pass within 2 years, that’s not exactly pinpoint accuracy.
My point is not to be overly critical but just to say that the February madness was a blindingly easy long entry point. There is virtually no bank pressure at all right now compared to 2007.
Also, if you are capturing “multiple triple digit returns” then clearly you’re just executing good risk management here rather than making prescient predictions on market movements. Once again, I refer to your assertion that VIX was going to 80 and banks were going to fail in mid February…
*note from Lara: edited slightly to be more polite. thank you for your understanding
Sounds to me Bo, like you don’t have a trading plan.
I suggested last week that traders keep an eye on overhead and lower gaps.
Lara has also provided very clear direction via the hourly charts of the wave count.
I don’t mean to be “snarky” either, but you can lead a horse to water… 🙂
I do have a plan Verne, and it’s generally to follow Lara’s calls here, which is why I’ve been more bullish than you or Chris. I am frustrated having exited some longs sooner than I should have, thinking the end of minute E was to arrive sooner rather than later. The start of this intermediate 4 came significantly sooner than the wave count predicted, so I want to be ready.
I am commenting to point out just how erroneous the short term bearishness you and Chris have been promoting is. Lara’s count called for new ATHs but by the way you were talking you’d have us assume the bear market has already started. Again, I don’t want to get snarky here, but it was so blindingly obvious that the February nonsense was not the start of a prolonged bear market that practically any trader could have made money on it.
Lara’s recent Grand Super Cycle analysis calls for a top at the soonest this October, and possible significantly after that. But I was told banks were going to fail and VIX was going to 90 by the end of this February… yeah, not so much.
I am confused. If you are following the wave count as your main plan you should have been positioned long instead of looking for a pullback as you stated. It does you no good to carp about bearish opinions of other people on the forum like Chris and me if such opinions distract you from devising a trading plan and being disciplined in following it. Whetheryou understand or agree with the views we express, we generally provide reasons for our opinions, and in that regard are no different than other members expressing an opinion.
FWIW, the waves continue to exibit corrective qualities, and for some traders with less experience
the wisest thing to do is sit out the consolidation. I don’t mean to
be critical, but I just did not understand your expressed frustration after how clear the last two analyses were.
I’ll leave the last few comments here as it’s remaining mostly polite. Just a very gentle reminder folks to keep all comments always as polite as you can possibly make them.
Your Grandmother and all that…. speak to each other here as if you would to a beloved Grandmother.
Lara’s analysis the past two days considered a strong possibility of a pullback. I chose to exit some longs yesterday, and today we had a 1% up day. I am not sure why you are criticizing my trading plan, I don’t see how that’s relevant here. I am just pointing out why I was skeptical of some of the extremely bearish viewpoints around here back in February. The calls for an imminent bear market were clearly incorrect, and I am just pointing out that I was right to be bullish despite the flack I got for it here. Eventually the people who have been calling for a bear market the last 10 years will be right. But I am not going to be particularly impressed since many of them have been calling tops literally every year since 2009.
What I am saying is that I am slightly tired of the constant calls for a new bear market every single time there is a pullback. A big part of what I like about Lara’s analysis is that there is bigger picture, rather than just claiming the sky is falling every time there is a dip. When members here who claim to be making triple digit gains claim that a collapse is imminent it does cause me to hesitate holding longs, although I guess that’s my fault for not just ignoring the comments here.
Hope that clears it up.
Take what I say in the spirit intended, as I am trying to help you.
Exiting a trade when you are positioned with the current trend just because you expect a pullback , for most folk, is not the way to trade successfully.
You stay with the current trend until and unless it changes.
Emotion will destroy you as a trader.
Mr. Market does not care that you are tired about what other people are saying he will or will not do. Your trades are your own responsibility as the money is yours to loose or trade successfully.
Hopefully as you learn from your own mistakes, you will be in a position to offer helpful commentary to other traders rather than just criticize what others have to say. O.K I have said my piece and am done. Hope that helps a little.
Just for anyone that might be interested:
WTI crude looks like it completed a 5 wave down today from highs, now having an abc correction up on the 5 minute chart.
Might be ripe for a short if/when it tops today’s highs… overall looks like a bull market, but due for a correction.
You can refer to Lara’s oil analysis in her gold section, or if you subscribe to her weekly update…
Ari my $0.02 re: WTI: The weekly momentum is up, the daily is up, the hourly is up, and even the 5 minute has mostly been up today. Any pullback in this setup is a potential buy setup for me, not an opportunity to trigger in shorts.
Yes I see that now too. Such a hard bounce from today’s lows…
Thanks for your input
Two critical fibos at 2697.6 and 2704.4
and…the descending upper bollinger and keltner’s are going to run into SPX right at about…2797-2704, most likely. Then there’s the Feb 22 and Mar 19 lows, at 2698 and 2694. Definitely key resistance and a shortable zone on a turn and sell triggers.
The upper keltner and BB’s are higher above the immediate resistance, 2728 or so. Meanwhile, price currently paused right in heart of the resistance zone…it should be very interesting. The triangle line coming down is up there around 2740.
Hi Kevin
Im confused the SPX broke through the 2797 – 2704 Zone.
Do you think we will make it to the the 2740 zone?
If so would you consider shorting SPX at or near those levels?
Thank You
I don’t know but based on general market strength here, perhaps. I do think some bollinger band/keltner channel resistance might turn the market before there though. As for shorting, I don’t just short when price gets into a “zone”. I want to see a TURN DOWN from a key resistance zone, and then some sell triggers (essentially, some confirming downward movement). So…maybe.