Upwards movement was expected again for Friday. The session began with a gap higher, but thereafter moved lower to close red. Price remains above the invalidation point.
Summary: A new low below 2,639.25 would indicate more downwards movement, and the target would be between 2,586.27 and 2,553.80. A bearish signal from On Balance Volume, failure for price to close above resistance, declining ATR for the last three sessions, and a lack of support from volume for rising price all support this view. The alternate hourly Elliott wave count now looks more likely.
A new high above 2,680.26 would indicate more upwards movement, and the target would be at 2,705 or a range from 2,752 to 2,766. Some bullish divergence with VIX offers just a little support to this view. There are now clusters of bullish signals on VIX and the AD line.
Always practice good risk management. Always trade with stops and invest only 1-5% of equity on any one trade.
New updates to this analysis are in bold.
The biggest picture, Grand Super Cycle analysis, is here.
Last historic analysis with monthly charts is here. Video is here.
An alternate idea at the monthly chart level is given here at the end of this analysis.
An historic example of a cycle degree fifth wave is given at the end of the analysis here.
MAIN ELLIOTT WAVE COUNT
WEEKLY CHART
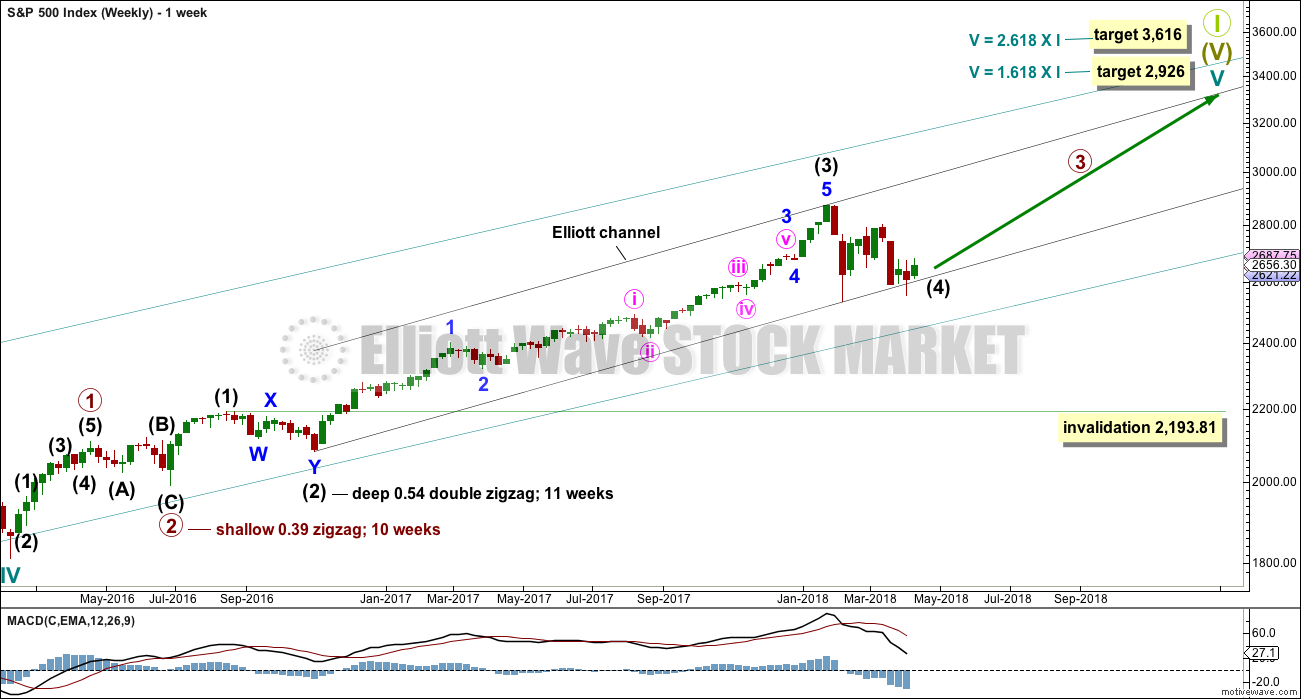
Cycle wave V must complete as a five structure, which should look clear at the weekly chart level. It may only be an impulse or ending diagonal. At this stage, it is clear it is an impulse.
Within cycle wave V, the third waves at all degrees may only subdivide as impulses.
Intermediate wave (4) has breached an Elliott channel drawn using Elliott’s first technique. The channel is redrawn using Elliott’s second technique as if intermediate wave (4) was over at the first swing low within it. If intermediate wave (4) continues sideways, then the channel may be redrawn when it is over. The upper edge may provide resistance for intermediate wave (5).
Intermediate wave (4) may not move into intermediate wave (1) price territory below 2,193.81. However, it would be extremely likely to remain within the wider teal channel (copied over from the monthly chart) if it were to be reasonably deep. This channel contains the entire bull market since the low in March 2009, with only two small overshoots at the end of cycle wave IV. If this channel is breached, then the idea of cycle wave V continuing higher would be discarded well before the invalidation point is breached.
At this stage, it now looks like intermediate wave (4) may be continuing further sideways as a combination, triangle or flat. These three ideas are separated into separate daily charts. All three ideas would see intermediate wave (4) exhibit alternation in structure with the double zigzag of intermediate wave (2).
A double zigzag would also be possible for intermediate wave (4), but because intermediate wave (2) was a double zigzag this is the least likely structure for intermediate wave (4) to be. Alternation should be expected until price proves otherwise.
DAILY CHART – TRIANGLE
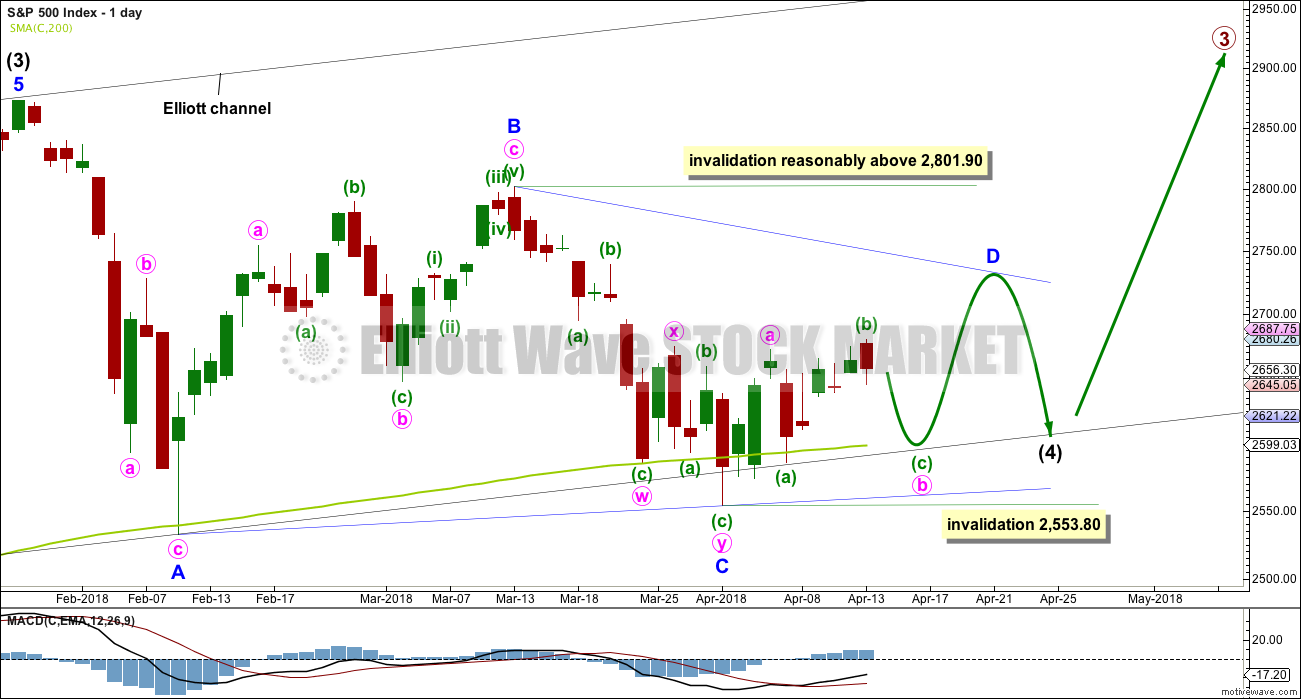
This first daily chart looks at a triangle structure for intermediate wave (4). The triangle may be either a regular contracting or regular barrier triangle. Within the triangle, minor waves A, B and C may be complete.
If intermediate wave (4) is a regular contracting triangle, the most common type, then minor wave D may not move beyond the end of minor wave B above 2,801.90.
If intermediate wave (4) is a regular barrier triangle, then minor wave D may end about the same level as minor wave B at 2,801.90. As long as the B-D trend line remains essentially flat a triangle will remain valid. In practice, this means the minor wave D can end slightly above 2,801.90 as this rule is subjective.
When a zigzag upwards for minor wave D is complete, then this wave count would expect a final smaller zigzag downwards for minor wave E, which would most likely fall reasonably short of the A-C trend line.
If this all takes a further two weeks to complete, then intermediate wave (4) may total a Fibonacci 13 weeks and would be just two weeks longer in duration than intermediate wave (2). There would be very good proportion between intermediate waves (2) and (4), which would give the wave count the right look. However, two more weeks at this time does not look like it may be long enough for a triangle to complete. It may not exhibit a Fibonacci duration.
There are now a few overshoots of the 200 day moving average. This is entirely acceptable for this wave count; the overshoots do not mean price must now continue lower. The A-C trend line for this wave count should have a slope, so minor wave C should now be over.
Within the zigzag of minor wave D, minute wave b may not move beyond the start of minute wave a below 2,553.80.
The arrow is adjusted today on this chart to best fit the alternate hourly chart below. This now looks more likely.
MAIN HOURLY CHART
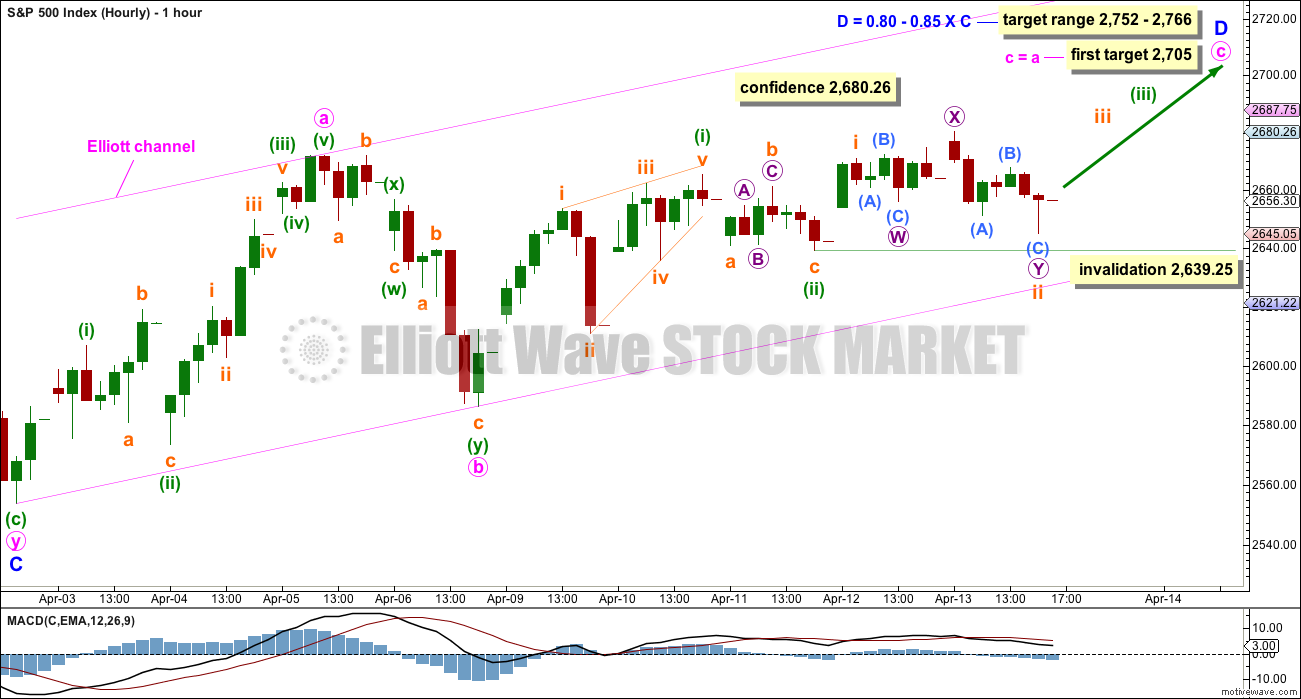
If price makes a new high above 2,680.26, then use this main wave count.
Minor wave D upwards should subdivide as a zigzag. Within the zigzag, minute wave b now shows up on the daily chart as a large red daily candlestick. This would give minor wave D an obvious three wave look on the daily chart, which should be expected.
Minute wave b subdivides as a completed double zigzag. The most common Fibonacci ratio is used to calculate a target for minute wave c.
Minute wave c must subdivide as a five wave structure. So far within it there may now be two overlapping first and second waves complete, labelled minuette waves (i) and (ii), and now subminuette waves i and ii. This wave count expects to see an increase in upwards momentum as the middle of a low degree third wave unfolds.
Subminuette wave ii may not move beyond the start of subminuette wave i below 2,639.25.
The target at 2,705 may not be high enough to allow enough room for the structure of minute wave c to complete. If price keeps rising through this target, then use the target zone.
ALTERNATE HOURLY CHART
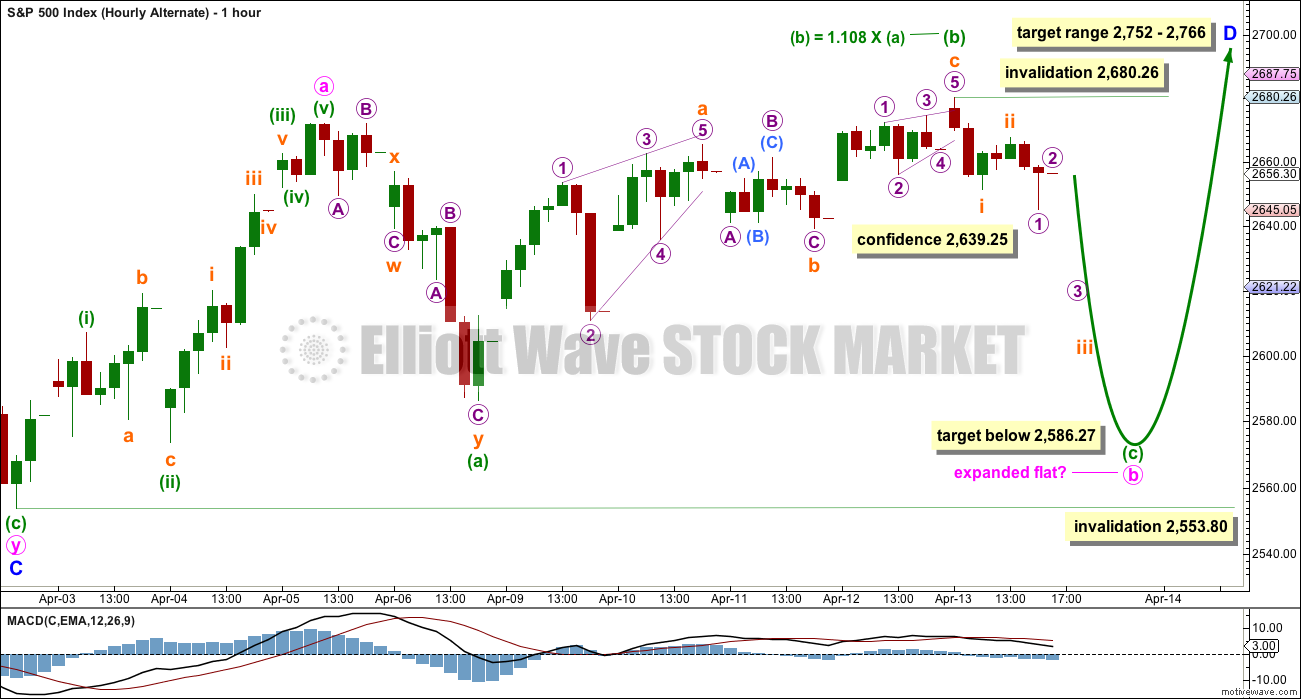
If price makes a new low below 2,639.25, then use this alternate wave count. Expect a deep pullback. This hourly wave count now has more support from classic technical analysis.
By simply moving the degree of labelling down within the last downwards wave, it is possible that minute wave b may be incomplete.
If minute wave b has begun with a double zigzag downwards for minuette wave (a), then it may be either a flat or a triangle. A flat is more common, so that shall be how this chart is labelled.
Within the flat correction, minuette wave (b) has passed the minimum requirement of 0.9 the length of minuette wave (a). The common range for minuette wave (b) would be from 1 to 1.38 times the length of minuette wave (a).
Minuette wave (b) may now be a complete zigzag.
This wave count now expects a large downwards wave for minuette wave (c). Minuette wave (c) would be highly likely to make at least a slight new low below the end of minuette wave (a) at 2,586.27 to avoid a truncation and a very rare running flat.
A target calculation for minuette wave (c) to end using 1.618 the length of minuette wave (a) yields an invalid target. A target for minuette wave (c) to end may need to be calculated at subminuette degree.
Minute wave b may not move beyond the start of minute wave a below 2,553.80.
Within minuette wave (c), no second wave correction may move beyond the start of its first wave above 2,680.26.
DAILY CHART – COMBINATION
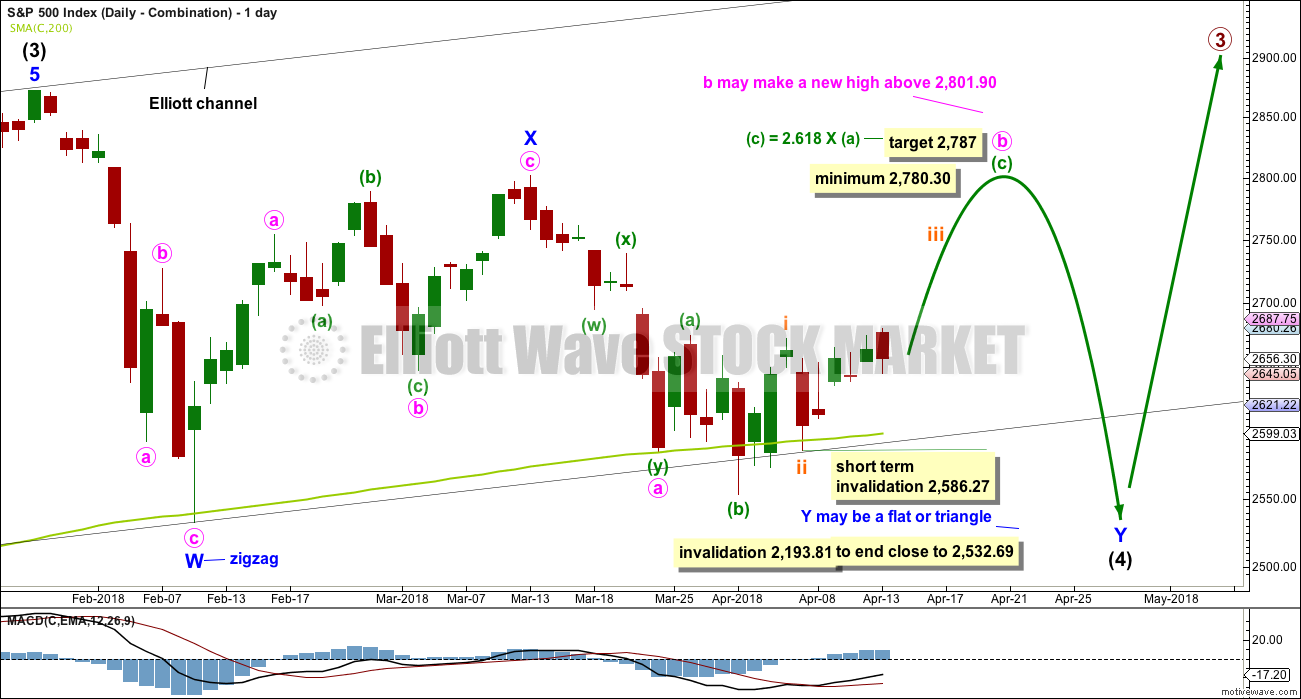
Double combinations are very common structures. The first structure in a possible double combination for intermediate wave (4) would be a complete zigzag labelled minor wave W. The double should be joined by a three in the opposite direction labelled minor wave X, which may be a complete zigzag. X waves within combinations are typically very deep; if minor wave X is over at the last high, then it would be a 0.79 length of minor wave W, which is fairly deep giving it a normal look. There is no minimum nor maximum requirement for X waves within combinations.
The second structure in the double would most likely be a flat correction labelled minor wave Y. It may also be a triangle, but in my experience this is very rare, so it will not be expected. The much more common flat for minor wave Y will be charted and expected.
A flat correction would subdivide 3-3-5. Minute wave a must be a three wave structure, most likely a zigzag. It may also be a double zigzag. On the hourly chart, this is now how this downwards movement fits best, and this will now be how it is labelled.
Minute wave b must now reach a minimum 0.90 length of minute wave a. Minute wave b must be a corrective structure. It may be any corrective structure. It may be unfolding as an expanded flat correction. A target is calculated for it to end. Within minuette wave (c), subminuette waves i and ii may now be complete. Within subminuette wave iii, no second wave correction may move beyond its start below 2,586.27.
The purpose of combinations is to take up time and move price sideways. To achieve this purpose the second structure in the double usually ends close to the same level as the first. Minor wave Y would be expected to end about the same level as minor wave W at 2,532.69. This would require a strong overshoot or breach of the 200 day moving average, which looks unlikely.
DAILY CHART – FLAT
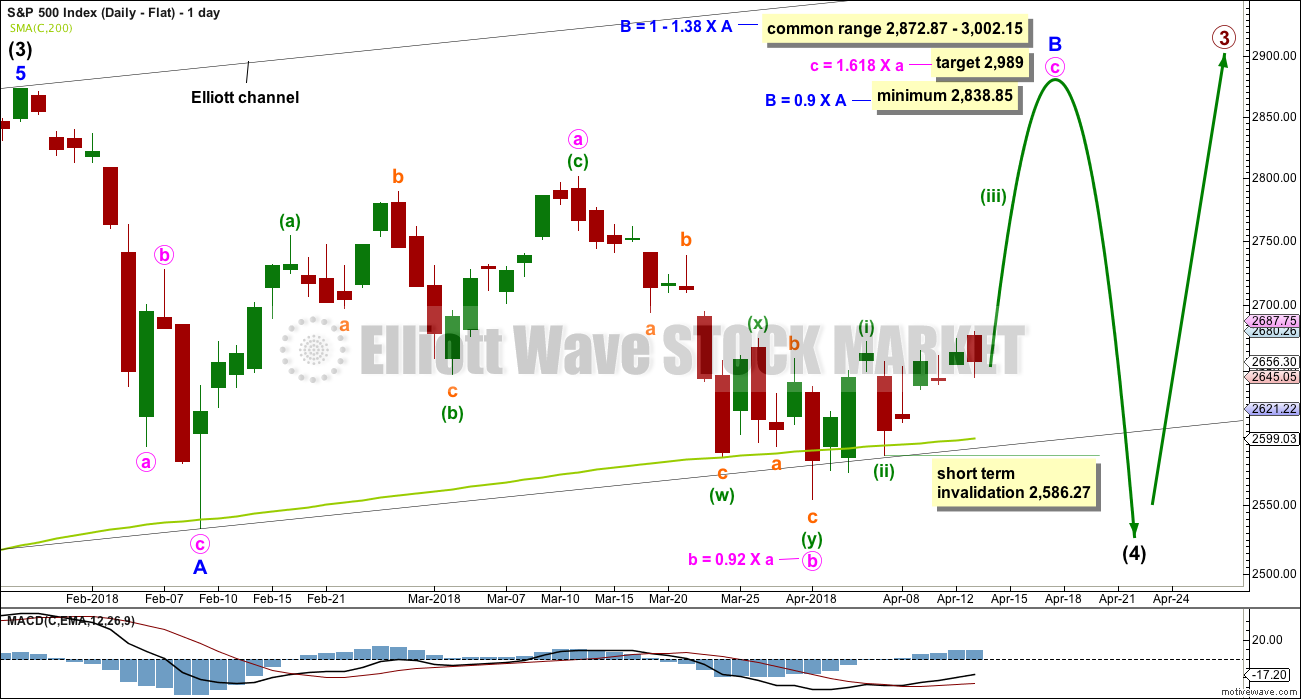
Flat corrections are very common. The most common type of flat is an expanded flat. This would see minor wave B move above the start of minor wave A at 2,872.87.
Within a flat correction, minor wave B must retrace a minimum 0.9 length of minor wave A at 2,838.85. The most common length for minor wave B within a flat correction would be 1 to 1.38 times the length of minor wave A at 2,872.87 to 3,002.15. An expanded flat would see minor wave B 1.05 times the length of minor wave A or longer, at 2,889.89 or above. A target is today calculated for minor wave B to end, which would see it end within the common range.
Minor wave B may be a regular flat correction, and within it minute wave a may have been a single zigzag and minute wave b may have been a double zigzag. This has a very good fit. The subdivisions at the hourly chart level at this stage would be the same for the last wave down as the main wave count.
This wave count would require a very substantial breach of the 200 day moving average for the end of intermediate wave (4). This is possible but may be less likely than a smaller breach.
TECHNICAL ANALYSIS
WEEKLY CHART
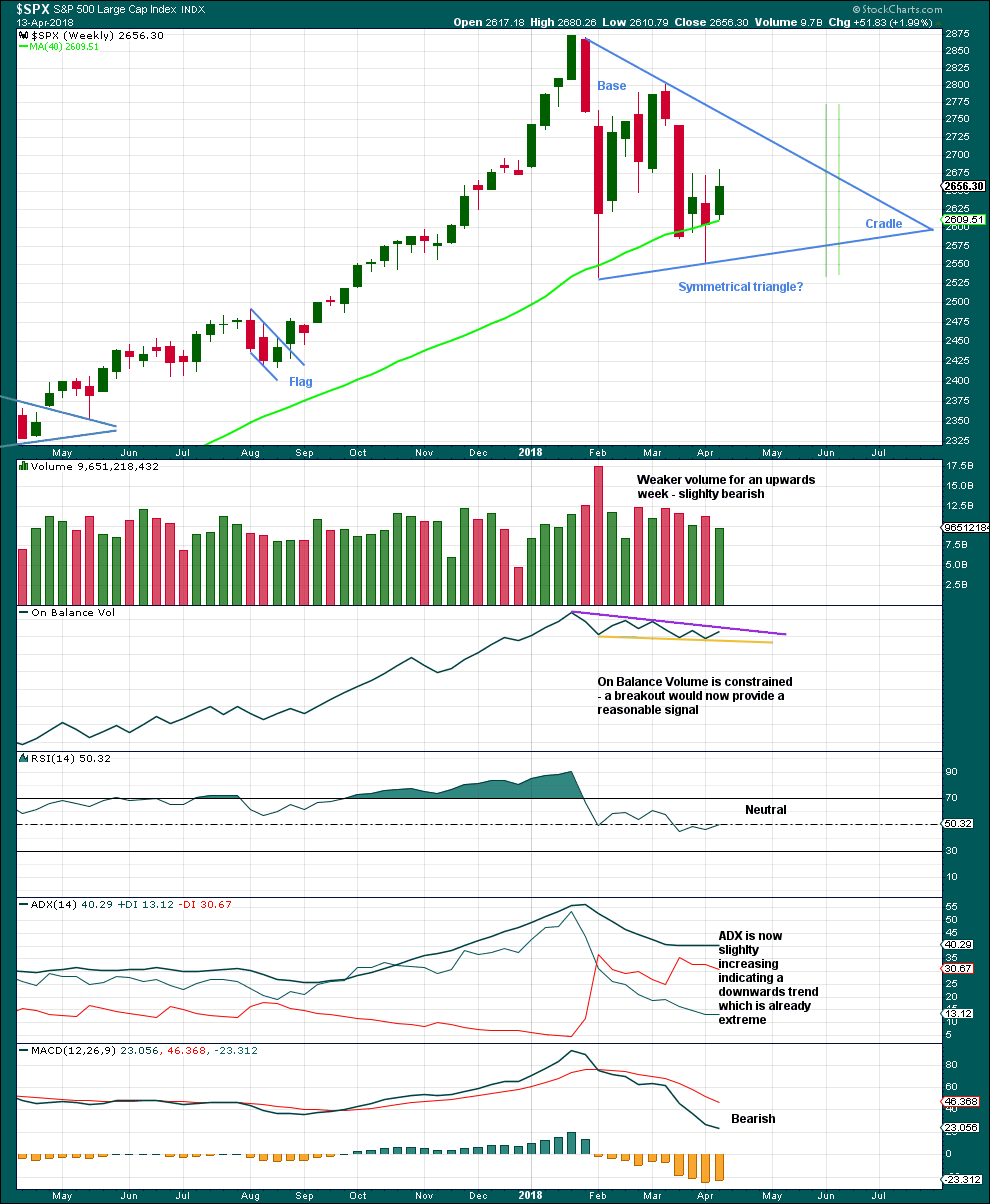
Click chart to enlarge. Chart courtesy of StockCharts.com.
A classic symmetrical triangle pattern may be forming. These are different to Elliott wave triangles. Symmetrical triangles may be either continuation or reversal patterns, while Elliott wave triangles are always continuation patterns and have stricter rules.
The vertical green lines are 73% to 75% of the length of the triangle from cradle to base, where a breakout most commonly occurs.
From Dhalquist and Kirkpatrick on trading triangles:
“The ideal situation for trading triangles is a definite breakout, a high trading range within the triangle, an upward-sloping volume trend during the formation of the triangle, and especially a gap on the breakout.”
For this example, the breakout has not yet happened. There is a high trading range within the triangle, but volume is declining.
The triangle may yet have another 8 – 9 weeks if it breaks out at the green lines.
Before that happens though On Balance Volume may give a signal. It must give a signal in the next one to very few weeks as the trend lines are converging.
DAILY CHART
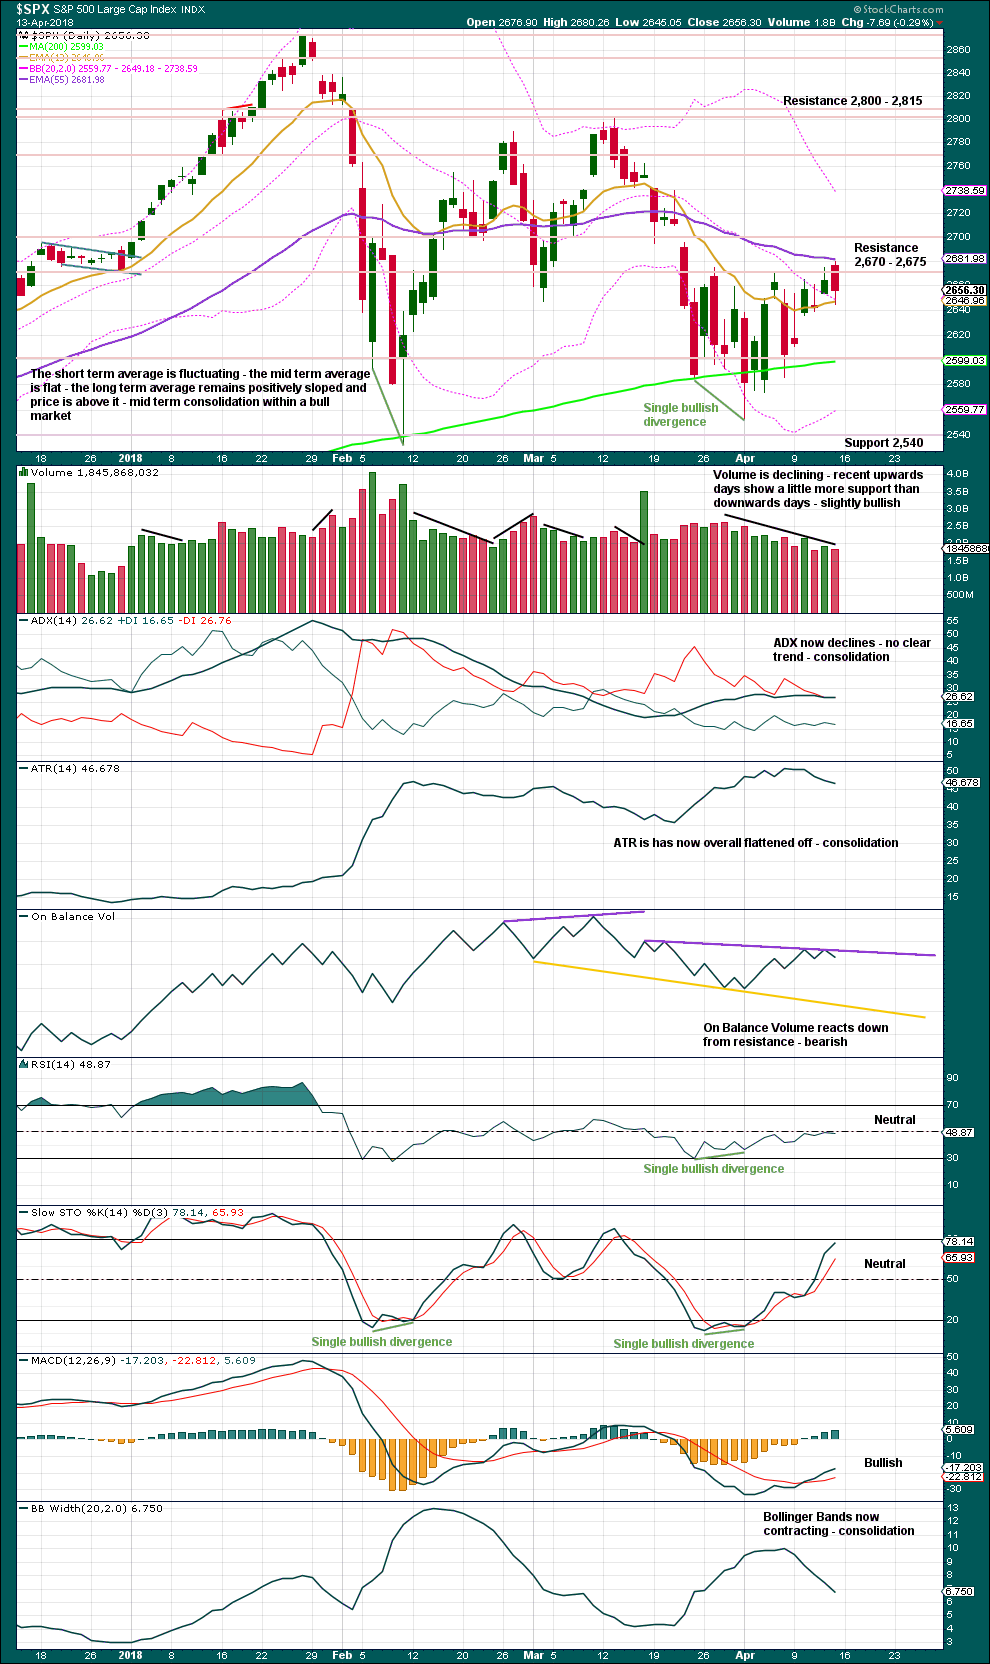
Click chart to enlarge. Chart courtesy of StockCharts.com.
Price has not managed yet to close above resistance. Volume is declining as price rises overall. On Balance Volume gives a bearish signal. It looks most likely that the alternate hourly Elliott wave may be correct here.
VOLATILITY – INVERTED VIX CHART
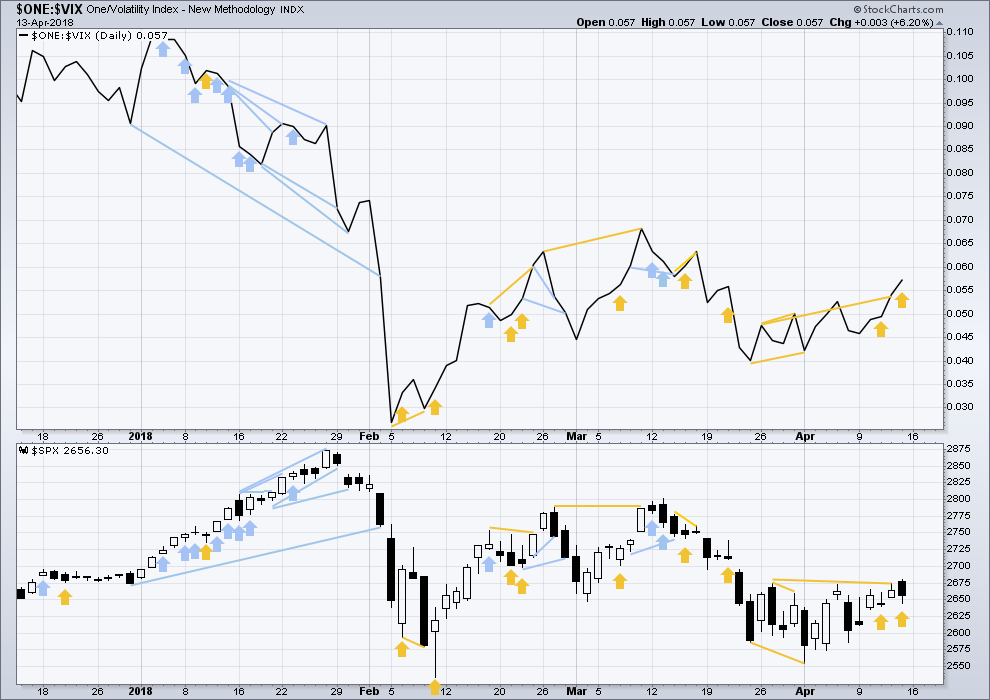
Click chart to enlarge. Chart courtesy of StockCharts.com.
So that colour blind members are included, bearish signals will be noted with blue and bullish signals with yellow.
Normally, volatility should decline as price moves higher and increase as price moves lower. This means that normally inverted VIX should move in the same direction as price.
While price moved lower during most of Friday’s session, this has not come with a normal corresponding increase in VIX. VIX has declined. This divergence is bullish, and it is not weak.
BREADTH – AD LINE
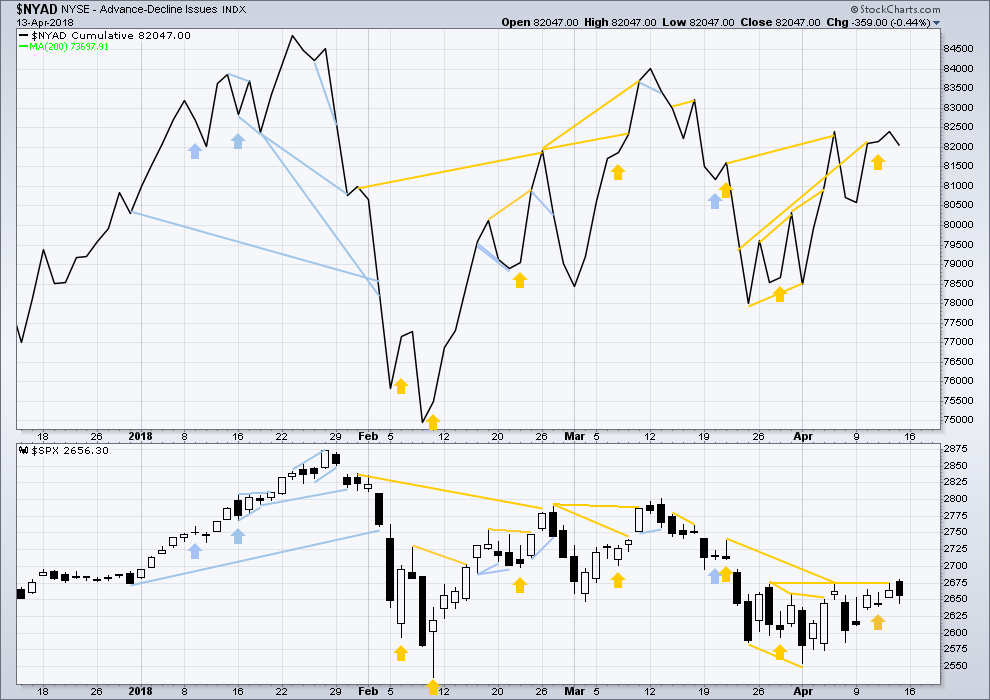
Click chart to enlarge. Chart courtesy of StockCharts.com.
There is normally 4-6 months divergence between price and market breadth prior to a full fledged bear market. This has been so for all major bear markets within the last 90 odd years. With no longer term divergence yet at this point, any decline in price should be expected to be a pullback within an ongoing bull market and not necessarily the start of a bear market.
All of small, mid and large caps this week moved higher. There is no divergence to indicate underlying weakness.
Breadth should be read as a leading indicator.
Price moved lower for much of Friday’s session and has support from declining market breadth. This is bearish.
DOW THEORY
The following lows need to be exceeded for Dow Theory to confirm the end of the bull market and a change to a bear market:
DJIA: 23,360.29.
DJT: 9,806.79.
S&P500: 2,532.69.
Nasdaq: 6,630.67.
At this stage, only DJIA has made a new major swing low. DJT also needs to make a new major swing low for Dow Theory to indicate a switch from a bull market to a bear market. For an extended Dow Theory, which includes the S&P500 and Nasdaq, these two markets also need to make new major swing lows.
Charts showing each prior major swing low used for Dow Theory may be seen at the end of this analysis here.
Published @ 05:55 a.m. EST on 14th April, 2018.

I am still inclined to take the bearish view here with looks like a very nice technical top. I have resistance stemming from the 50dma as well as what looks to me like the end of a bearish pennant formation. I have VIX support right around 16.5 as well. Most compelling to me is the recent action from the AD line where extreme upward levels have been followed by significant down days 3 times in the last month. The incredibly low volume here is a big red flag for me as well. I know declining volume hasn’t meant much for this bull market, but I would have thought the Syria relief rally would have had more oomph.
That being said, NFLX’s action after earnings throws a wrench into this. Looks like a pretty big beat. Last quarter, that heralded a massive upwards week for tech, though in hindsight that ended up being the overall market top for SPX, LOL! Leads me to believe we may or may not see more of the same here. There is at least some degree of resistance for NFLX to overcome at its ATH (which wasn’t the case last time around).
Also FYI this implies I am following the alternate, with this being the end of minuette B of minor B.
I was noting myself that while primary markets rallied today…it was still in the “weak” catagory relative to recent action, and still “upward narrowing wedge” like (what you call a bearish pennant). Generally, I think the next slam down is now at least minimally set up. How much more up before the turn and sell off I don’t know, but I think it’s a “be ready” situation. The political situation in the US is extremely unstable, and lots of instability otherwise with possiblities of “bad” surprises, any of which could launch another -3% day I suspect.
Updated hourly chart:
It’s the main count. Winning so far.
Look like this market is back to it’s old tricks of rising on declining volume with lower ATR. Weak upwards movement, but it continues nonetheless.
Dow Jones Industrial Average
Keeps pushing up to the long term trend line.
Today it broke above it then came back down to its underbelly.
Any thoughts
Congrats Lara on your new book coming out i would like to get a copy.
Thank You
Its really quite here today.
I guess everyone is waiting for SPX to break above 2700
Any thoughts
Thanks
too busy buying and selling…and helping my son with his taxes, gak!!! All I note is the obvious: per Lara’s advice, Friday’s high taken out and push past 2680 -> likely going up now (in general) to at least the upper triangle line (2750ish?). So it’s a buyers market for short term traders as I see it. A lot of issues seem “extended” in the very short term…but then some of them have histories of running like crazy (PX, great example).
Thank You Kevin
I believe GBTC (exchanged traded bitcoin) has completed it’s first 5 wave up after a 1-2 off a bottom, and is initiating an ABC correction which should set up a new high quality entry point.
Thanks for the update on that Kevin. I’m watching it.
What are your thoughts on GS at the moment. It seems like 260-262 area has strong resistance… earnings are due on Wednesday I believe…
GS is (like all of finance) underperforming. I hold a little, and will probably hold through Wed. However, overall, I don’t think it’s a good short term trade right now, unless it shows signs of making a strong upward break. There are many stronger sectors and issues to take advantage of. Materials for example (PX, DWDP, ECL…). Not necessarily immediate buys, but very strong in general at moment and over last few weeks relatively.
The early bird gets the worm. But I don’t like worms! First for the weekend, a very special prize.
There is a bit of disagreement as to which wave of a triangle is the most complex. Well, I think both waves C & D tend towards relative complexity. The current Minor D is proving to be quite complex. Traders beware.
According to Frost and Prechter it’s C that’s most often complex.
One of the things on my list is to go over 20+ years of daily data for the S&P and Gold (maybe Oil too) and identify all the triangles I can find, then calculate most common wave length and check subdivisions, which is the most complicated wave and how often do flats turn up in them.
I want to get that done before I complete my book, which is one reason the book is so long delayed. It’s daunting.
Wow, Lara, I don’t recall hearing about you writing a book. What an undertaking! No doubt it will become the new definitive EW text! F&P, stand aside!
Crikey. I would only hope that it may be an addition to an EW library.
My goal is to make a book that is clearer with rules and guidelines. I did always find the classic to require a bit too much interpretation.
Right on. I am looking forward to acquiring my copy with the author’s signature.
Add me to that list!!
I assume (hope) the book will also address the critical need to have alternative counts, and how to assess their relative probabilities (including through the use of technical analysis as a supporting tool). I don’t remember anything along those lines in EWP. Hope I’m not suggesting adding a few more years to the effort…
I’ll bet you $1 Rodney (to be paid at an indefinite time in the future) that this thing does NOT resolve as a triangle. If you were smart, you’d force me to pick WHAT it will resolve as, but for that, the bet must reduce to $0.50, and I will choose the COMBINATION as the final structure. And I’m expecting a low around 2466 and I will start scaling in long at size (well, at size for me, not for the rabbit) right there…looking forward to it!
Dearest Kevin,
Just to be a fun loving guy, I will accept your wager for $1. However, I have said for the last month my enticement point to buy will be 2450 right in line with your projected low. I hope you are correct and I will gladly fork over a greenback. It is hardly worth anything these days anyways.
Yours truly,
Lightning Rod
PS – Its on!
Signed in blood here Rodney…either way, we start shoving around 2450-70, however we get there! One of us gets to shove an extra $.
This sounds like the “Coming to America” movie with Eddie Murphy from the 80’s. Lol 🙂
I’m in Doc!