
Upwards movement was expected, and so far overall what is happening.
There is strong resistance at this point to be overcome before the target can be reached.
Summary: If resistance about 2,670 – 2,675 can be overcome, then the upwards swing should continue. The first target is at 2,705. If price keeps rising through the first target, then the next target is a zone from 2,752 to 2,766. Do not expect an upwards swing here to move in a straight line. Price is normally choppy and overlapping in swings within consolidations, and this market at this time is consolidating.
For the short term, the upwards structure for both hourly wave counts is incomplete and more upwards movement is needed. This is supported today by bullish divergence between price and On Balance Volume and the AD line and VIX.
Always practice good risk management. Always trade with stops and invest only 1-5% of equity on any one trade.
New updates to this analysis are in bold.
The biggest picture, Grand Super Cycle analysis, is here.
Last historic analysis with monthly charts is here. Video is here.
An alternate idea at the monthly chart level is given here at the end of this analysis.
An historic example of a cycle degree fifth wave is given at the end of the analysis here.
MAIN ELLIOTT WAVE COUNT
WEEKLY CHART
Click chart to enlarge.
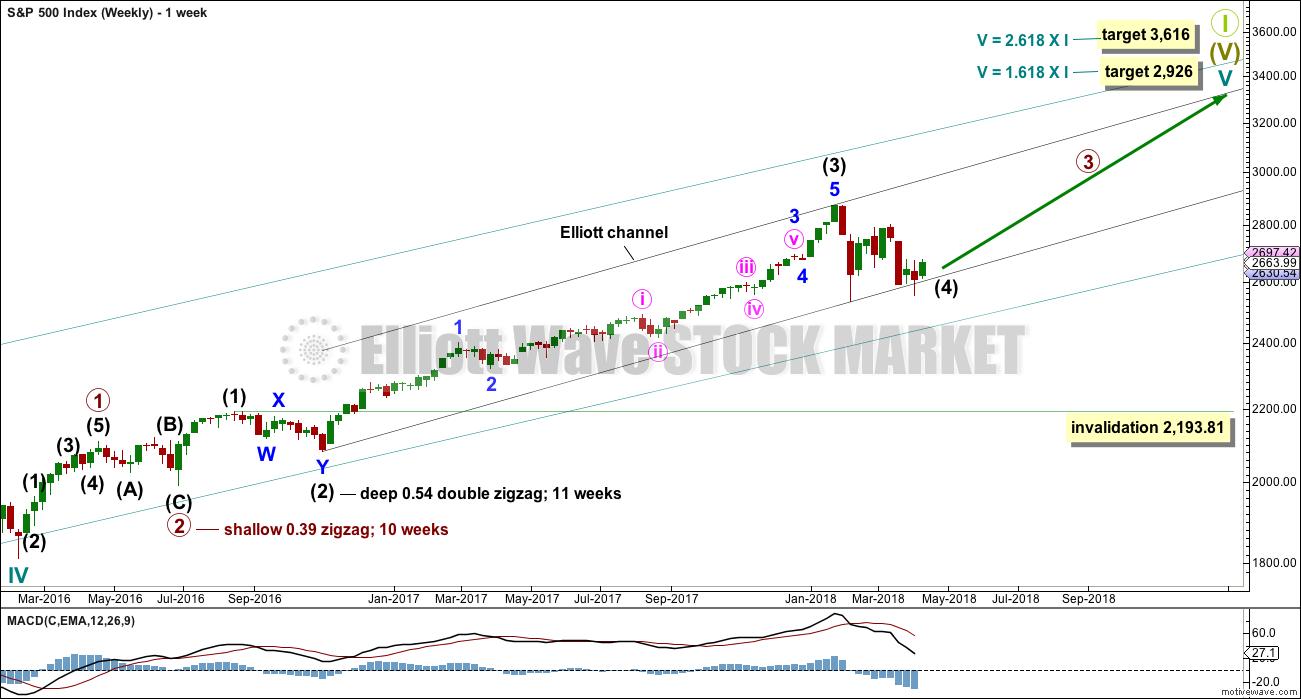
Cycle wave V must complete as a five structure, which should look clear at the weekly chart level. It may only be an impulse or ending diagonal. At this stage, it is clear it is an impulse.
Within cycle wave V, the third waves at all degrees may only subdivide as impulses.
Intermediate wave (4) has breached an Elliott channel drawn using Elliott’s first technique. The channel is redrawn using Elliott’s second technique as if intermediate wave (4) was over at the first swing low within it. If intermediate wave (4) continues sideways, then the channel may be redrawn when it is over. The upper edge may provide resistance for intermediate wave (5).
Intermediate wave (4) may not move into intermediate wave (1) price territory below 2,193.81. However, it would be extremely likely to remain within the wider teal channel (copied over from the monthly chart) if it were to be reasonably deep. This channel contains the entire bull market since the low in March 2009, with only two small overshoots at the end of cycle wave IV. If this channel is breached, then the idea of cycle wave V continuing higher would be discarded well before the invalidation point is breached.
At this stage, it now looks like intermediate wave (4) may be continuing further sideways as a combination, triangle or flat. These three ideas are separated into separate daily charts. All three ideas would see intermediate wave (4) exhibit alternation in structure with the double zigzag of intermediate wave (2).
A double zigzag would also be possible for intermediate wave (4), but because intermediate wave (2) was a double zigzag this is the least likely structure for intermediate wave (4) to be. Alternation should be expected until price proves otherwise.
DAILY CHART – TRIANGLE
Click chart to enlarge.
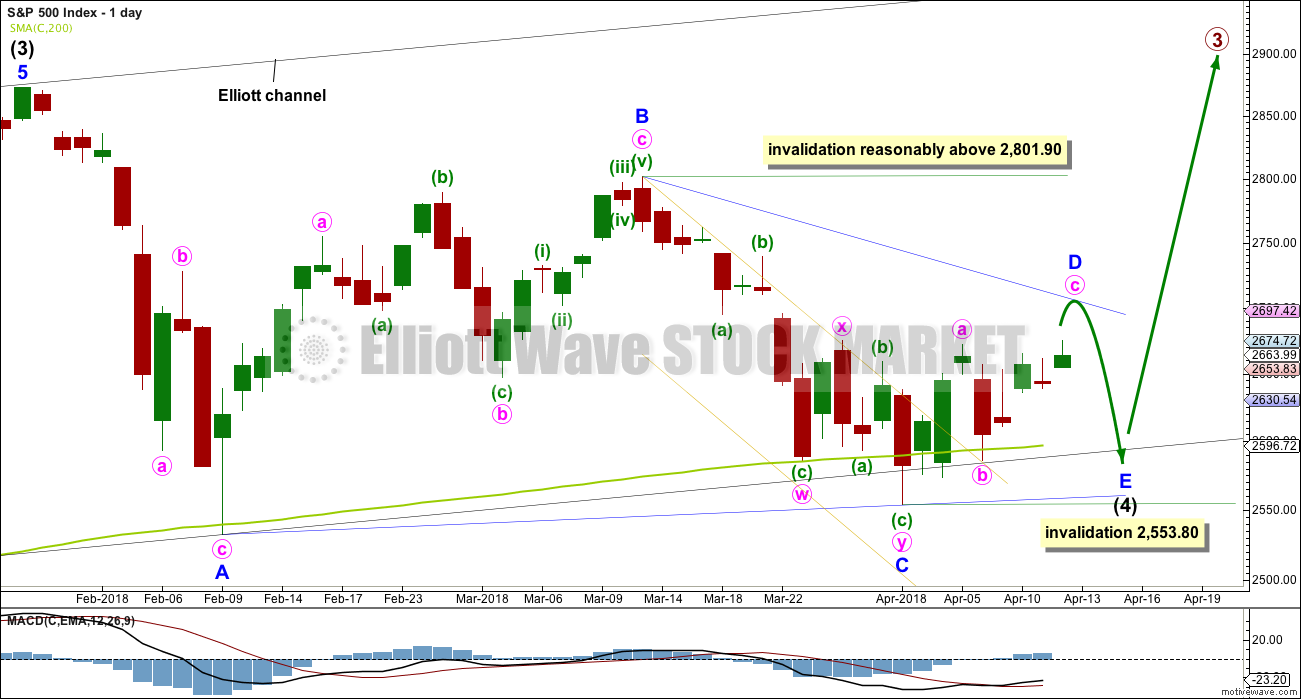
This first daily chart looks at a triangle structure for intermediate wave (4). The triangle may be either a regular contracting or regular barrier triangle. Within the triangle, minor waves A, B and C may be complete.
If intermediate wave (4) is a regular contracting triangle, the most common type, then minor wave D may not move beyond the end of minor wave B above 2,801.90.
If intermediate wave (4) is a regular barrier triangle, then minor wave D may end about the same level as minor wave B at 2,801.90. As long as the B-D trend line remains essentially flat a triangle will remain valid. In practice, this means the minor wave D can end slightly above 2,801.90 as this rule is subjective.
When a zigzag upwards for minor wave D is complete, then this wave count would expect a final smaller zigzag downwards for minor wave E, which would most likely fall reasonably short of the A-C trend line.
If this all takes a further three weeks to complete, then intermediate wave (4) may total a Fibonacci 13 weeks and would be just two weeks longer in duration than intermediate wave (2). There would be very good proportion between intermediate waves (2) and (4), which would give the wave count the right look.
There are now a few overshoots of the 200 day moving average. This is entirely acceptable for this wave count; the overshoots do not mean price must now continue lower. The A-C trend line for this wave count should have a slope, so minor wave C should now be over.
Within the zigzag of minor wave D, minute wave b may not move beyond the start of minute wave a below 2,553.80.
HOURLY CHART
Click chart to enlarge.
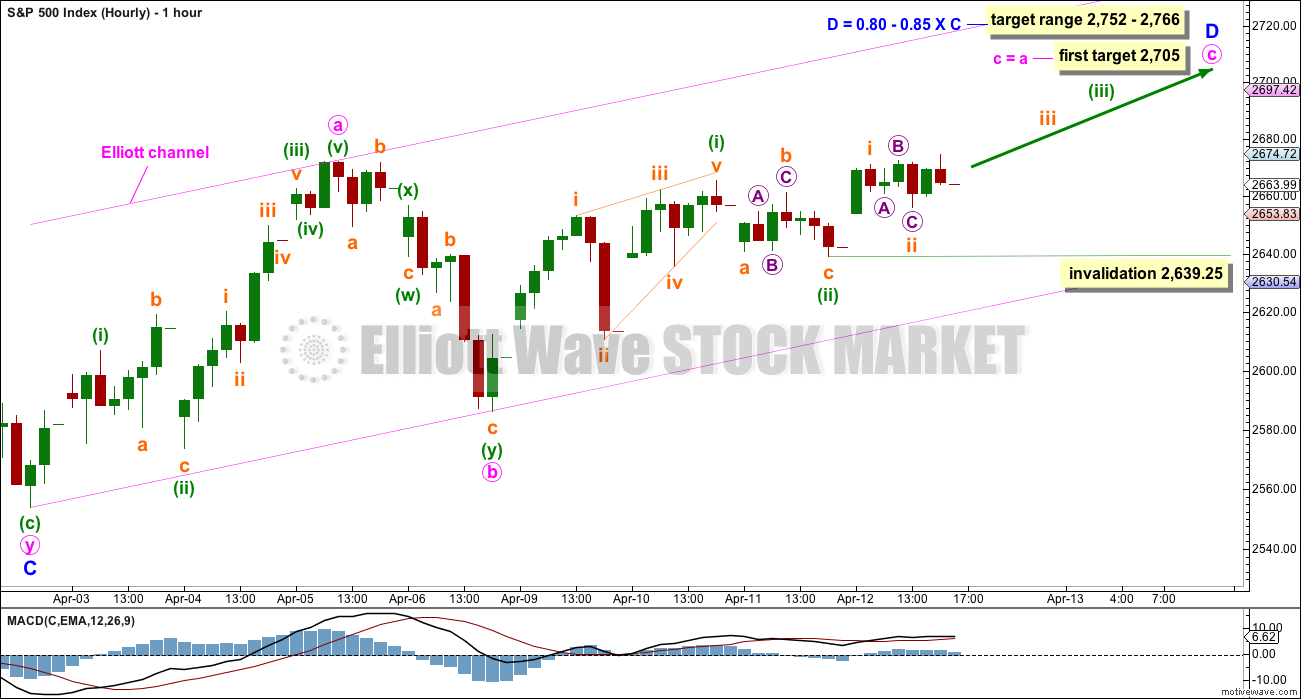
Minor wave D upwards should subdivide as a zigzag. Within the zigzag, minute wave b now shows up on the daily chart as a large red daily candlestick. This would give minor wave D an obvious three wave look on the daily chart, which should be expected.
Minute wave b subdivides as a completed double zigzag. The most common Fibonacci ratio is used to calculate a target for minute wave c.
Minute wave c must subdivide as a five wave structure. So far within it there may now be two overlapping first and second waves complete, labelled minuette waves (i) and (ii), and now subminuette waves i and ii. This wave count expects to see an increase in upwards momentum tomorrow as the middle of a low degree third wave unfolds.
Within subminuette wave iii, no second wave correction may move beyond its start below 2,639.25.
The target at 2,705 may not be high enough to allow enough room for the structure of minute wave c to complete. If price keeps rising through this target, then use the target zone.
ALTERNATE HOURLY CHART
Click chart to enlarge.
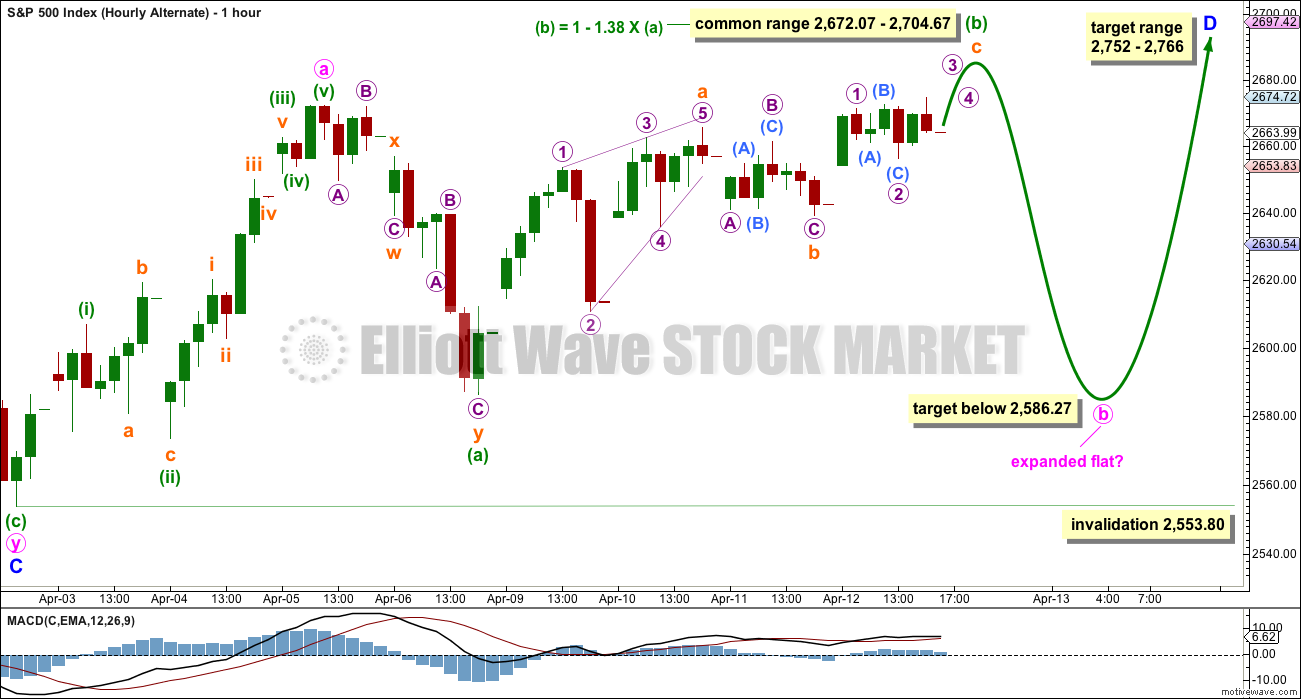
By simply moving the degree of labelling down within the last downwards wave, it is possible that minute wave b may be incomplete.
If minute wave b has begun with a double zigzag downwards for minuette wave (a), then it may be either a flat or a triangle. A flat is more common, so that shall be how this chart is labelled.
Within the flat correction, minuette wave (b) has passed the minimum requirement of 0.9 the length of minuette wave (a). The common range for minuette wave (b) would be from 1 to 1.38 times the length of minuette wave (a).
Minuette wave (b) may be subdividing as a zigzag. Within the zigzag, subminuette wave c must complete as a five wave structure. This now looks incomplete with the slight new high at the end of this session.
When minuette wave (b) is a complete zigzag, then this wave count would expect a trend change and a large downwards wave for minuette wave (c). Minuette wave (c) would be highly likely to make at least a slight new low below the end of minuette wave (a) at 2,586.27 to avoid a truncation and a very rare running flat.
When minuette wave (b) is complete, then a target may be calculated for minuette wave (c) using a Fibonacci ratio to minuette wave (a). That cannot be done yet.
Minute wave b may not move beyond the start of minute wave a below 2,553.80.
DAILY CHART – COMBINATION
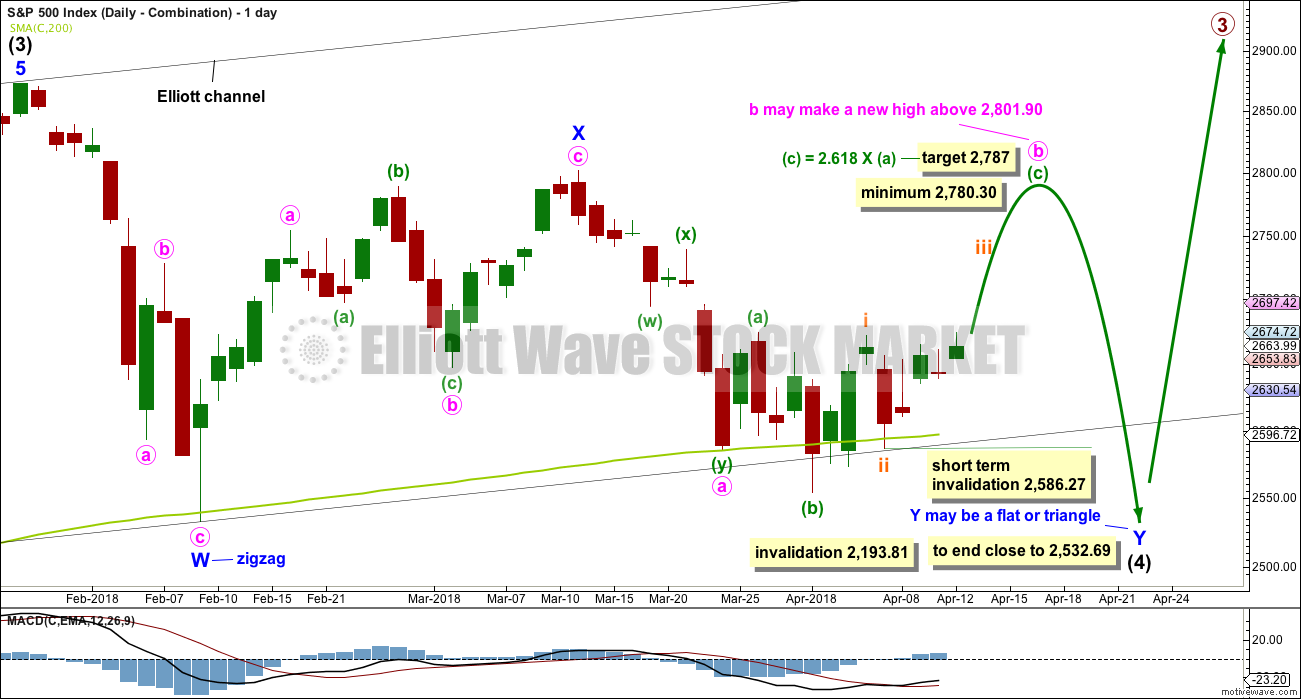
Click chart to enlarge.
Double combinations are very common structures. The first structure in a possible double combination for intermediate wave (4) would be a complete zigzag labelled minor wave W. The double should be joined by a three in the opposite direction labelled minor wave X, which may be a complete zigzag. X waves within combinations are typically very deep; if minor wave X is over at the last high, then it would be a 0.79 length of minor wave W, which is fairly deep giving it a normal look. There is no minimum nor maximum requirement for X waves within combinations.
The second structure in the double would most likely be a flat correction labelled minor wave Y. It may also be a triangle, but in my experience this is very rare, so it will not be expected. The much more common flat for minor wave Y will be charted and expected.
A flat correction would subdivide 3-3-5. Minute wave a must be a three wave structure, most likely a zigzag. It may also be a double zigzag. On the hourly chart, this is now how this downwards movement fits best, and this will now be how it is labelled.
Minute wave b must now reach a minimum 0.90 length of minute wave a. Minute wave b must be a corrective structure. It may be any corrective structure. It may be unfolding as an expanded flat correction. A target is calculated for it to end. Within minuette wave (c), subminuette waves i and ii may now be complete. Within subminuette wave iii, no second wave correction may move beyond its start below 2,586.27.
The purpose of combinations is to take up time and move price sideways. To achieve this purpose the second structure in the double usually ends close to the same level as the first. Minor wave Y would be expected to end about the same level as minor wave W at 2,532.69. This would require a strong overshoot or breach of the 200 day moving average, which looks unlikely.
The second idea for a combination will not be published today because that wave count now involves a truncation. It has been my decision to not publish it on a daily basis due to a very low probability. It will be published again if necessary.
DAILY CHART – FLAT
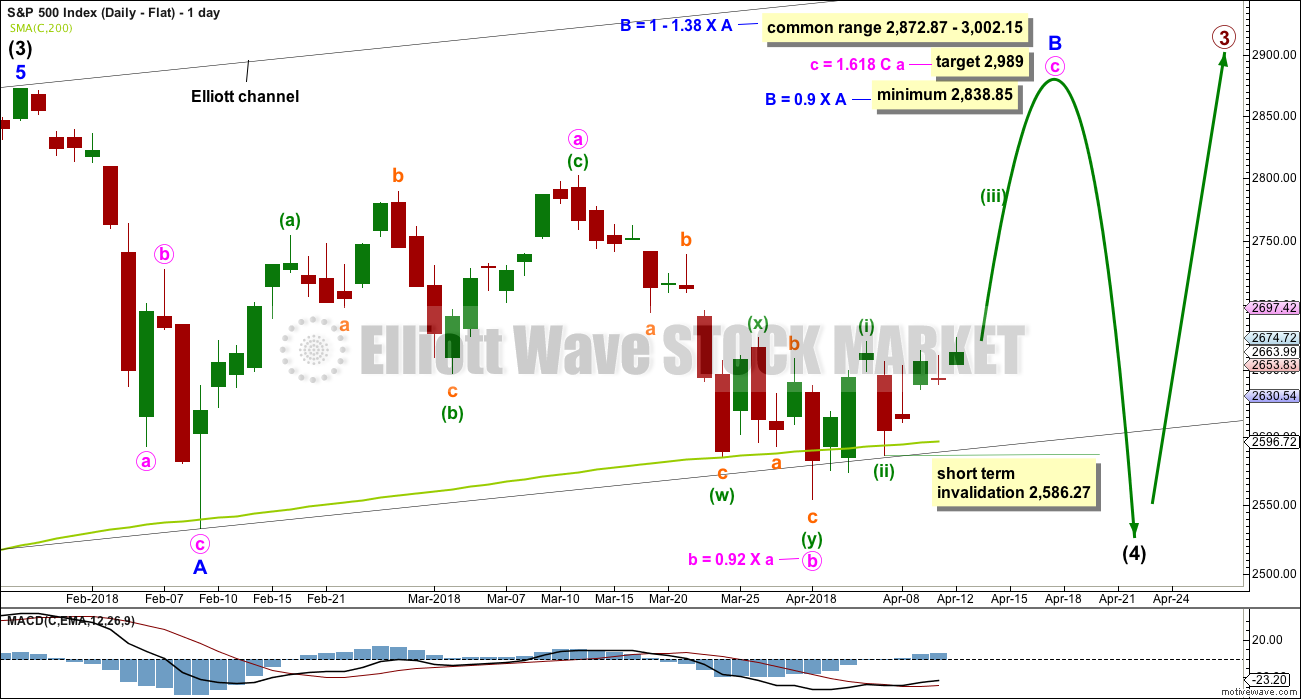
Click chart to enlarge.
Flat corrections are very common. The most common type of flat is an expanded flat. This would see minor wave B move above the start of minor wave A at 2,872.87.
Within a flat correction, minor wave B must retrace a minimum 0.9 length of minor wave A at 2,838.85. The most common length for minor wave B within a flat correction would be 1 to 1.38 times the length of minor wave A at 2,872.87 to 3,002.15. An expanded flat would see minor wave B 1.05 times the length of minor wave A or longer, at 2,889.89 or above. A target is today calculated for minor wave B to end, which would see it end within the common range.
Minor wave B may be a regular flat correction, and within it minute wave a may have been a single zigzag and minute wave b may have been a double zigzag. This has a very good fit. The subdivisions at the hourly chart level at this stage would be the same for the last wave down as the main wave count.
This wave count would require a very substantial breach of the 200 day moving average for the end of intermediate wave (4). This is possible but may be less likely than a smaller breach.
The alternate daily wave count will also no longer be published at this time. It too requires a truncation; it has a very low probability but may again be published if necessary. For now let us keep the number of charts published each day to a reasonable number, so that this analysis is digestible.
TECHNICAL ANALYSIS
WEEKLY CHART
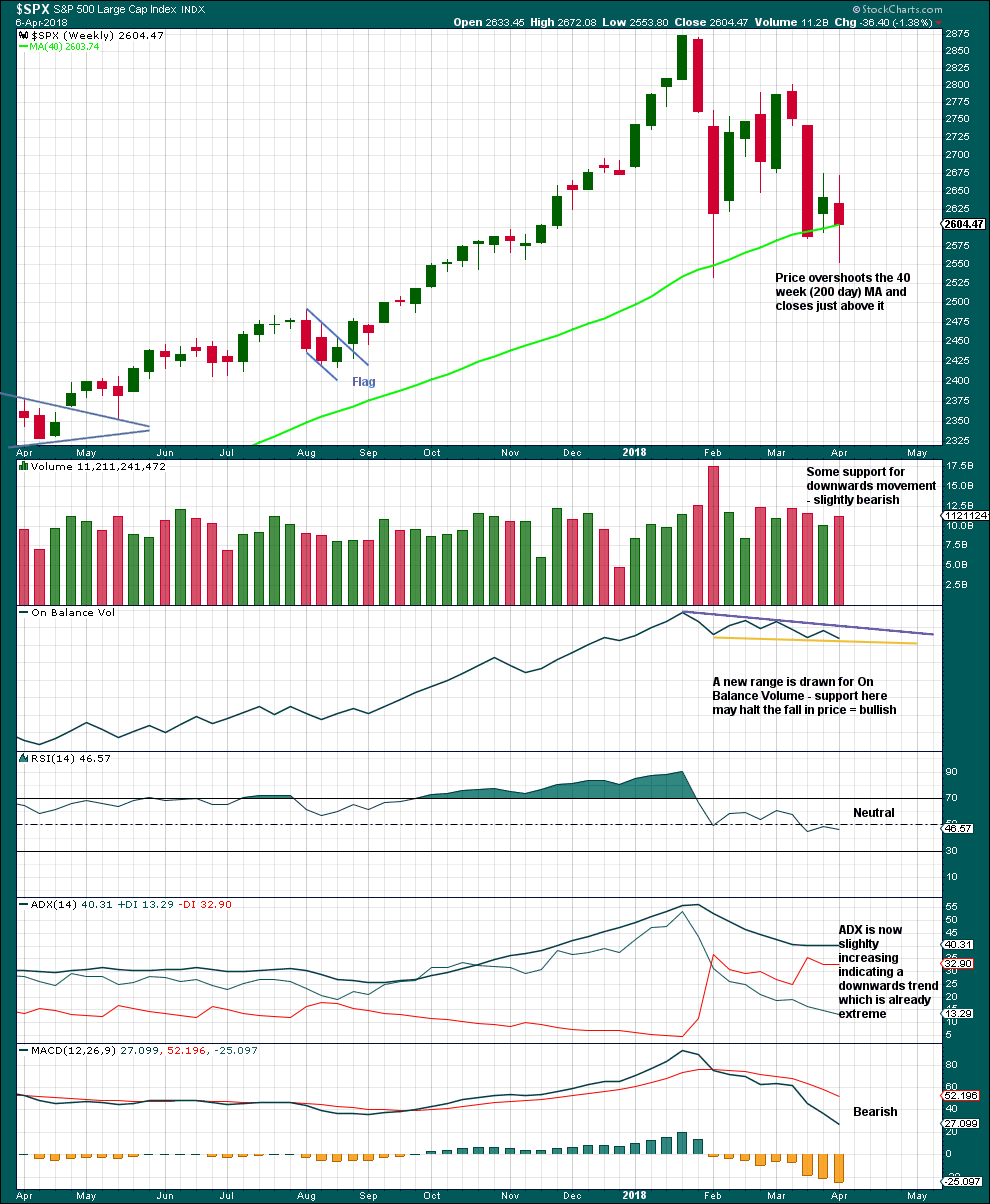
Click chart to enlarge. Chart courtesy of StockCharts.com.
The last completed weekly candlestick has longer upper and lower wicks; it is almost a spinning top. This represents a balance of bulls and bears with the bears slightly winning. A slight increase in volume for downwards movement is only slightly bearish; volume remains lighter than the last two prior downwards movement, so overall volume is declining.
Another downwards week would provide a bearish signal from On Balance Volume. An upwards week would provide a bullish signal. Expect support here until it gives way.
The trend on ADX is extreme because the ADX line is above both directional lines.
DAILY CHART
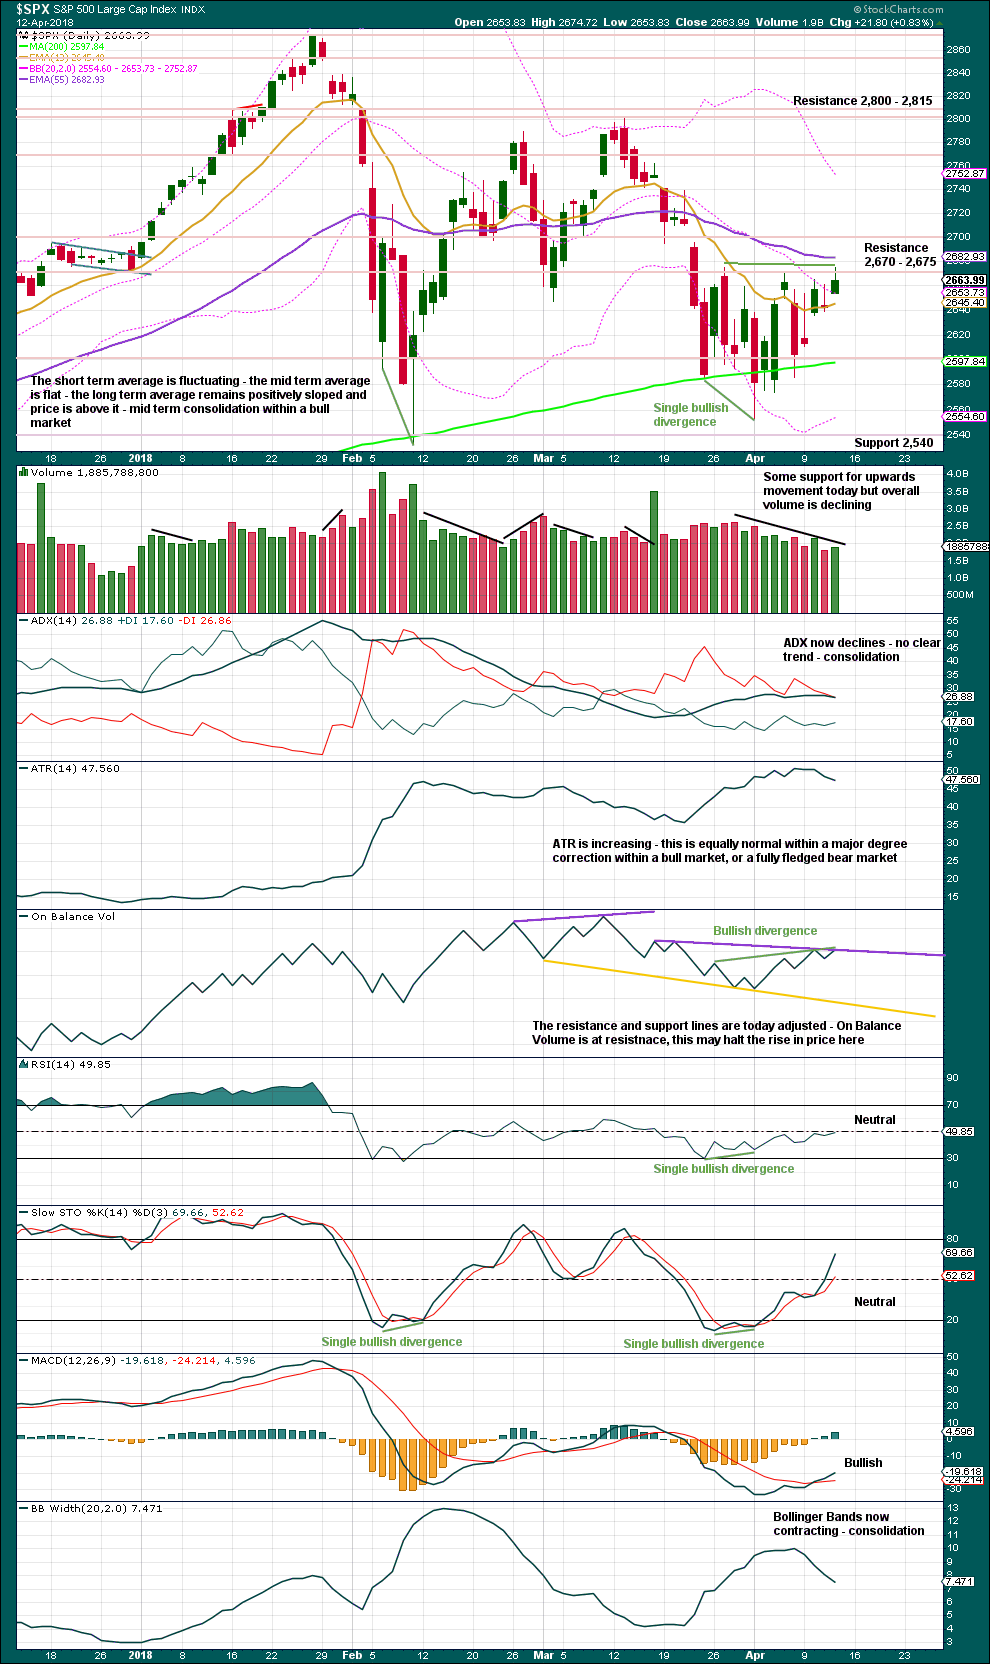
Click chart to enlarge. Chart courtesy of StockCharts.com.
The high today at 2,674.72 is very slightly below a prior swing high on the 27th of March, at 2,674.78. This provides bullish divergence with On Balance Volume, which has made a reasonable new high.
Trend lines on On Balance Volume are today adjusted to have stronger technical significance.
Price is at resistance. On Balance Volume is at resistance. Divergence from On Balance Volume suggests this resistance may be overcome tomorrow. If price can close above resistance at 2,675 on a day with some support from volume, that would be considered a classic upwards breakout. Next resistance would be at 2,800 – 2,815.
VOLATILITY – INVERTED VIX CHART
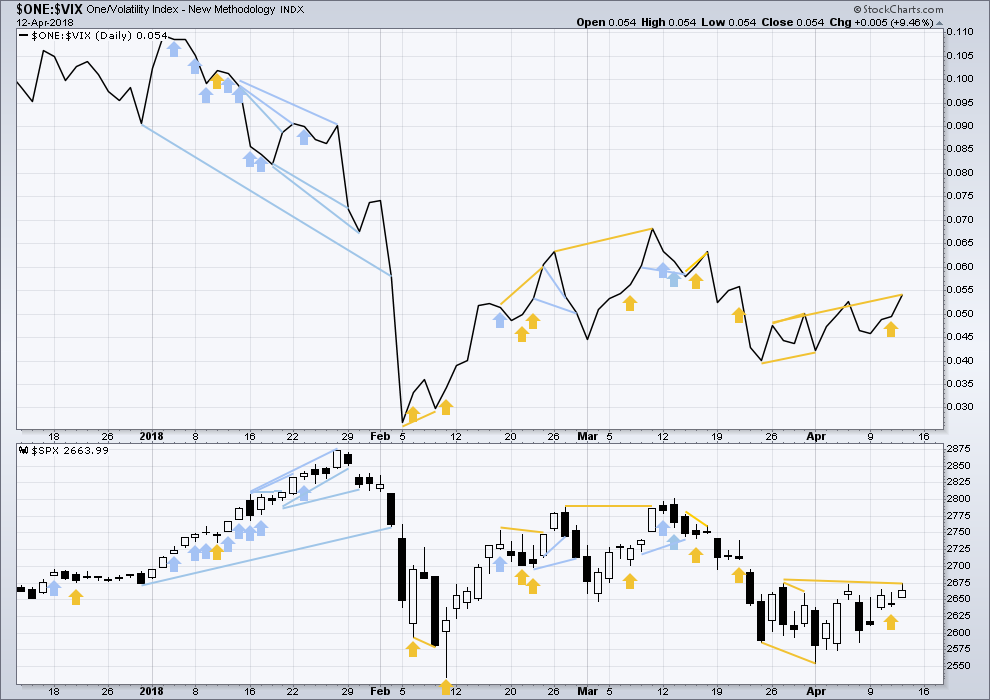
Click chart to enlarge. Chart courtesy of StockCharts.com.
So that colour blind members are included, bearish signals will be noted with blue and bullish signals with yellow.
Normally, volatility should decline as price moves higher and increase as price moves lower. This means that normally inverted VIX should move in the same direction as price.
Inverted VIX has made a reasonable new high above a prior swing high about the 27th of March, but price has not. This divergence is interpreted as bullish, if VIX is a leading indicator.
BREADTH – AD LINE
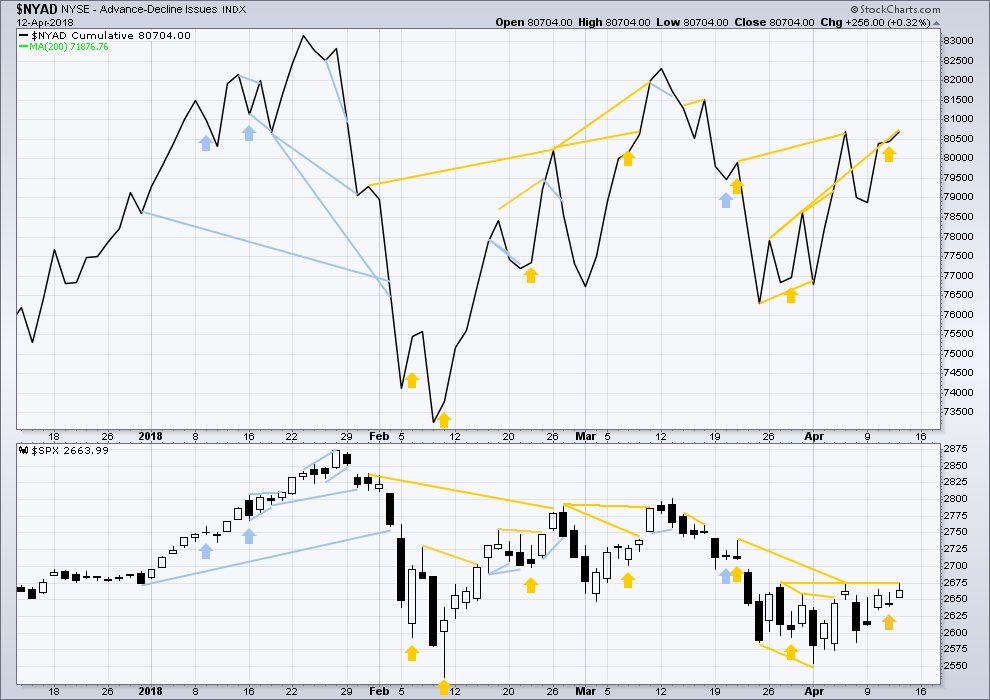
Click chart to enlarge. Chart courtesy of StockCharts.com.
There is normally 4-6 months divergence between price and market breadth prior to a full fledged bear market. This has been so for all major bear markets within the last 90 odd years. With no longer term divergence yet at this point, any decline in price should be expected to be a pullback within an ongoing bull market and not necessarily the start of a bear market.
All of small, mid and large caps last week moved lower. None have made new small swing lows, and for all the fall has been even. There is no divergence to indicate underlying weakness.
Breadth should be read as a leading indicator.
The AD line has made a strong new high above a prior high about the 27th of March, but price has not quite managed to do so yet. This is read as a leading indicator, so it is a bullish signal.
DOW THEORY
The following lows need to be exceeded for Dow Theory to confirm the end of the bull market and a change to a bear market:
DJIA: 23,360.29.
DJT: 9,806.79.
S&P500: 2,532.69.
Nasdaq: 6,630.67.
At this stage, only DJIA has made a new major swing low. DJT also needs to make a new major swing low for Dow Theory to indicate a switch from a bull market to a bear market. For an extended Dow Theory, which includes the S&P500 and Nasdaq, these two markets also need to make new major swing lows.
Charts showing each prior major swing low used for Dow Theory may be seen at the end of this analysis here.
Published @ 08:51 p.m. EST.
hourly chart updated:
another expanded flat, this one subminuette ii?
I’m looking and trying to see if a five up could be over at today’s high, could that have been the end of minuette (i) and now we may be looking for minuette (ii)? but I can’t make it fit… yet. will look on the five minute chart. we don’t want to have nasty downwards surprise when the wave count calls for up only
Sure looks like an ABC down off the early morning high today. Not quite sure yet how that fits in here.
Are you looking at JPM, and XLF? Not sure how one could possibly be bullish with formations like that occurring as the indexes fade off key MAs.
Today was a battle of the gaps. In addition to overhead resistance at MAs, open gaps from 3/21 stopped upward movement. Interestingly enough, downward movement found support at last Wednesday’s gap. Also lots of bearish engulfing candles today. One of those contested gap areas will fall next week. That will be your clue as to how to get positioned. Have a great weekend everyone!
I am now. Yes, they look mighty bearish.
I am concerned with the mucking around at the start of a possible third wave up here, even one of a low degree. It should have gotten going by now…
I’ll be looking for an alternate.
But I’ll also let the technicals of the S&P500 guide me more than what JPM and XLF are doing, bearish though they are.
I continue to heed Lara’s warning regarding triangles. She has tracked many even those that appear to be completed, only to discover it morphs into another count. This now two and a half month correction is one of relatively high degree and duration. It has proved to fool many and do so daily. It has been whipsaw city. If a trader works on hours long trades, she or he might profit well. But me, I do not have the time at the computer needed for such a venture. I think in days and weeks. Even though, I want my T-shirt that Lara is designing to have an arm patch as well. It will read, “I Hate Triangles”.
That being said, when this Intermediate 4 completes, there will follow a nice ride to new ATH’s. The thrust out of a triangle can be exciting and quite profitable. At that time it will be “Load the boat and get on board” time. Patience required.
On the other hand the market can keep going with that trend line.
It broke through that line in December of last year and then failed in February
It’s seems like when the dow jones industrial average hits the long term trend line resistance the market pulls back.
Long term trending is 24700 at the end of this month.
The line goes up 200 points of month.
So if keeps attempting and it keeps failing.
After so many times down we go.
Banks report, “great earnings”, early morning headlines “market roars!”…and an instant hard selloff. The bears are in control here, that’s for sure. The can, will and do sell this market hard hard hard on any threat that it may break up and through resistance. 4 times now since late March. Eventually, the pent up energy of this consolidation is going to blow, whether to the upside or down I don’t know, but if I was forced to bet right now, I’d give it to the bears, as they seem to have the controlling hand.
Definitely could go either way. On the neg side traders nervous about other shoe dropping with trump and more importantly the possible attack on Syria getting into a conflict wit Russia. Traders are going to hesitant going into the close. On the flip side the spx could rally 100 points in a flash if these are taken away or even subdued.
Agreed. Feels like we are all betting on an outcome of Syria and I know I’ll be the last to receive any tradable information. Wave counts point up, I think that is the likely scenario still. It feels like if major war does break out, the bull is over. Just my rambling thoughts. On the sidelines for a bit just watching.
Wrong questions, the correct question is when will central banks benefit the most by letting the markets fall apart? If you can’t tell when and where they’re coming in, then you should not be trading. There are almost no human traders that react to head lines, news, tweets etc.
I do find it interesting that both the VIX and UVXY are down sharply today… they were both in the red even at session lows today
5 wave structure on today’s down move, now complete. Probably an A down, B up in progress…watch out for the C down! Maybe….
Bingo. C down might be a shorty though…
We got a big ABC zig zag down, not quite as I expected it but…we got it. Where C is gonna end I dunno. Maybe it’s even over already. Let’s see, just another what, 1.2% sell off intraday! Lol!!!!! My oh my.
As an aside, I get a great laugh when I hear analysts say after a day like this “a very quiet day…”. ROTFL’ing!!! I suppose they are correct in the context of the last 2 months but…-1.2% intraday IS NOT QUIET!
FYI everybody: a couple of folks have had problems signing up to Lara’s Weekly.
I’ll be up early again tomorrow to sort out any last problems. I’ll be here just after 2pm EST. So email me admin@elliottwavestockmarket.com or Cesar webmaster@elliottwavestockmarket.com (TBH he’s the man for that job) and we shall have it fixed in time.
Thank you!
My mistake. My apology. I have figured out what I did wrong yesterday. The subscribe form asks if you are a returning customer. It means of Elliott Wave Weekly. I thought it meant of EWSM. Of course it could not find me or my email address as a returning customer because I had yet to signed up. Duh. So I went this morning and signed up no problem. Thanks.
When I asked about paying semi-annual or annually, I meant to pay it for the whole year without any further discount. I just wanted one or two transactions per year. But I guess I am still young enough to do monthly transactions. He-He!
Congratulations Lara on the successful launch or another product.
BTW, I just looked up Duh in the slang dictionary to see if I was spelling it correctly. This is the response I received: Duh means “No shit sherlock” and/or “Thank you captain obvious”. Well, who knew?
LOL
it would’ve been more convenient to have an annual payment wouldn’t it. but we didn’t create the extra products in our back end.
once this launch has all settled down I’ll speak to Cesar and we may do that to make lives easier
my favourite is “no shit Sherlock”. I use that one a lot. with my teenager, who oozes sarcasm from every pore
Thanks for the laugh.
I dink we finwally got wid of da wabbit!!
he’ll be back and up to his old tricks soon I reckons
yea, it was just a ploy really so I could finally bag ‘im!!! Not today…