An upwards bounce and quick reversal today completes a Gravestone doji candlestick.
Summary: The target for more downwards movement is 2,632. Weak bullish signals today from the AD line and VIX put slight doubt on this view.
Always practice good risk management. Always trade with stops and invest only 1-5% of equity on any one trade.
The biggest picture, Grand Super Cycle analysis, is here.
Last historic analysis with monthly charts is here. Video is here.
An alternate idea at the monthly chart level is given here at the end of this analysis.
An historic example of a cycle degree fifth wave is given at the end of the analysis here.
MAIN ELLIOTT WAVE COUNT
WEEKLY CHART
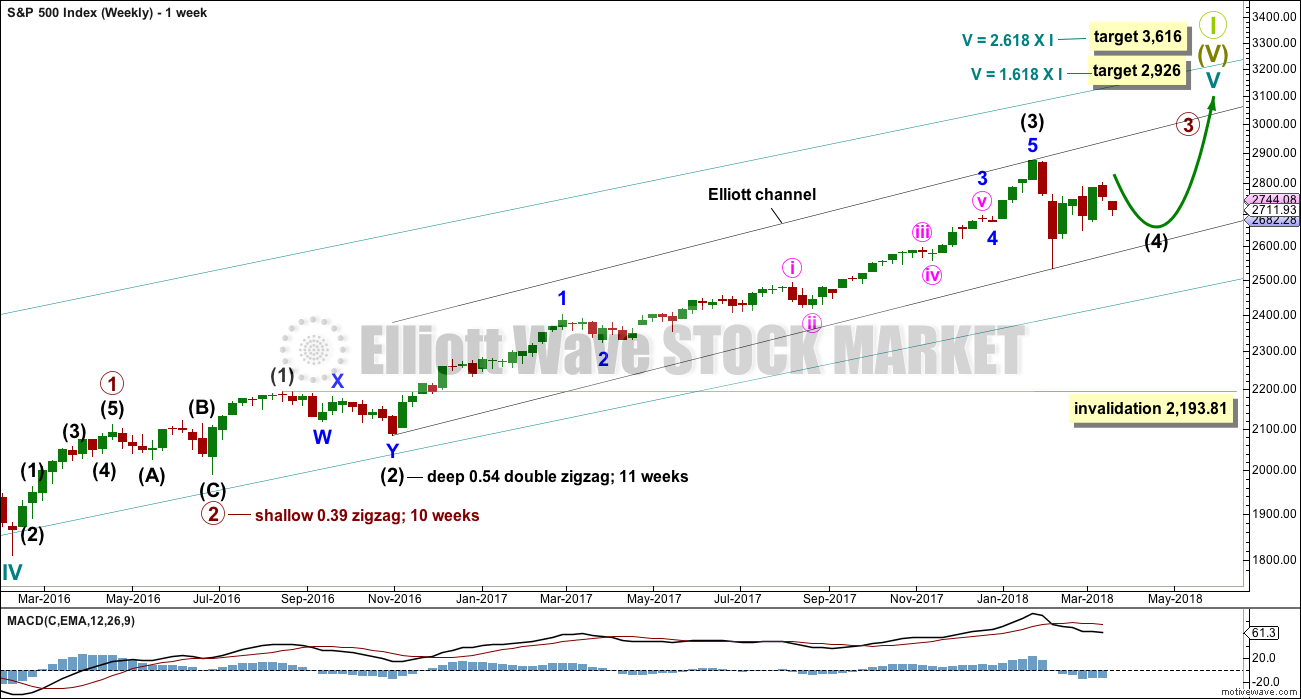
Cycle wave V must complete as a five structure, which should look clear at the weekly chart level. It may only be an impulse or ending diagonal. At this stage, it is clear it is an impulse.
Within cycle wave V, the third waves at all degrees may only subdivide as impulses.
Intermediate wave (4) has breached an Elliott channel drawn using Elliott’s first technique. The channel is redrawn using Elliott’s second technique as if intermediate wave (4) was over at the last low. If intermediate wave (4) continues sideways, then the channel may be redrawn when it is over. The upper edge may provide resistance for intermediate wave (5).
Intermediate wave (4) may not move into intermediate wave (1) price territory below 2,193.81. At this stage, it now looks like intermediate wave (4) may be continuing further sideways as a combination, triangle or flat. These three ideas are separated into separate daily charts. All three ideas would see intermediate wave (4) exhibit alternation in structure with the double zigzag of intermediate wave (2).
A double zigzag would also be possible for intermediate wave (4), but because intermediate wave (2) was a double zigzag this is the least likely structure for intermediate wave (4) to be. Alternation should be expected until price proves otherwise.
DAILY CHART – TRIANGLE
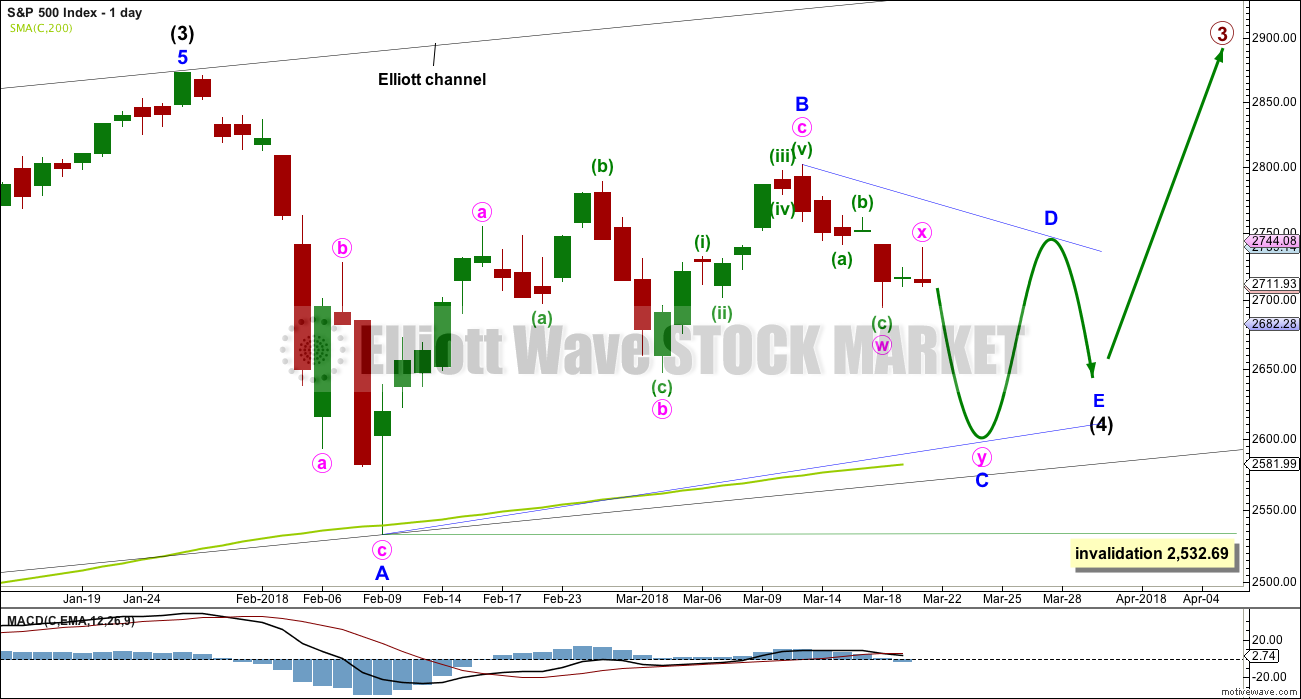
This first daily chart outlines how intermediate wave (4) may now continue further sideways as a contracting or barrier triangle. It is possible that minor wave B within the triangle was over at the last high, which would mean the triangle would be a regular triangle. Minor wave C downwards may now be underway and may be a single or double zigzag. One of the five sub-waves of a triangle is usually a more complicated multiple, and the most common sub-wave to do this is wave C. It looks like minor wave C may be unfolding as a double zigzag, at this stage, and this is how it will be labelled. Within the double zigzag, minute wave x should not make a new high above the start of minute wave w at 2,801.90.
Minor wave C may not make a new low below the end of minor wave A at 2,532.69.
Intermediate wave 2 lasted 11 weeks. If intermediate wave (4) is incomplete, then it would have so far lasted only seven weeks. Triangles tend to be very time consuming structures, so intermediate wave (4) may total a Fibonacci 13 or even 21 weeks at its conclusion.
Because this is the only daily chart which expects price to continue to find support at the 200 day moving average, it is presented first; it may have a slightly higher probability than the next two daily charts.
HOURLY CHART
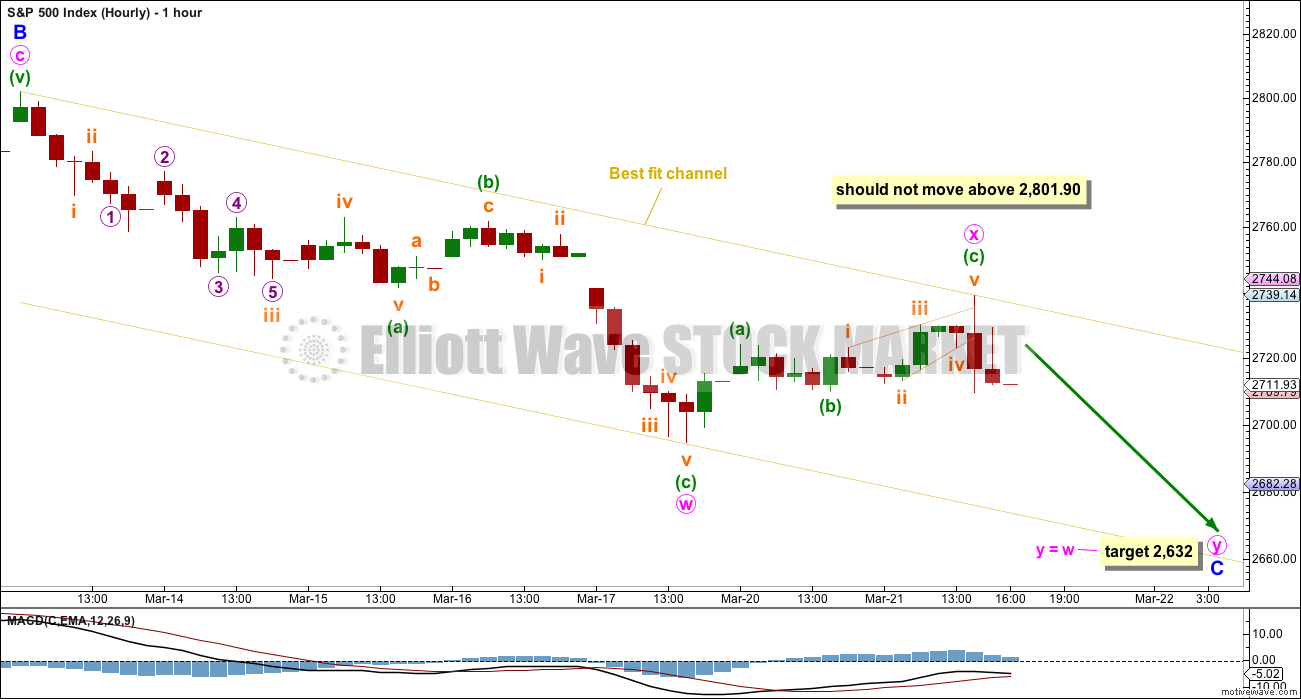
If a double zigzag is unfolding lower, then the first zigzag may be complete. The double may be joined by a three in the opposite direction labelled minute wave x.
Minute wave x may be complete today. A target is calculated which expects the most common Fibonacci ratio between minute waves w and y.
If minute wave x moves higher, it should not move above the start of minute wave w. Triangles normally adhere well to their trend lines; the B-D trend line should have either a downwards slope for a contracting triangle or be flat for a barrier triangle. Minute wave x should remain below that line.
DAILY CHART – COMBINATION
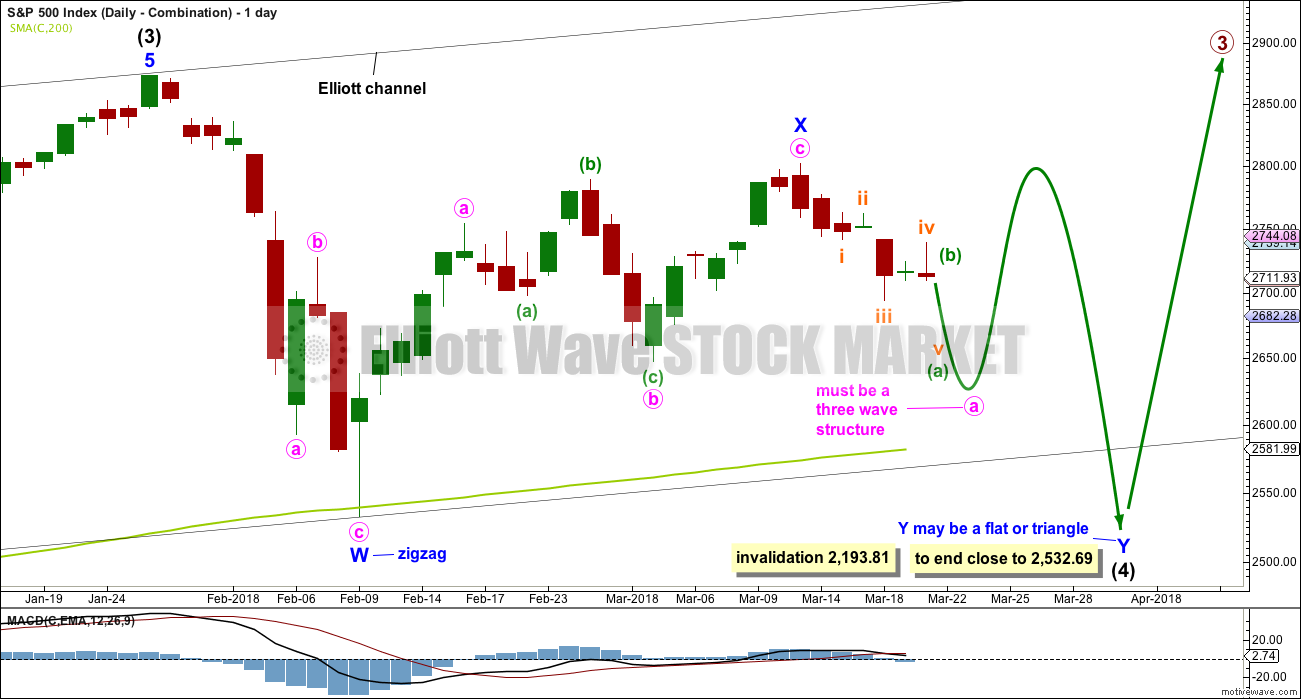
Double combinations are very common structures. The first structure in a possible double combination for intermediate wave (4) would be a complete zigzag labelled minor wave W. The double should be joined by a three in the opposite direction labelled minor wave X, which may be a complete zigzag. X waves within combinations are typically very deep; if minor wave X is over at the last high, then it would be a 0.79 length of minor wave W, which is fairly deep giving it a normal look. There is no minimum nor maximum requirement for X waves within combinations.
The second structure in the double would most likely be a flat correction labelled minor wave Y. It may also be a triangle, but in my experience this is very rare.
A flat correction would subdivide 3-3-5. Minute wave a must be a three wave structure, most likely a zigzag. Minute wave a is labelled as an incomplete zigzag, with minuette wave (a) within it an incomplete five wave impulse.
It is also possible that minute wave a may be unfolding as a flat correction, and within it minuette wave (a) may be a complete zigzag. This idea is outlined in the second hourly chart below.
The purpose of combinations is to take up time and move price sideways. To achieve this purpose the second structure in the double usually ends close to the same level as the first. Minor wave Y would be expected to end about the same level as minor wave W at 2,532.69. This would require a strong overshoot or breach of the 200 day moving average, which looks unlikely.
HOURLY CHART – COMBINATION
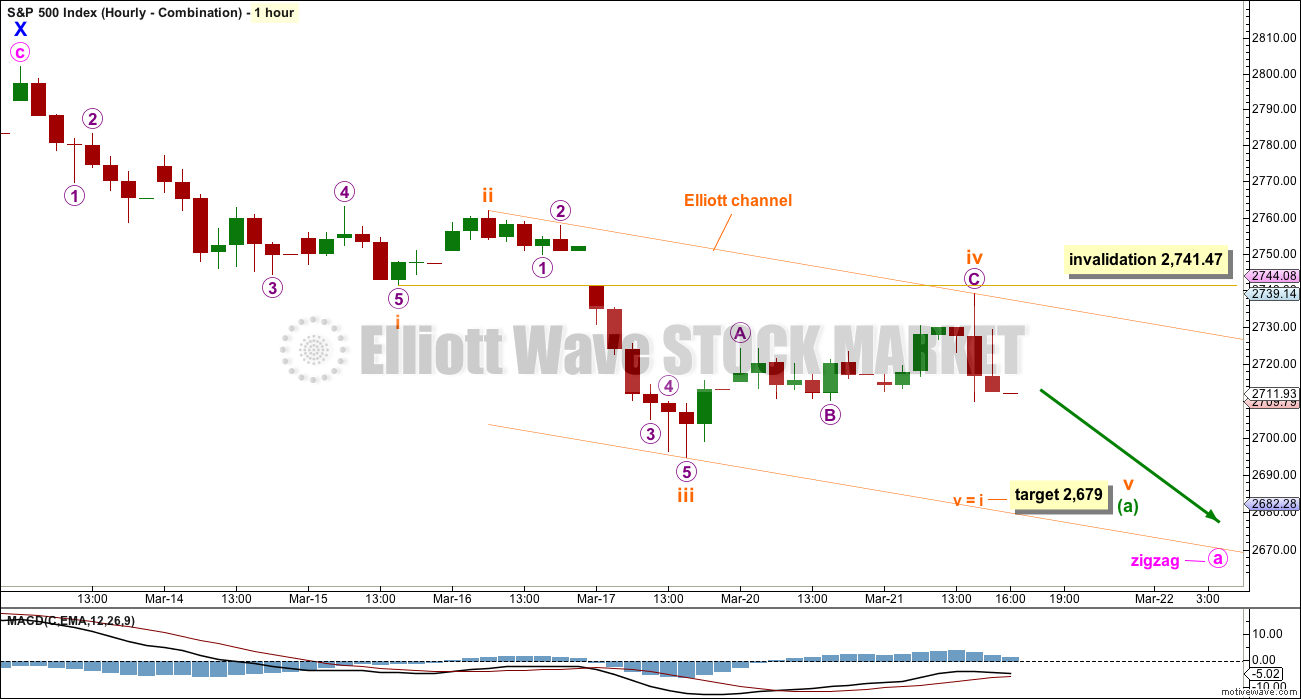
An impulse may be unfolding lower. This may be minuette wave (a) within a zigzag for minute wave a.
Within the impulse, subminuette wave iv may not move into subminuette wave i price territory above 2,741.47.
A target for subminuette wave v is calculated which expects to see the most common Fibonacci ratio to subminuette wave i.
This idea of an impulse unfolding lower also works for the first daily chart, which sees a huge triangle unfolding.
HOURLY CHART – COMBINATION II
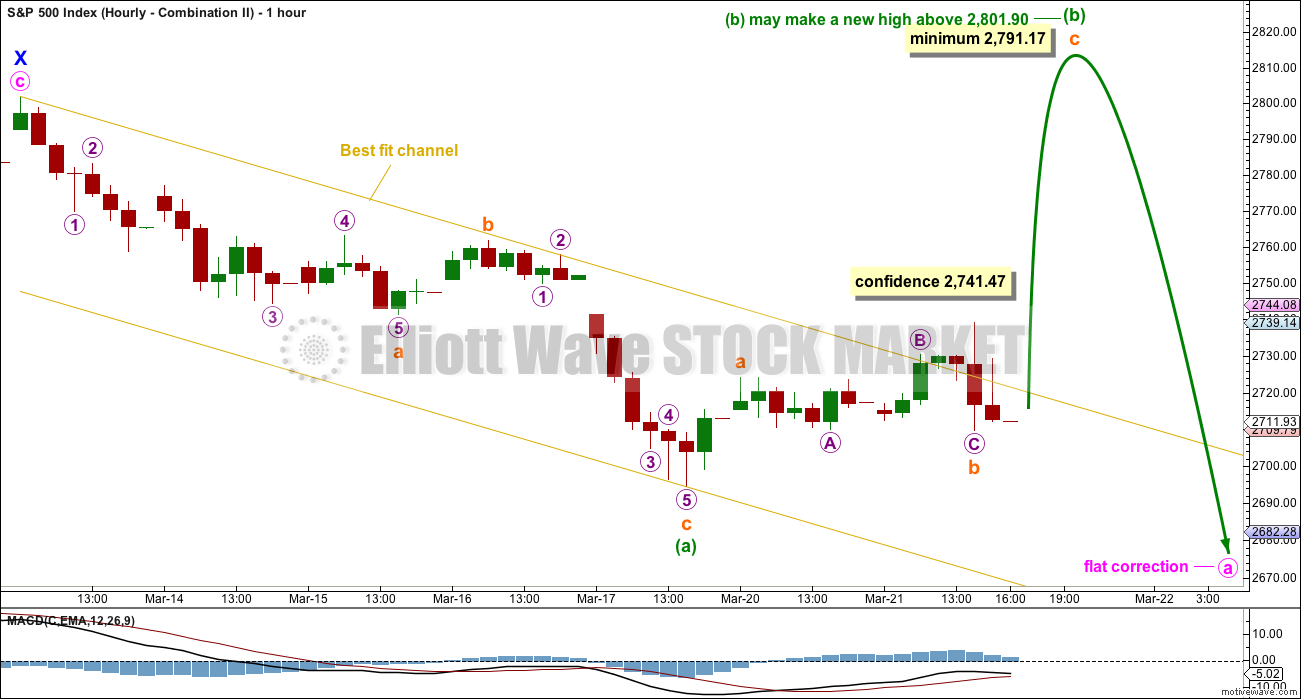
Minute wave a may be unfolding as a flat correction, to subdivide 3-3-5. Within the flat correction, minuette wave (a) may be a complete zigzag, and now minuette wave (b) may now need to bounce upwards to retrace a minimum 0.9 length of minuette wave (a).
Minuette wave (b) may make a new high above the start of minuette wave (a) as in an expanded flat.
If price makes a new high above 2,741.47, then a little confidence may be had in this idea. The first hourly chart for the triangle wave count would however remain valid and still have a reasonable look.
There is some weak support today for this hourly chart from bullish signals from the AD line and inverted VIX.
DAILY CHART – FLAT
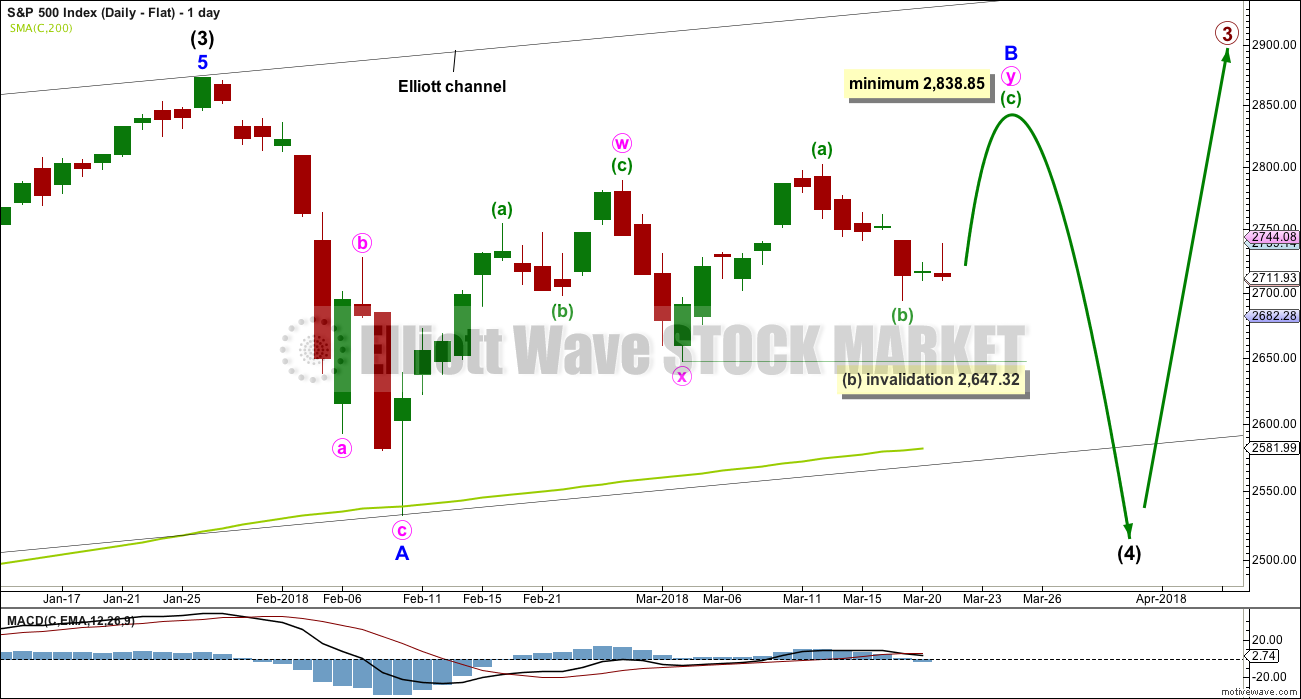
Flat corrections are very common. The most common type of flat is an expanded flat. This would see minor wave B move above the start of minor wave A at 2,872.87.
Within a flat correction, minor wave B must retrace a minimum 0.9 length of minor wave A at 2,838.85. The most common length for minor wave B within a flat correction would be 1 to 1.38 times the length of minor wave A at 2,872.87 to 3,002.15. An expanded flat would see minor wave B 1.05 times the length of minor wave A or longer, at 2,889.89 or above.
When minor wave B is a complete corrective structure ending at or above the minimum requirement, then minor wave C downwards would be expected to make a new low below the end of minor wave A at 2,532.69 to avoid a truncation.
Minor wave B may be continuing higher as a double zigzag. At this stage, this would be the most likely structure to achieve the height required for minor wave B. Within the second zigzag in the double, minuette wave (b) may not move beyond the start of minuette wave (a) below 2,647.32.
This wave count would require a very substantial breach of the 200 day moving average for the end of intermediate wave (4). This looks unlikely.
HOURLY CHART – FLAT
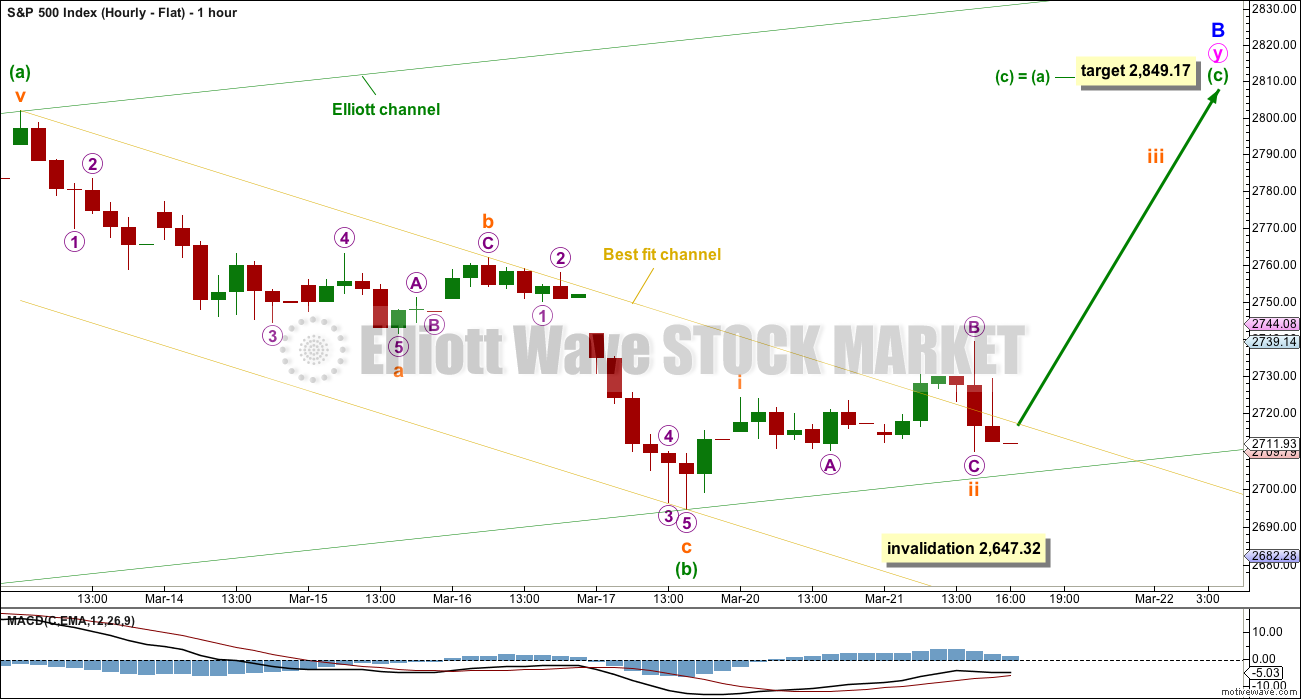
If minor wave B is unfolding higher as a double zigzag, then within it minuette wave (b) would very likely be complete. A target is calculated assuming the most common Fibonacci ratio between minuette waves (a) and (c). If minuette wave (b) moves lower, then this target must also move correspondingly lower.
It is still possible though that minuette wave (b) could move lower as a double zigzag. The invalidation point must remain at 2,647.32 for this reason.
DAILY CHART – ALTERNATE
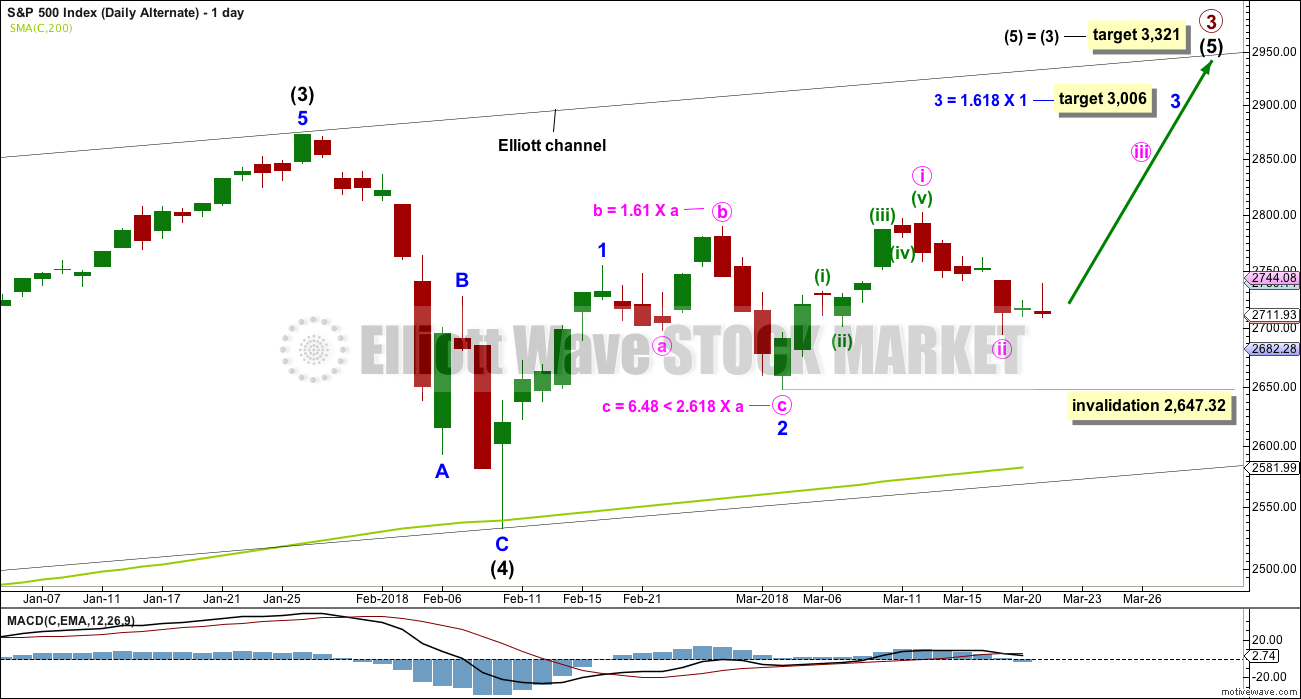
It is possible still that intermediate wave (4) was complete as a relatively brief and shallow single zigzag.
A new all time high with support from volume and any one of a bullish signal from On Balance Volume or the AD line would see this alternate wave count become the main wave count.
Within minor wave 3, minute wave ii may not move beyond the start of minute wave i below 2,647.32.
This alternate expects minor wave 1 was an impulse.
TECHNICAL ANALYSIS
WEEKLY CHART
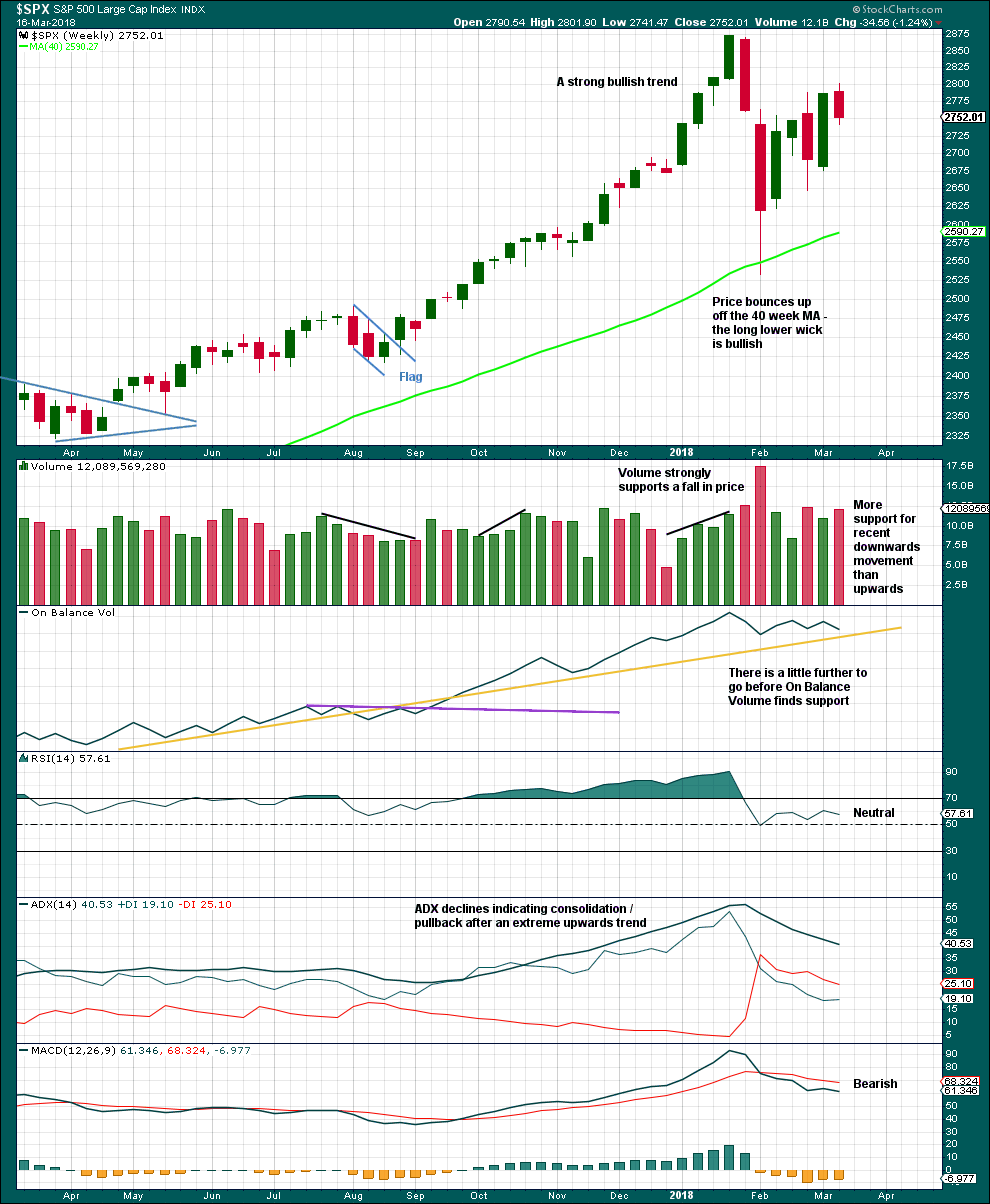
Click chart to enlarge. Chart courtesy of StockCharts.com.
Last week moved price higher with a higher high and a higher low, but the candlestick is red and the balance of volume is down. At this time frame, it looks like there may be more support for downwards movement than upwards within the week, but it would be better to look inside the week at daily volume bars to draw a conclusion.
The pullback has brought ADX down from very extreme and RSI down from extremely overbought. There is again room for a new trend to develop.
DAILY CHART
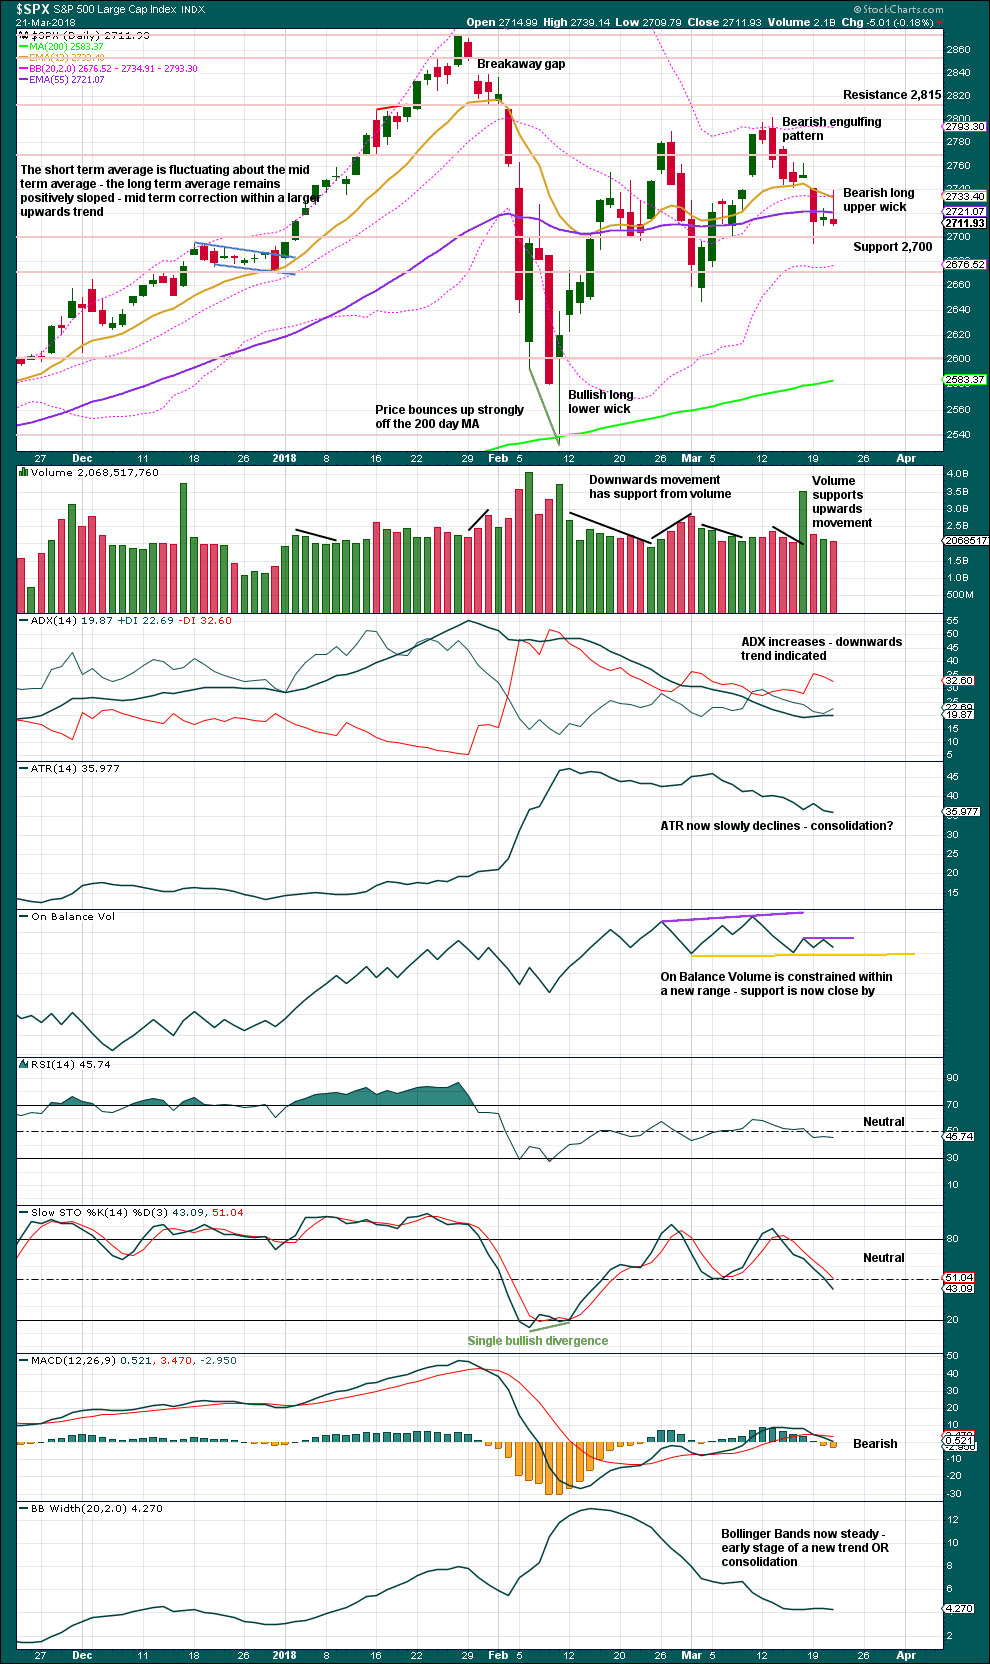
Click chart to enlarge. Chart courtesy of StockCharts.com.
The balance of volume today was down and the candlestick is red, although today is an outside day. Downwards movement during today’s session has slightly less support than upwards movement in yesterday’s session. The short term volume profile is slightly bullish.
Give more weight to the long upper wick on today’s Gravestone doji. Although it should not be read as a reversal pattern (because there is no reasonable upwards trend here to reverse) the long upper wick should still be read as fairly bearish.
A new weak resistance line is drawn today for On Balance Volume. There is still room for OBV to move lower before it finds support.
VOLATILITY – INVERTED VIX CHART
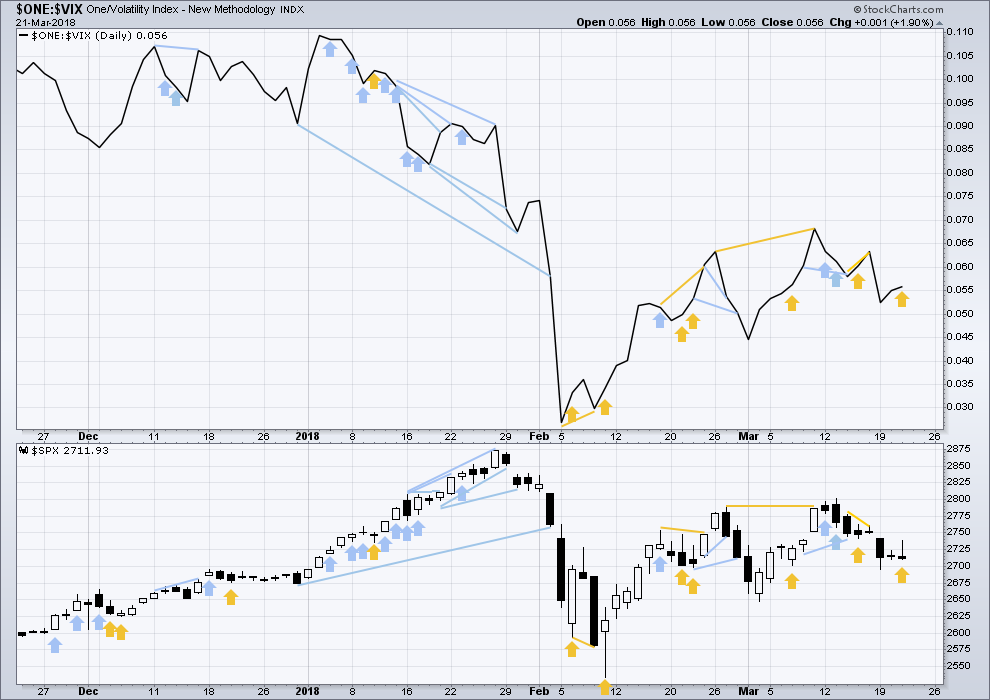
Click chart to enlarge. Chart courtesy of StockCharts.com.
So that colour blind members are included, bearish signals will be noted with blue and bullish signals with yellow.
Normally, volatility should decline as price moves higher and increase as price moves lower. This means that normally inverted VIX should move in the same direction as price.
Price completed an outside day today, which closed red and the balance of volume was downwards. Downwards movement during this session did not have support from a normal increase in volatility as volatility declined. This divergence is bullish. However, it is weak because the direction for today’s outside day is unclear.
BREADTH – AD LINE
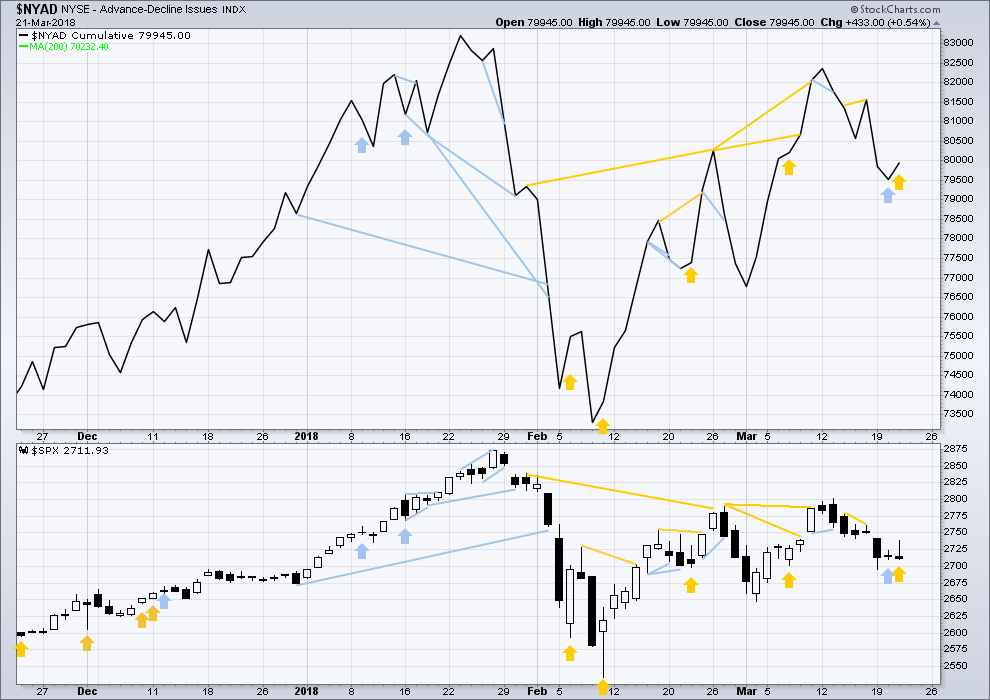
Click chart to enlarge. Chart courtesy of StockCharts.com.
There is normally 4-6 months divergence between price and market breadth prior to a full fledged bear market. This has been so for all major bear markets within the last 90 odd years. With no longer term divergence yet at this point, any decline in price should be expected to be a pullback within an ongoing bull market and not necessarily the start of a bear market.
All of small, mid and large caps last week completed an outside week. All sectors of the market at this time appear to be in a consolidation.
Breadth should be read as a leading indicator.
Bearish divergence noted in last analysis has been followed by an outside day with a balance of volume downwards and a red close. It may now be resolved, or it may need another downwards day to resolve it.
The outside day closed red and the balance of volume was down today. But downwards movement during this session does not have support from a decline in market breadth. The increase in breadth today is interpreted as a bullish signal.
DOW THEORY
All indices have made new all time highs as recently as eight weeks ago, confirming the ongoing bull market.
The following lows need to be exceeded for Dow Theory to confirm the end of the bull market and a change to a bear market:
DJIA: 17,883.56.
DJT: 7,039.41.
S&P500: 2,083.79.
Nasdaq: 5,034.41.
Charts showing each prior major swing low used for Dow Theory are here.
Published @ 09:18 p.m. EST.

It looks like the bears are back in solid control. SPX 2647 did not hold and the bull stops are being run. We could see Lara’s 2612 target very quickly.
Daily VIX above the BB and daily SPX below the BB. $NYMO (McClellan Oscillator) well below zero, in fact, about -40 and falling hard. MACD daily pointing down strongly with the histogram just beginning its plunge into negative territory.
I will look eagerly for OBV of SPX in this evening’s analysis.
The bears wrested control back at the end of last week imho, when the dip off the highs didn’t initiate any selling toward the end of the week. I think we could very well see deep, deep selling tomorrow and/or Monday. That would herald an end of this 4. The ensuing reversal upwards will be absolutely furious. I know there are some here who think the bear market has already started, but my view is that there is still not near enough divergence in breadth and volatility.
Your right Bo, the bears took control last week. I should have said they have now “conclusively taken control” because now that SPX has pierced 2647 it is conclusive, imo. Previous to today’s break of 2647 there may have still been some question in people’s mind. But I am sure glad I sold all my long positions mid last week around 2760 SPX.
I am also with you in looking for this fourth wave correction to complete so that I can go long again. It may very well snap back to new ATHs across the board quite quickly. Quick or not, we still have a longer term trend that has been very bullish up to this correction. I agree we do not have much evidence that the longer trend has changed. Moving average are beginning to cross over, however. Patience is a virtue all traders need, especially me.
Thankfully, I managed to grab a quick profit on this last drop. Will lay out overnight, and see what tomorrow brings.
Good morning everybody! A new target for you this morning.
A Fibonacci ratio between minuette waves (a) and (c) would be a bit more likely than a Fibonacci ratio between minute waves w and y. So now that minuette waves (a) and (b) may be seen as complete I can calculate a better target for you.
This looks a bit better for the daily chart triangle idea. Minor C would have a more normal looking length / depth. It would still end above the 200 day MA.
HOWEVER…
On the five minute chart minuette (b) actually looks pretty good as a five wave impulse.
This may only be subminuette a. Minuette (b) may be incomplete, it may be ready to move higher as a zigzag. That would give it better proportion.
That’s the big caveat with the chart above.
Yep. VIX printing a lower daily high so some kind of interim bottom could be in place. Went to Evanston this past weekend to see my baby girl at NU and enjoy David Russel perform on classical guitar. Awesome!
I managed to pick something up while there and now sidelined for a day or two with an awful cough and sore throat. Bring more lemon and Ginger tea!!
Have a great evening all.
Here’s hoping you get better quickly Verne.
Thanks! Hot Chicken soup with tons of garlic on deck… 🙂
Yep. And ginger. Fresh ginger in your soup helps (and is really yummy)
I will certainly grate some in. Thanks for the tip!
On a 3-minute chart, this bounce looks to me like possibly a 3-3-5 almost complete.
Thoughts?
yes… I am still short
some kind of corrective structure. I see an ABC and maybe the C has a final 5 push into resistance above to finish. I’ll be reestablishing short position…very soon now…piles of fibo resistance immediately above 2688 to 2694 range.
Thanks for the commentary guys… Newbie but eager to learn…
Hi Kevin
The SPX hit 2689 about 20 minutes prior to your posting here.
Do you think its going back up to retest that again?
Thanks
Seems unlikely to me. That said…I think this last push down is the 1 of a 5, and there’s a 2 up coming very soon. But I doubt it gets that high.
Anyone read “The Secret Life of Real Estate and Banking” by Phillip Anderson, which chronicles the full economic history of the USA focused on mony/credit, land/real-estate values, and banking? A heck of a text book, but quite readable. Argues that it’s a pretty strict 18 year cycle, and we’re looking at the 2025-26 timeframe for the next epic recession/depression driven by a collapse of land value (vs. perhaps intervening smaller recessions not driven by the land value/credit cycle). He points in each of these phases through American history at common themes playing out at different periods. Such as the period when all the old banking controls put in place due to the last collapse start getting removed (Dodd-Frank), excessive speculation in land and corporate valuations, etc etc. “Everything is proceeding as Anderson has perceived”, in other words…but we have a long ways to go to the next major collapse, per his thesis. I definitely understand money better now. Worth a read for those interested.
That sounds really interesting. Thanks for the recommendation Kevin!
Herein lies the beauty of EW… the short-term trader doesn’t need to have the wave count perfectly rendered at multiple degrees. All that’s really needed is to be able to discern the difference between impulsive and corrective structures one degree higher than the trade.
Can’t always, but sometimes you can. That’s when you take the trade.
It’s nice to hear you say that because I’ve just been grokking that a bit very recently.
Modest positions. Prudent stops. Always.
And there will be losses. Most often on deep second waves or incomplete B, X, or 4th waves (especially triangles) that can fool you.
The Cry Baby Market Globalists throwing a tantrum over the Fair and Reciprocal Trade program to defend the USA Workers and industries.
The Cry Baby Market Globalists want the status quo… well the theft of the American Middle Class will end starting today!
The Cry Baby Market Globalists can take a hike!
Joseph — you are indeed funny. you know this is just a memorandum. Not even an executive order. Like steel, this will be watered down as well to be meaningless. but of course will play well with the base. But enjoying this down move on spx and scaled several puts.
I’d suggest the NYTimes editorial by Friedman about 1-2 weeks ago on what SHOULD be done re: Chinese steel dumping and protectism that would actually work without disrupting world trade more broadly. It was very specific and constructive, and I thought a very cogent perspective and set of recommendations. It was titled “Some Things are True Even If (name deleted) Believes Them”.
Friedman is a moron… always has been!
Memorandum or not… things will NOT remain the same. Will change dramatically over time.
My model of the moment is an impulse down off yesterday’s highs, a 1-2 complete, a 3 in progress, which has completed a 1 down and is currently in the 2 up. Invalidation is above today’s high. I will add to my short position on the turn back down and fresh sell triggers on the 5 minute.
Kevin did you do CCT? It’s ripped like a son of gun….
Yes and actually I’ve traded it just a bit for better or worse. Up overall for sure, current holding is down a tad but I’m in for the longer term now. Thanks again for the pointer (NOT a recommendation, lol!).
Haha, lol yes!
I dunno Kevin, this bounce looks pretty healthy. I took profit just off the low. We shall see…
On the 5 minute chart I’m seeing a 5 down from the high yesterday post-Fed. I expect we are now in a 3 up. I cashed in some shorts yesterday at close and today near the low. I am saving a chunk of cash right now to open another small short if we make it back above 2685 before 1:30pm.
Wave counts and politics…no one ever agrees, lol!!!
Could be…my take though is the 3 down is extending.
this is a big 2
DJI cannot surrender 24K. If it does…”Farewell and Adeiu…”
Keep the big picture in mind folk. Mr Market tipped his hand with DJI’s surrender of the 50 day and confirmed it when SPX followed suit. It was a foregone conclusion NDX would join them, new ATH notwithstanding. The next critical pivot is the 200 day MA, and the bulls really need to hold it. We will get an early clue of the outcome if momentum waxes, as opposed to wanes, as we approach it. The next buy signal will be a reclaim (not just an underside test) of the 50 day by ALL the indices. We now have two official HOs on the clock. Have a great trading day everyone!
HO’s?
Hindenburg Omens.
The SPX gap at 2750 to 2741 held yesterday adding confidence to it being a break away gap. The bear flag on the 5 minute chart gives a projection of 2680 as pointed out a couple of days ago. If we break 2647 then we have a double top in play at 2790 giving a projected low of at least 143 points below 2647 or 2504.
It should also be pointed out that since the SPX high at the end of January, we have 5 waves down and 3 waves up on the daily chart. This could be labeled as a wave 1 down and wave 2 up with the current downwards movement as the beginning of a third wave down. For a free view of one such count see Daneric’s count. But I have seen other such counts as well which are not available free to the public.
Folks, this could get as ugly as what we saw in early February. Besides that, have a great day.
SPX close to hitting the parallel line of the top trend line (Feb 26 high to Mar 13 high) projected from the Mar 2 low. Could be support. Around 2677 or so.
Also, considering it’s probably a 5 wave impulse down off yesterday’s high, a 1 and 2 are complete, the 3 is in motion, and the 4…could have kicked off here. If so, invalidation at 2709.8 (the high side of the gap). The swing low on March 18 at 2694.8 could/should act as support if a 4 up does fire off here (in the middle of the gap), and of course there’s the 2700 pivot generally.
It’s quite possible the 4 up is already in and price is now starting the final 5 down. I’m not convinced; I don’t really see a completed ABC movement up, so perhaps it is the 4 and it’s in the C up phase now. There’s more fibo support at 2674.5 or so if/when price keeps falling here. 5 minute momentum has flattened and while negative…is slightly rising.
That lower channel line isn’t going easily…and I stay very cautious until it is clearly breached. It’s the obvious “macro level” turn point for this market. If it gets breached, I would expect serious increase in downward momentum quickly.
Possibly in a 3 of a 3 now (11:30am eastern), of the impulse down off yesterday’s high. If so, momentum should increase…
It looked like a furious battle unfolded in the markets today. That ramp higher in the indices represented literally hundreds of billions of cash (30:1 leverage?)dumped into the market in very short order. If DJI and SPX had been above their respective 50 day MA, I would not have dared to short the ramp. Coming after an announcement of a rate hike (with three more to come) and in an environment of QT, it was an absolute gift. These initial manic moves surrounding FEDSPEAK are usually predictably quickly reversed. The size of the candles suggest there are some players with very deep pockets trading both sides of this market. PPT vs the banksters? The shooting stars in the indices suggest the bears won the day, as the ramp was sold with authority. It will be interesting to see what NDX does about its own 50 day.
Foist!