Downwards movement was expected to continue for Wednesday, which is exactly what has happened.
Summary: Expect downwards movement now for at least a few days. It could be choppy, overlapping and weak. Or it could be a strong downwards wave. Have some confidence in a downwards trend now if price makes a new low now below 2,732.
This view has support today from a Bearish Engulfing reversal pattern, which has support from volume, and a bearish signal from both the AD line and inverted VIX.
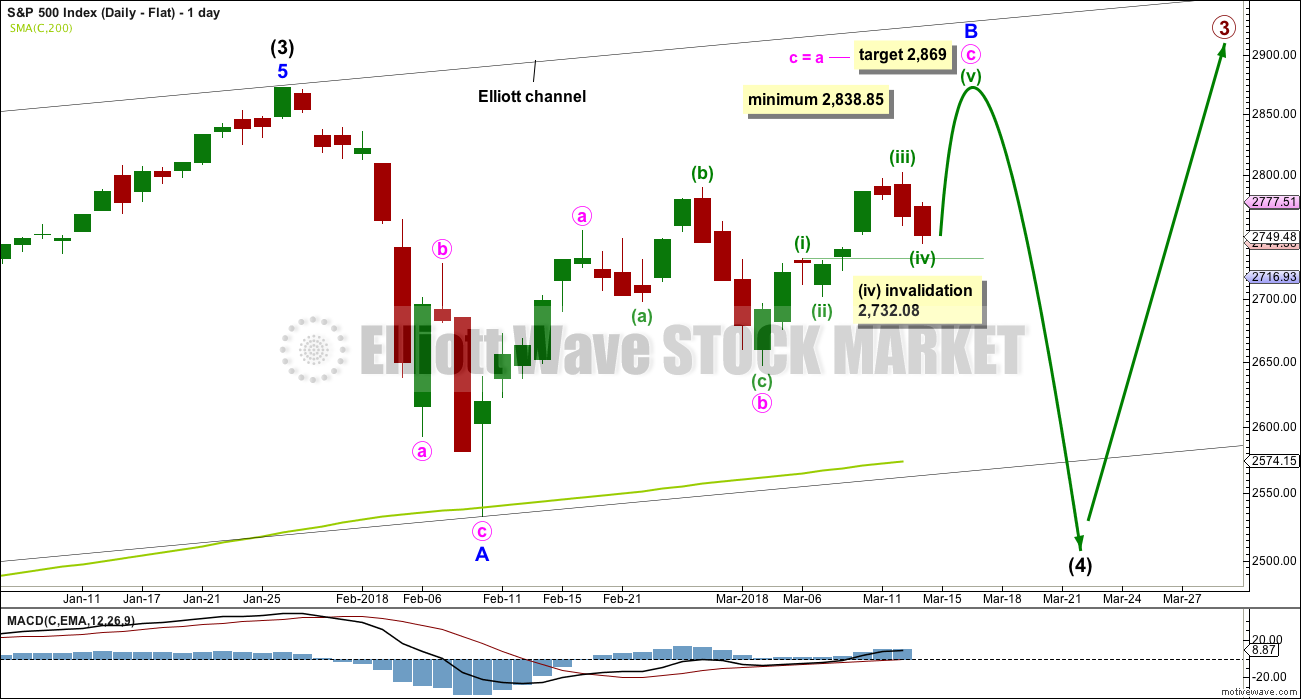
A new high above 2,801.90 would see an expectation of more upwards movement to either 2,845 or 2,869.
Always practice good risk management. Always trade with stops and invest only 1-5% of equity on any one trade.
The biggest picture, Grand Super Cycle analysis, is here.
Last historic analysis with monthly charts is here. Video is here.
An alternate idea at the monthly chart level is given here at the end of this analysis.
An historic example of a cycle degree fifth wave is given at the end of the analysis here.
MAIN ELLIOTT WAVE COUNT
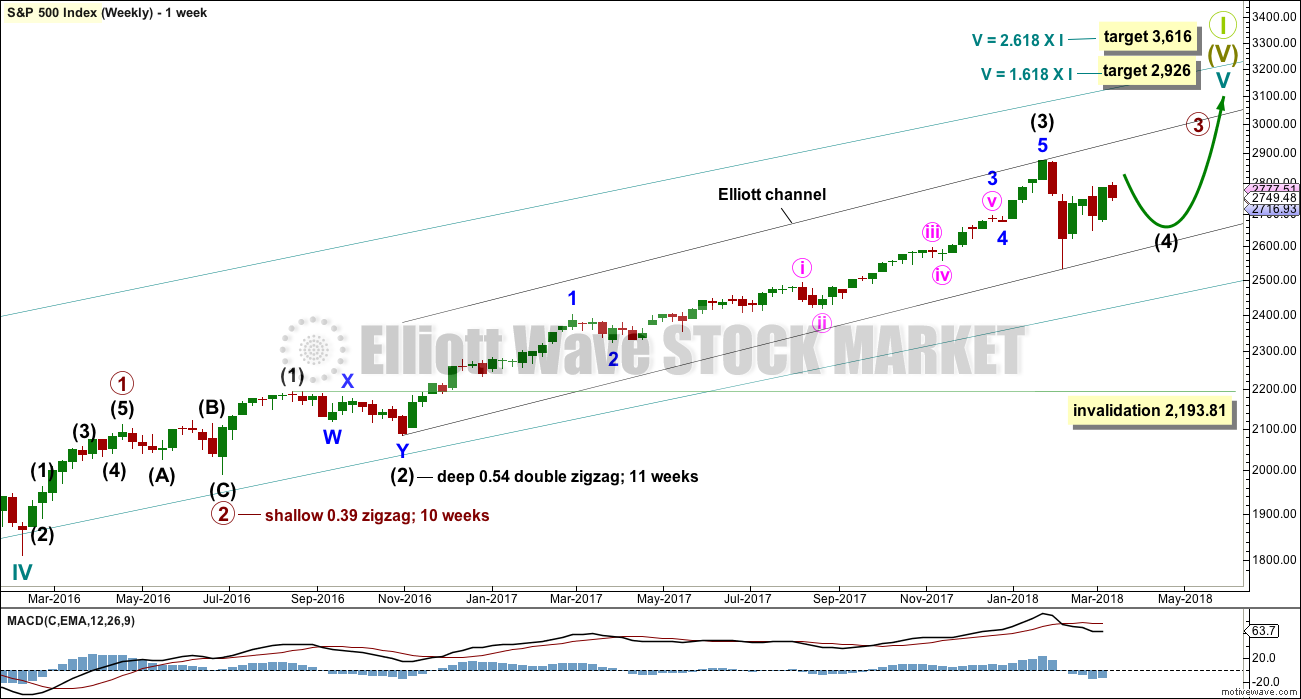
WEEKLY CHART
Cycle wave V must complete as a five structure, which should look clear at the weekly chart level. It may only be an impulse or ending diagonal. At this stage, it is clear it is an impulse.
Within cycle wave V, the third waves at all degrees may only subdivide as impulses.
Intermediate wave (4) has breached an Elliott channel drawn using Elliott’s first technique. The channel is redrawn using Elliott’s second technique as if intermediate wave (4) was over at the last low. If intermediate wave (4) continues sideways, then the channel may be redrawn when it is over. The upper edge may provide resistance for intermediate wave (5).
Intermediate wave (4) may not move into intermediate wave (1) price territory below 2,193.81. At this stage, it now looks like intermediate wave (4) may be continuing further sideways as a combination, triangle or flat. These three ideas are separated into separate daily charts. All three ideas would see intermediate wave (4) exhibit alternation in structure with the double zigzag of intermediate wave (2).
A double zigzag would also be possible for intermediate wave (4), but because intermediate wave (2) was a double zigzag this is the least likely structure for intermediate wave (4) to be. Alternation should be expected until price proves otherwise.
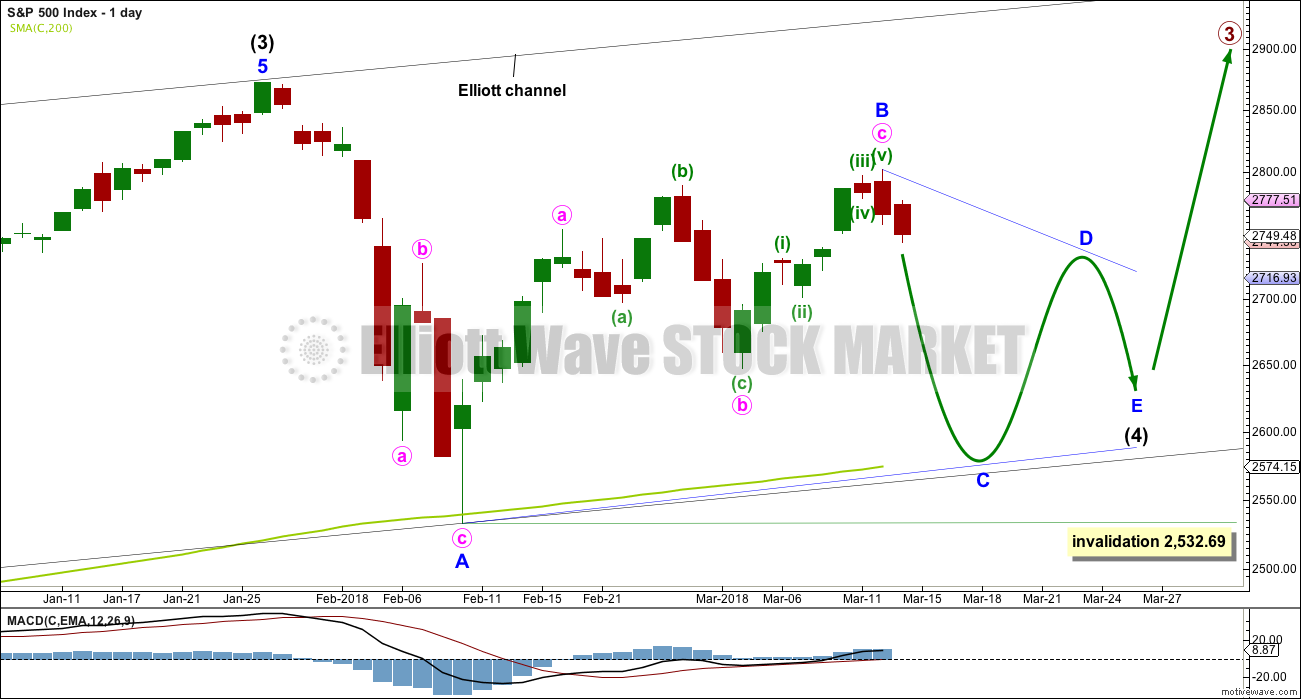
DAILY CHART – TRIANGLE
This first daily chart outlines how intermediate wave (4) may now continue further sideways as a contracting or barrier triangle. It is possible that minor wave B within the triangle was over at today’s high, which would mean the triangle would be a regular triangle. Minor wave C downwards may now begin and may be a single or double zigzag.
Minor wave C may not make a new low below the end of minor wave A at 2,532.69.
Intermediate wave 2 lasted 11 weeks. If intermediate wave (4) is incomplete, then it would have so far lasted only six weeks. Triangles tend to be very time consuming structures, so intermediate wave (4) may total a Fibonacci 13 or even 21 weeks at its conclusion.
Because this is the only daily chart which expects price to continue to find support at the 200 day moving average, it is presented first; it may have a slightly higher probability than the next two daily charts.
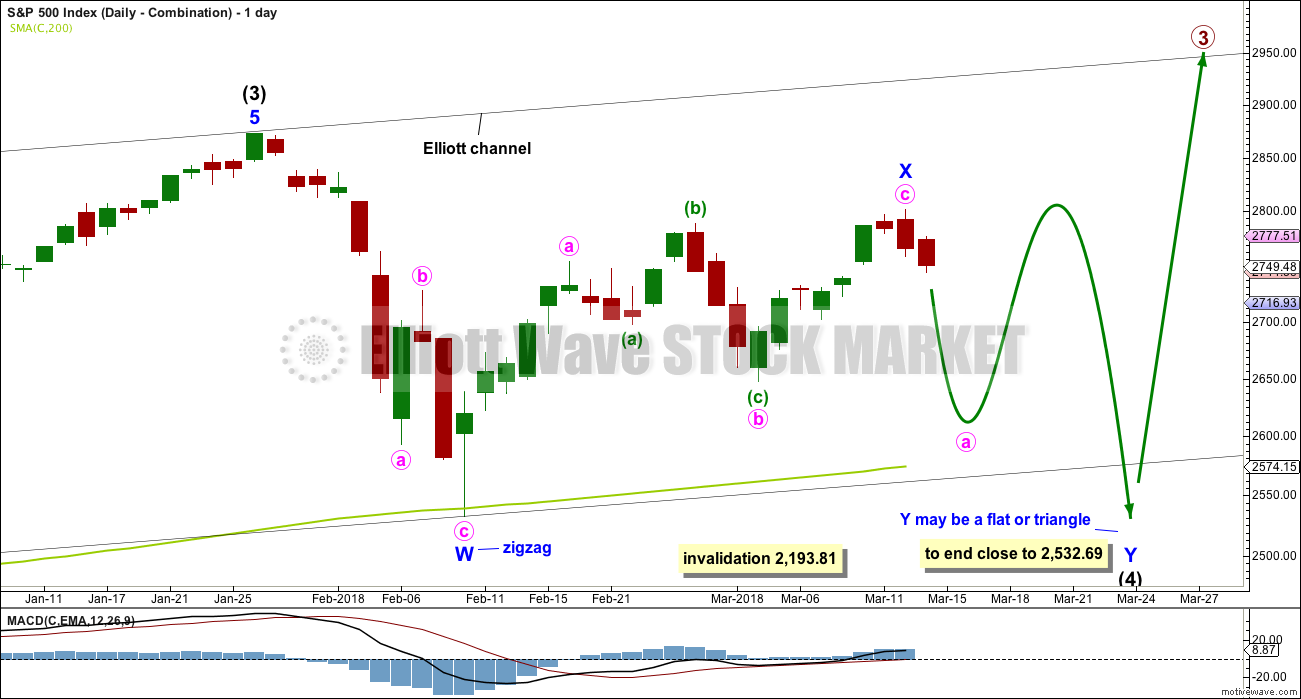
DAILY CHART – COMBINATION
Double combinations are very common structures. The first structure in a possible double combination for intermediate wave (4) would be a complete zigzag labelled minor wave W. The double should be joined by a three in the opposite direction labelled minor wave X, which may today be a complete zigzag. X waves within combinations are typically very deep; if minor wave X is over at today’s high, then it would be a 0.79 length of minor wave W, which is fairly deep giving it a normal look. There is no minimum nor maximum requirement for X waves within combinations.
The second structure in the double would most likely be a flat correction labelled minor wave Y. It may also be a triangle, but in my experience this is very rare.
A flat correction would subdivide 3-3-5. Minute wave a must be a three wave structure, most likely a zigzag.
The purpose of combinations is to take up time and move price sideways. To achieve this purpose the second structure in the double usually ends close to the same level as the first. Minor wave Y would be expected to end about the same level as minor wave W at 2,532.69. This would require a strong overshoot or breach of the 200 day moving average.
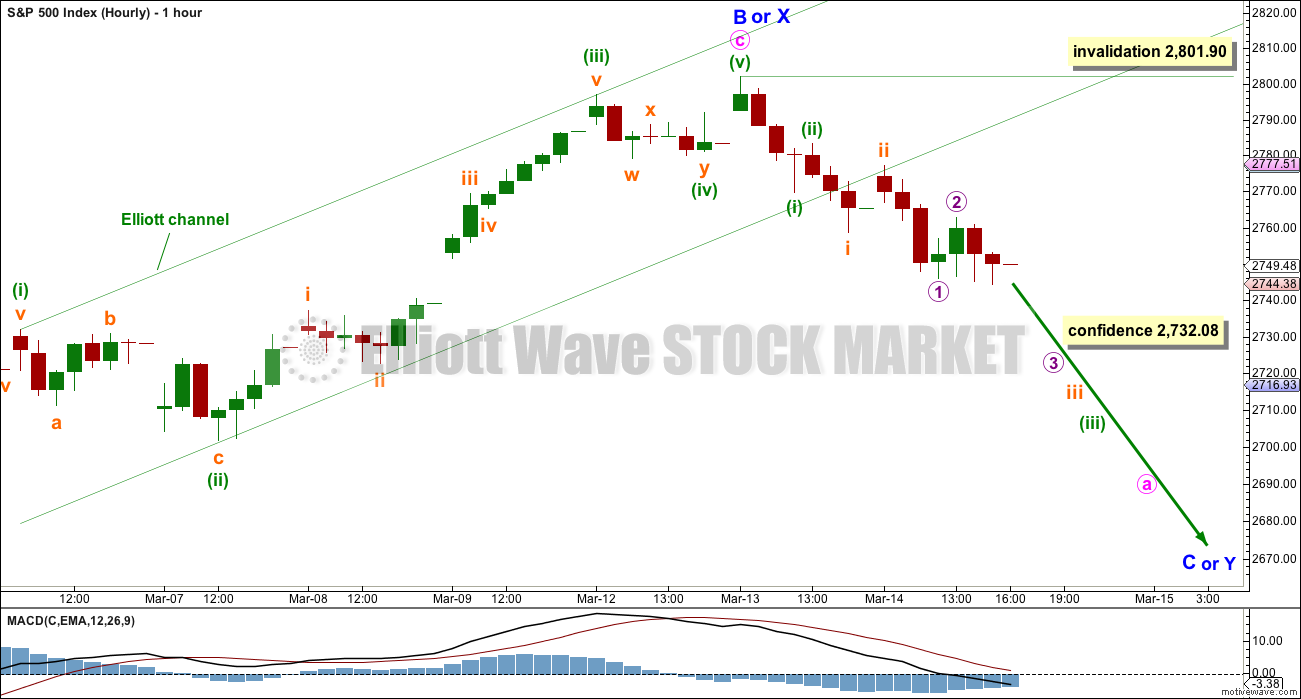
HOURLY CHART
An impulse upwards for minute wave c may be complete. The middle portion of minuette wave (iii) does not have a very good look as a five, but it is possible it could be over. The S&P just does not always have fives that look like fives.
If minor wave B or X is complete for a triangle or combination, then minor wave C or Y downwards should have begun.
Minor wave C may be a single or double zigzag for a triangle. Minor wave Y may be a flat or triangle for a combination. The first piece of downwards movement within a wave at minor degree should be a five on the hourly chart. Within that first five down, no second wave correction may move beyond its start above 2,801.90.
So far there may now be three overlapping first and second waves complete; a five down cannot yet be seen at the hourly chart level. This indicates an increase in downwards momentum may be seen in the next day or so.
DAILY CHART – FLAT
Flat corrections are very common. The most common type of flat is an expanded flat. This would see minor wave B move above the start of minor wave A at 2,872.87.
Within a flat correction, minor wave B must retrace a minimum 0.9 length of minor wave A at 2,838.85. The most common length for minor wave B within a flat correction would be 1 to 1.38 times the length of minor wave A at 2,872.87 to 3,002.15. An expanded flat would see minor wave B 1.05 times the length of minor wave A or longer, at 2,889.89 or above.
When minor wave B is a complete corrective structure ending at or above the minimum requirement, then minor wave C downwards would be expected to make a new low below the end of minor wave A at 2,532.69 to avoid a truncation.
HOURLY CHART – FLAT
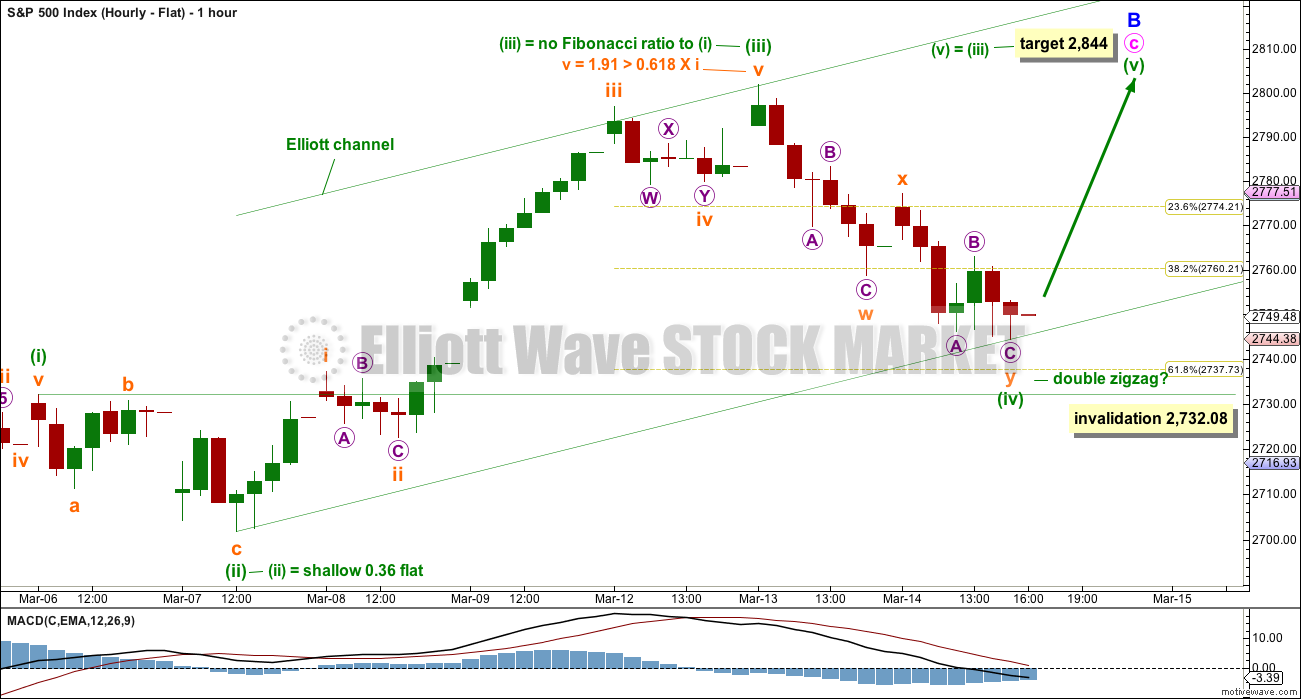
It is also possible that upwards movement is not over and minute wave c is incomplete. This has a better look at the hourly chart level, but it still does not have support today from classic technical analysis.
If intermediate wave (4) is unfolding as a flat correction, then within it minor wave B has not yet met the minimum requirement of 0.9 the length of minor wave A at 2,838.85.
Within minute wave c, the correction of minuette wave (iv) may not move into minuette wave (i) price territory below 2,732.08.
Minuette wave (iv) has breached a channel drawn using Elliott’s first technique, so the channel is redrawn using the second technique. Draw the first trend line from the ends of minuette waves (ii) to (iv), then place a parallel copy on the end of minuette wave (iii). Minuette wave (v) may end either mid way within this channel, or about the upper edge.
A new target for minute wave c to end is calculated today at minuette degree. This would see the minimum requirement for minor wave B just met.
DAILY CHART – ALTERNATE
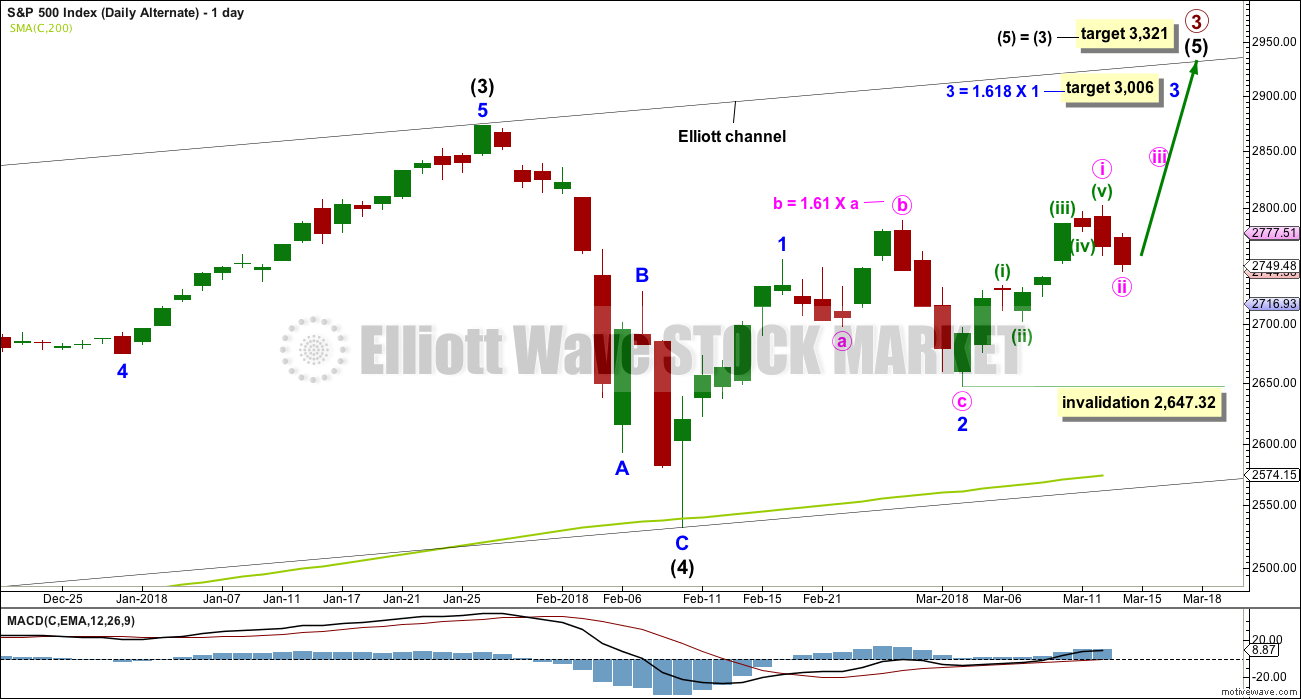
It is possible still that intermediate wave (4) was complete as a relatively brief and shallow single zigzag.
A new all time high with support from volume and any one of a bullish signal from On Balance Volume or the AD line would see this alternate wave count become the main wave count.
Within minor wave 3, minute wave ii may not move beyond the start of minute wave i below 2,647.32.
TECHNICAL ANALYSIS
WEEKLY CHART
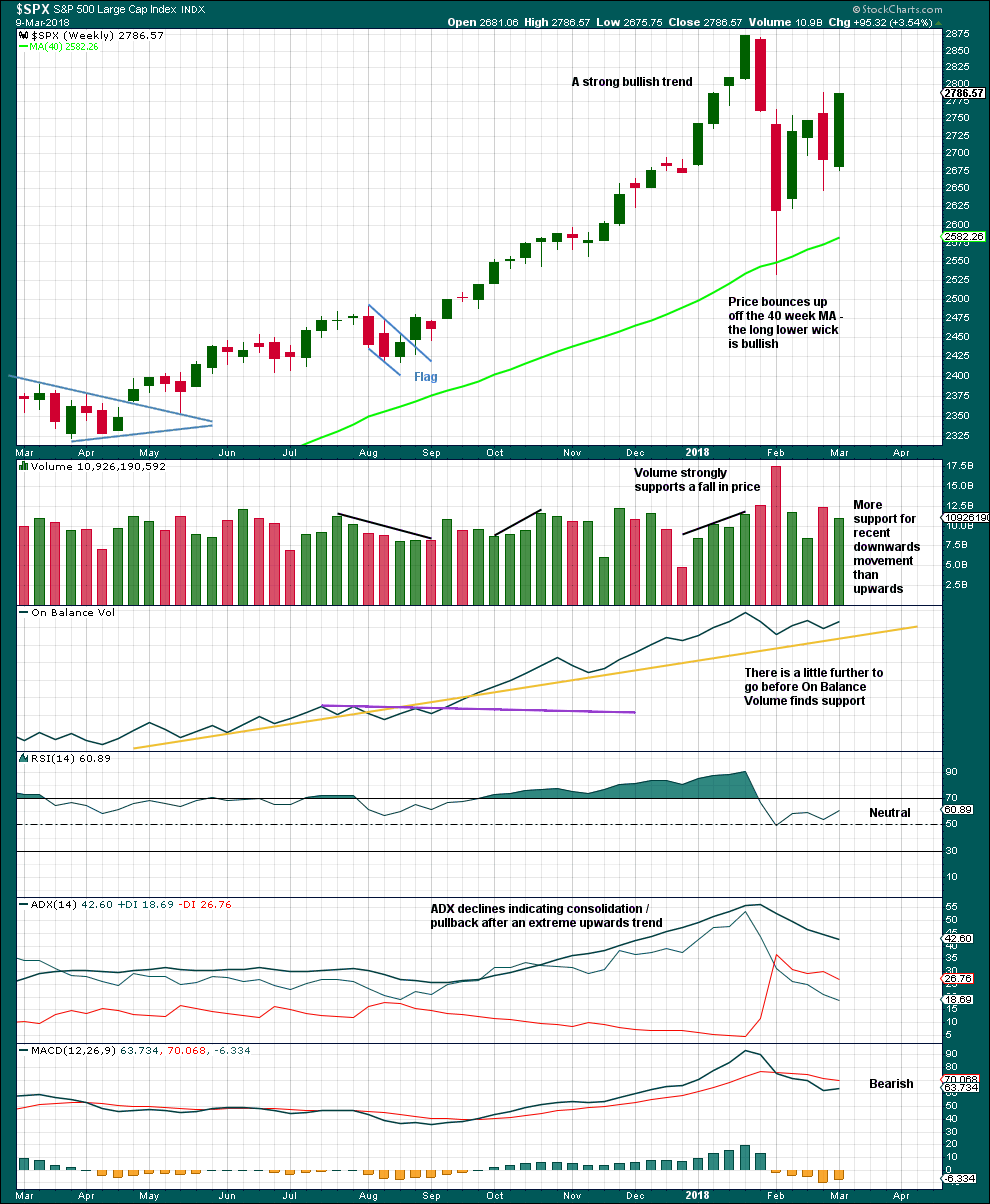
Click chart to enlarge. Chart courtesy of StockCharts.com.
The volume profile is bearish for the short term, but this has been the case for a long time in this market. Price has been rising on light and declining volume for years now. At this time, it will not be given much weight in this analysis.
The pullback has brought ADX down from very extreme and RSI down from extremely overbought. There is again room for a new trend to develop.
DAILY CHART
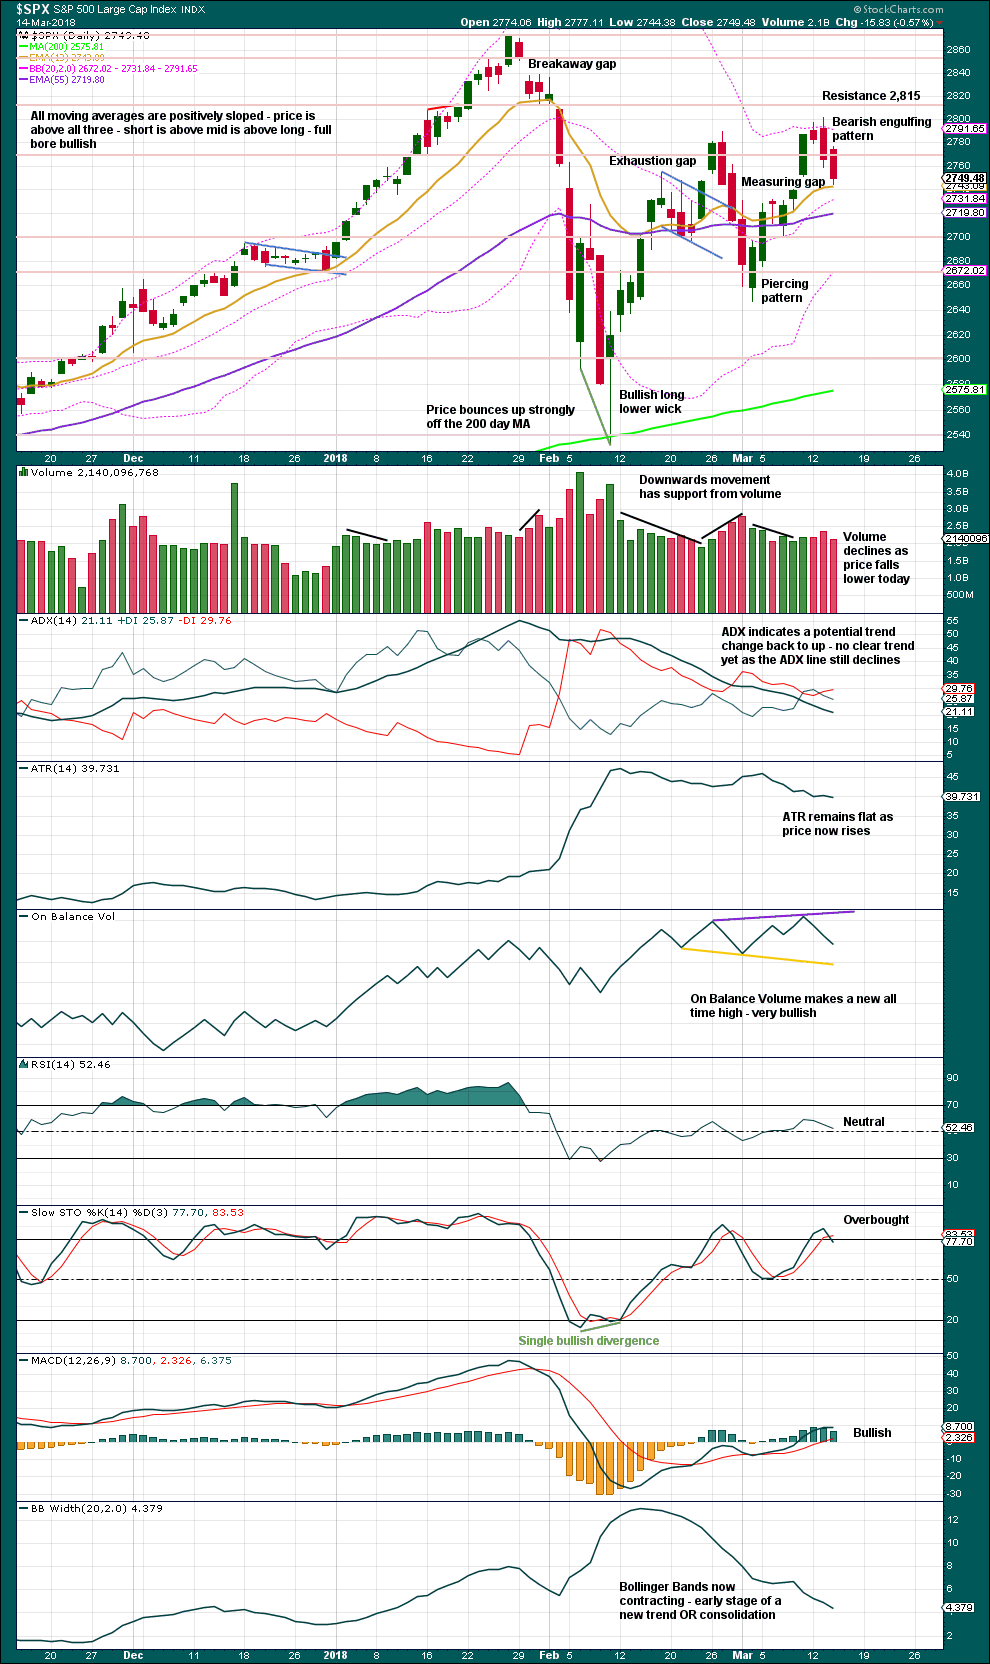
Click chart to enlarge. Chart courtesy of StockCharts.com.
The measuring gap gives a target at 2,845. This is remarkably close to the target on the hourly chart for a flat correction.
The measuring gap remains open but only just. If it is closed tomorrow with a new low below 2,740.45, then it must be relabelled as an exhaustion gap.
Price fell of its own weight today. This is not necessarily bullish as this can continue for some distance, but neither is it bearish. I would expect price to keep falling now until one of these things is seen:
1. A daily candlestick with a long lower wick.
2. A bullish signal from one of On Balance Volume, VIX or the AD line.
3. Stochastics reaching oversold and then exhibiting some bullish divergence with price.
VOLATILITY – INVERTED VIX CHART
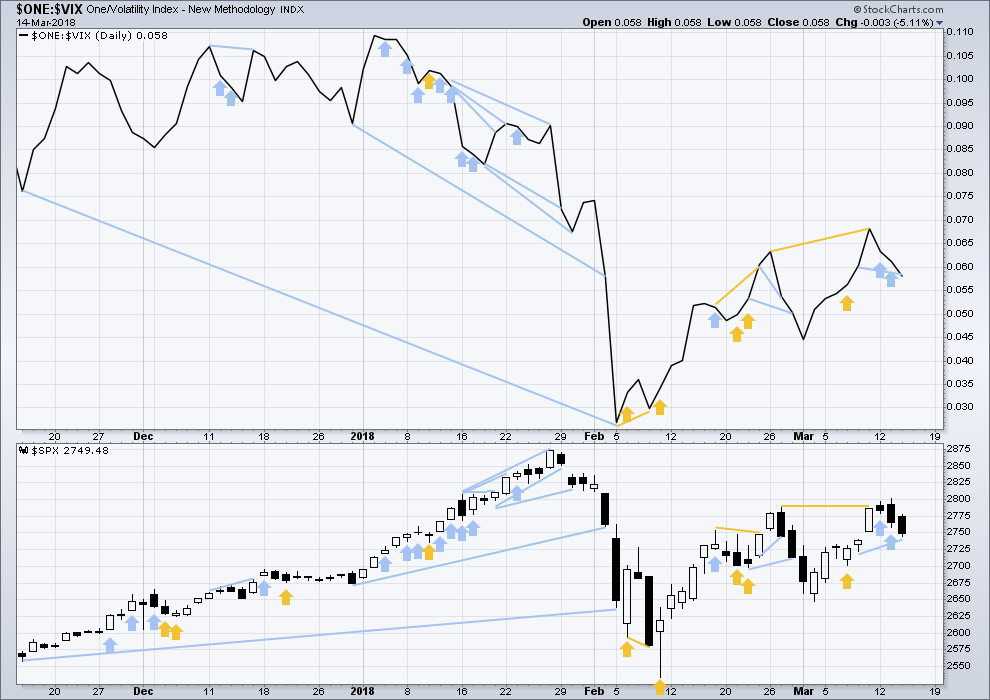
Click chart to enlarge. Chart courtesy of StockCharts.com.
So that colour blind members are included, bearish signals will be noted with blue and bullish signals with yellow.
Normally, volatility should decline as price moves higher and increase as price moves lower. This means that normally inverted VIX should move in the same direction as price.
Bearish divergence noted in last analysis has now been followed by a downwards day. It may be resolved here, or it may need another downwards day to resolve it. There is still divergence today: inverted VIX has made a new low below the prior low five sessions ago, but price has not yet made a corresponding new low. If VIX is a leading indicator, then this divergence is bearish.
BREADTH – AD LINE
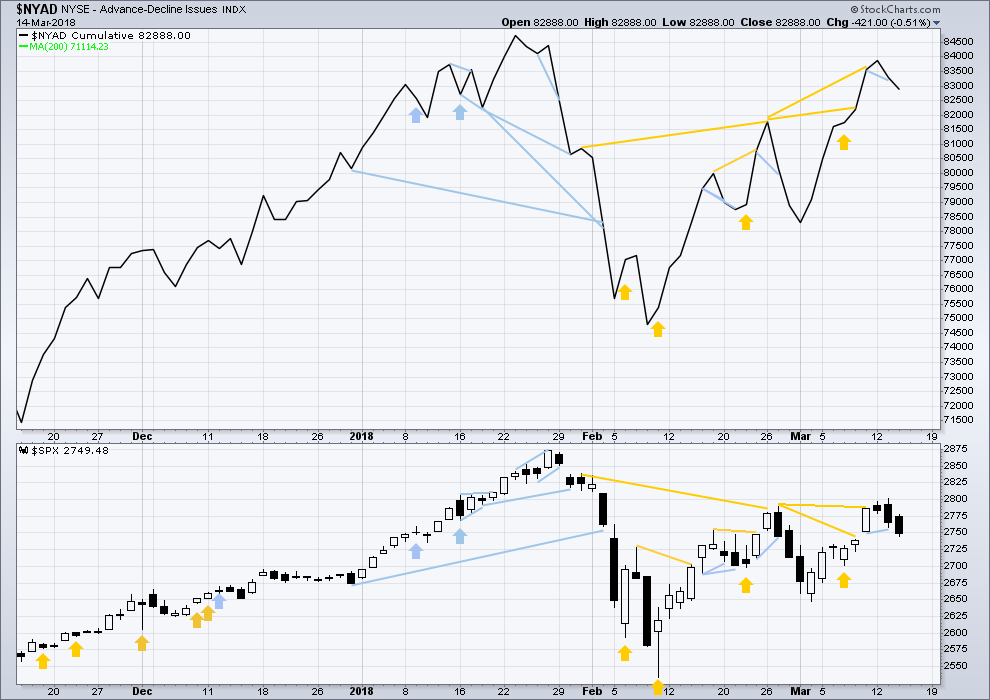
Click chart to enlarge. Chart courtesy of StockCharts.com.
There is normally 4-6 months divergence between price and market breadth prior to a full fledged bear market. This has been so for all major bear markets within the last 90 odd years. With no longer term divergence yet at this point, any decline in price should be expected to be a pullback within an ongoing bull market and not necessarily the start of a bear market.
All of small, mid and large caps last week completed an outside week. All sectors of the market at this time appear to be in a consolidation.
Breadth should be read as a leading indicator.
Bearish divergence noted in last analysis has now been followed by a downwards day. It may be resolved here, or it may need another downwards day to resolve it. There is no new divergence today between price and the AD line.
DOW THEORY
All indices have made new all time highs as recently as seven weeks ago, confirming the ongoing bull market.
The following lows need to be exceeded for Dow Theory to confirm the end of the bull market and a change to a bear market:
DJIA: 17,883.56.
DJT: 7,039.41.
S&P500: 2,083.79.
Nasdaq: 5,034.41.
Charts showing each prior major swing low used for Dow Theory are here.
Published @ 09:50 p.m. EST.

Hi Kevin. Your 2pm low for the day on NDX happened right on as you predicted! That’s pretty nifty… just saying 🙂
Thank you, yes today I got it long, then got it short, then got it long. I’d say the market was in a somewhat predictable range and it behaved canonically for a change!!
Updated hourly chart:
It has a problem within submineutte ii, but this wave count fits and meets all EW rules. Checked on the 5 minute chart.
SPX price is diverging from both my slow stochastic and MACD (I use custom parameters) on the hourly chart. Though price continues moving down for the moment. A turn back up here is not impossible, and short term cycle wise looking at the 5 minute, a relative high is due before end of day.
What’s this, a coil? And ending diagonal? A starting diagonal? Or not…? Where’s Verne when you need him.
This is SPX daily bars.
Similar structure in NDX.
Resembles a bear flag as well. Markets on both sides are dangerous here in my opinion. My interpretation of the constant pump is that it is a sign of sheer desperation. Either way a big move is coming with all of the coiling and over lapping wave action.
Yea, I’d say it’s more likely to break south than north. Waiting for the complete set up, could be a nice ride.
Hi Kevin
What kind of set up are you waiting for regarding SPX price wise?
Thank You
Clear indications of renewed trending starting at the 5 min. I’m not being real picky right now about entries, because of the high volatility. “I’m taking off on anything!” lol!!! I modulate size based on 10 or more surround factors (the usual stuff), and trade management approach as well. But right now for entry set ups, once it starts moving on the 5 minute…I’m probably on it (in whatever market is hottest of the major indices, and/or in a few hot sectors like finance). No matter which direction. In this market…no one REALLY knows. So follow the price action first and foremost is my approach.
I agree with the break south, and tomorrow should be whippy again due to option expiration; down big early, then finish close to flat would be par for the course.
It would be a leading diagonal, coming off a low. This would fit the alternate wave count.
Second wave corrections following leading diagonals are most often very deep, much deeper than 0.618 usually.
It would look like this. A leading contracting diagonal. Needing only a fifth wave up to overshoot the i-iii trend line.
The invalidation is where minute iv would reach = minute ii. The diagonal is contracting so minute iv may not be longer than minute ii.
Hi Lara
Im confused now
this last chart your showing here if it were to overshoot the i and the iii trend line after that would it keep rising?
Or would it contract after
Thank You
This is just another idea for the alternate.
If price overshoots the i-iii trend line then quickly reverses it would be indicated.
Contracing diagonals almost always end with a small overshoot of the 1-3 trend line. Leading diagonals in first wave positions are often followed by very deep second wave retracements.
The arrow on that chart does not illustrate the expected pathway for price in this idea.
Eric, I don’t want to be confusing anyone here. I’ll publish this idea with a fuller explanation and better arrow in today’s analysis.
Wowza. It is early morning and yet I am first.
Today is already shaping up to be a small range, super whippy kind of go nowhere day. We’ll see if any trend develops but right now it looks like it may be small range all day long. I have very mixed signals at the lower timeframes (5 minute and hourly). Standing aside.
I started getting long triggers and am in on the small side (because of Lara’s bearish TA signals), DDM, UPRO, XLK, GS…okay market gods be good to me now!
Took small profits on the longs and am now short NDX. I’ve been mapping the high-low periods, and I expect a low in the 1:20-2pm EST timeframe. We’ll see, it’s an interesting way to guage a downside range trade. I’ll take 1/2 low in today’s range (below 7025). However, NDX is still in an hourly downtrend which conveniently has 21 ema and parabolic sar invalidation right at today’s high, so it’s a high leverage entry point at the hourly level. Overall a nice set up for a scalp + attempt to get in at a higher timeframe. That’s how I think about it anyway. I hope someone out there is having as much fun working this market as I am today. It’s not an easy one, lol!!
A zip, a zap…
Hi Kevin
are you trading the Nasdaq mini futures contracts?
Or something else?
Thank you