Some more downwards movement was expected but the target at 2,733 was inadequate.
The main and alternate Elliott wave counts are swapped over today.
Summary: Expect overall downwards movement to continue to about 2,584 – 2,571. Price may find support about the 200 day moving average.
Always practice good risk management. Always trade with stops and invest only 1-5% of equity on any one trade.
The biggest picture, Grand Super Cycle analysis, is here.
Last historic analysis with monthly charts is here. Video is here.
An alternate idea at the monthly chart level is given here at the end of this analysis.
An historic example of a cycle degree fifth wave is given at the end of the analysis here.
MAIN ELLIOTT WAVE COUNT
WEEKLY CHART
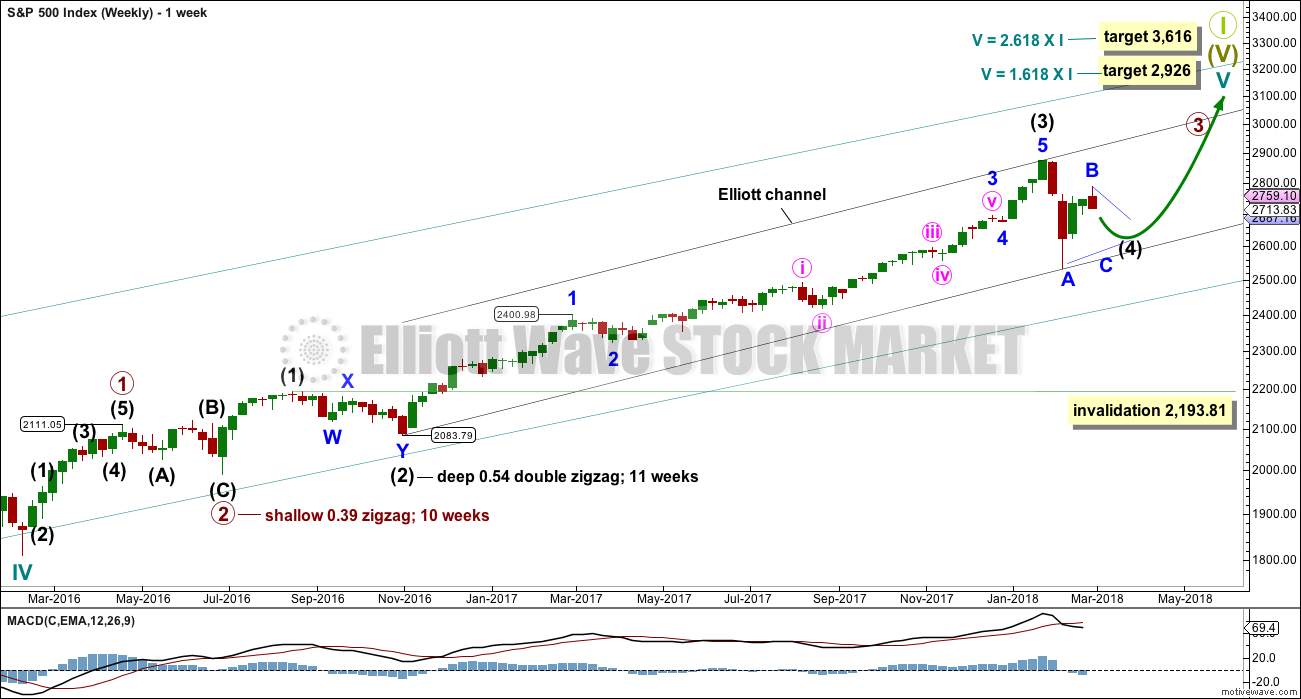
Cycle wave V must complete as a five structure, which should look clear at the weekly chart level. It may only be an impulse or ending diagonal. At this stage, it is clear it is an impulse.
Within cycle wave V, the third waves at all degrees may only subdivide as impulses.
Intermediate wave (4) has breached an Elliott channel drawn using Elliott’s first technique. The channel is redrawn using Elliott’s second technique. The upper edge may provide resistance for intermediate wave (5).
Intermediate wave (4) may not move into intermediate wave (1) price territory below 2,193.81. At this stage, it now looks like intermediate wave (4) may be continuing further sideways as a combination or triangle.
DAILY CHART
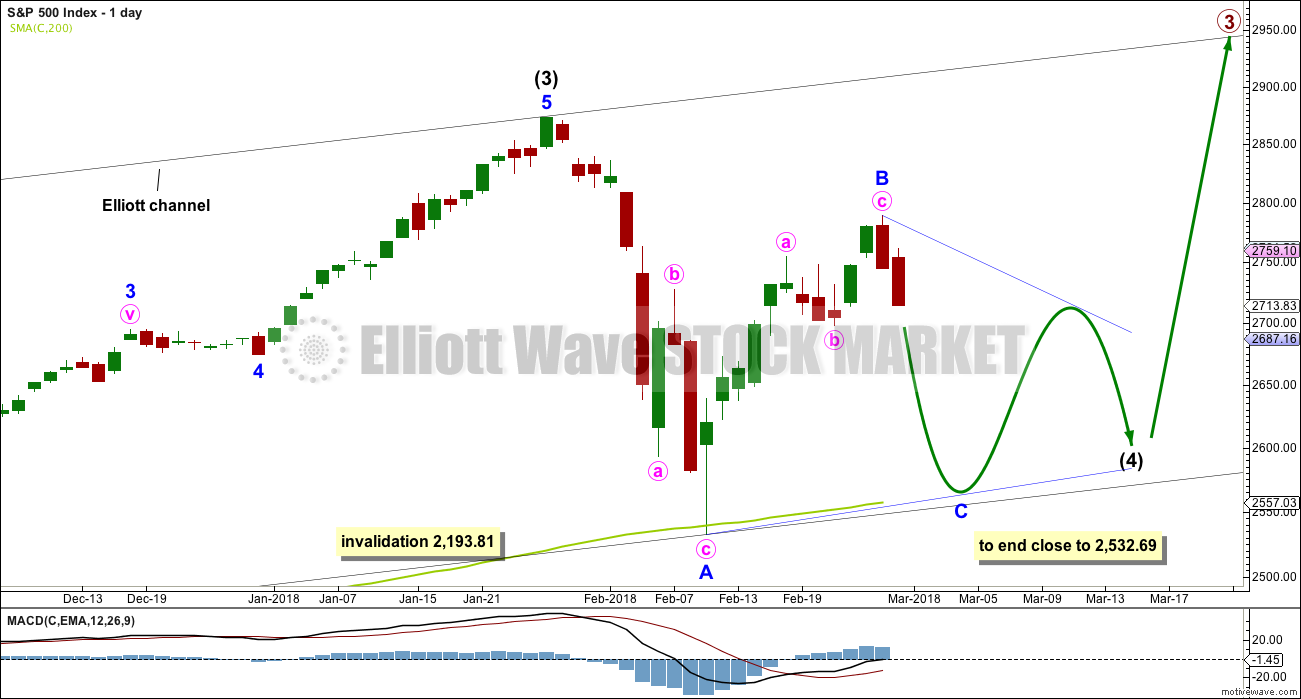
At this stage, it looks like intermediate wave (4) may be continuing sideways. It may be either a triangle, combination or double zigzag. Of all of these three possible structures a double zigzag is very unlikely because that was the structure of intermediate wave (2).
Intermediate wave (4) is labelled today as a possible triangle. At this stage, both a triangle or combination would expect a zigzag downwards to complete, so the two ideas do not diverge in terms of short term structure or expected direction. When they diverge, then they will be charted separately.
Minor wave B is a 0.75 depth of minor wave A within the possible triangle. Minor wave C may find support about the 200 day moving average. A reasonable range for it to end would be about 0.8 to 0.85 the length of minor wave B at 2,584 to 2,571.
If intermediate wave (4) is a contracting or barrier triangle, then minor wave C within it may not move beyond the end of minor wave A below 2,532.69. An expanding triangle would require a new low below 2,532.69, but these are exceptionally rare structures, so rare in fact that I have never seen one. It will not be expected here.
If this downwards zigzag makes a new low below 2,532.69, then intermediate wave (4) would be labelled as a double combination. The second structure for minor wave Y would be expected to be a flat correction. Double combinations are common structures.
HOURLY CHART
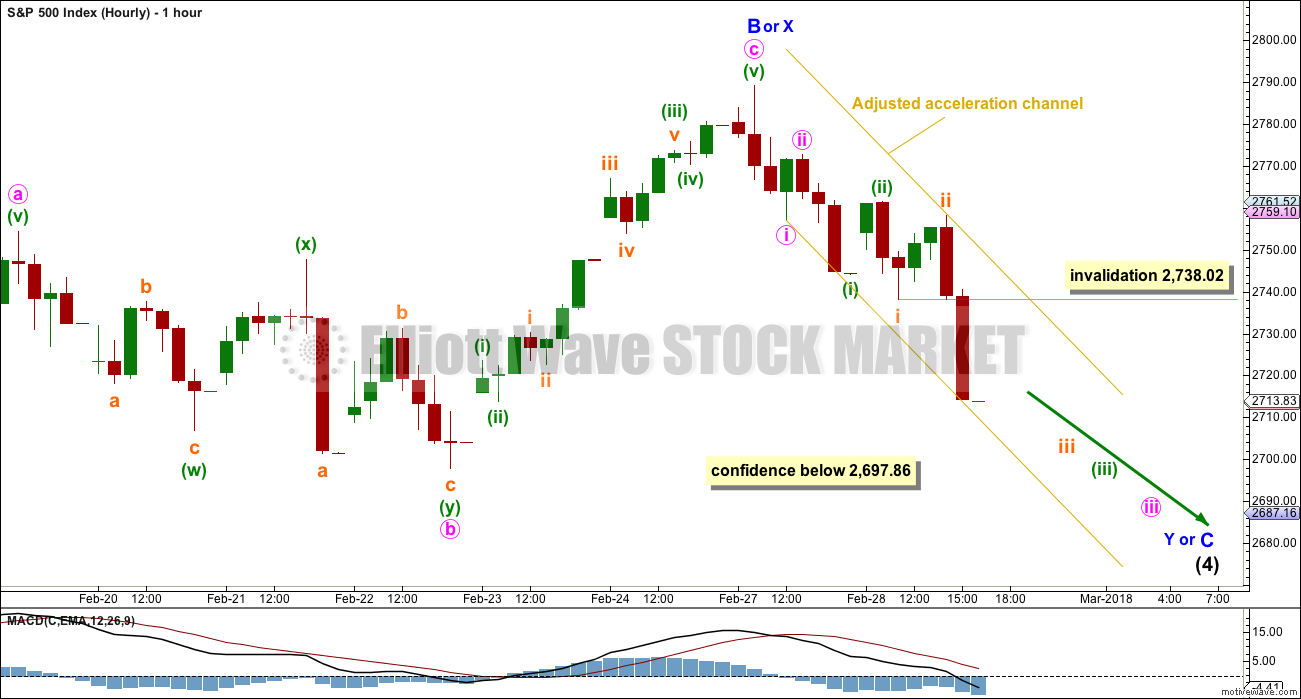
A five down looks like it is completing and has just passed the middle of a third wave. When the middle of the third wave is complete, then a series of small fourth wave corrections must remain below their respective first wave price territories.
The first in a series of three fourth wave corrections for subminuette wave iv may not move into subminuette wave i price territory above 2,738.02.
The acceleration channel may contain downwards movement. The upper edge may provide resistance for bounces along the way down.
ALTERNATE ELLIOTT WAVE COUNT
ALTERNATE DAILY CHART
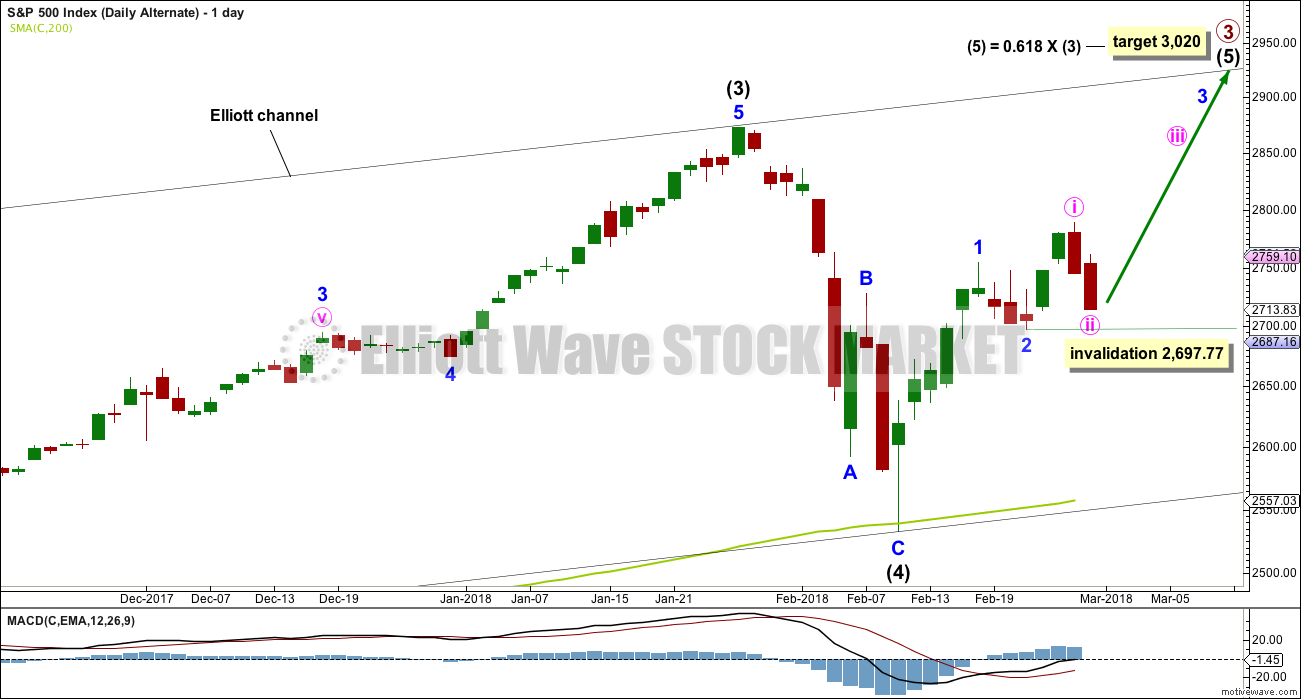
It is still possible that intermediate wave (4) is complete and intermediate wave (5) upwards has begun.
Within intermediate wave (5), so far minor waves 1 and 2 may be complete.
Within minor wave 3, minute wave ii may not move beyond the start of minute wave i below 2,697.77.
TECHNICAL ANALYSIS
WEEKLY CHART
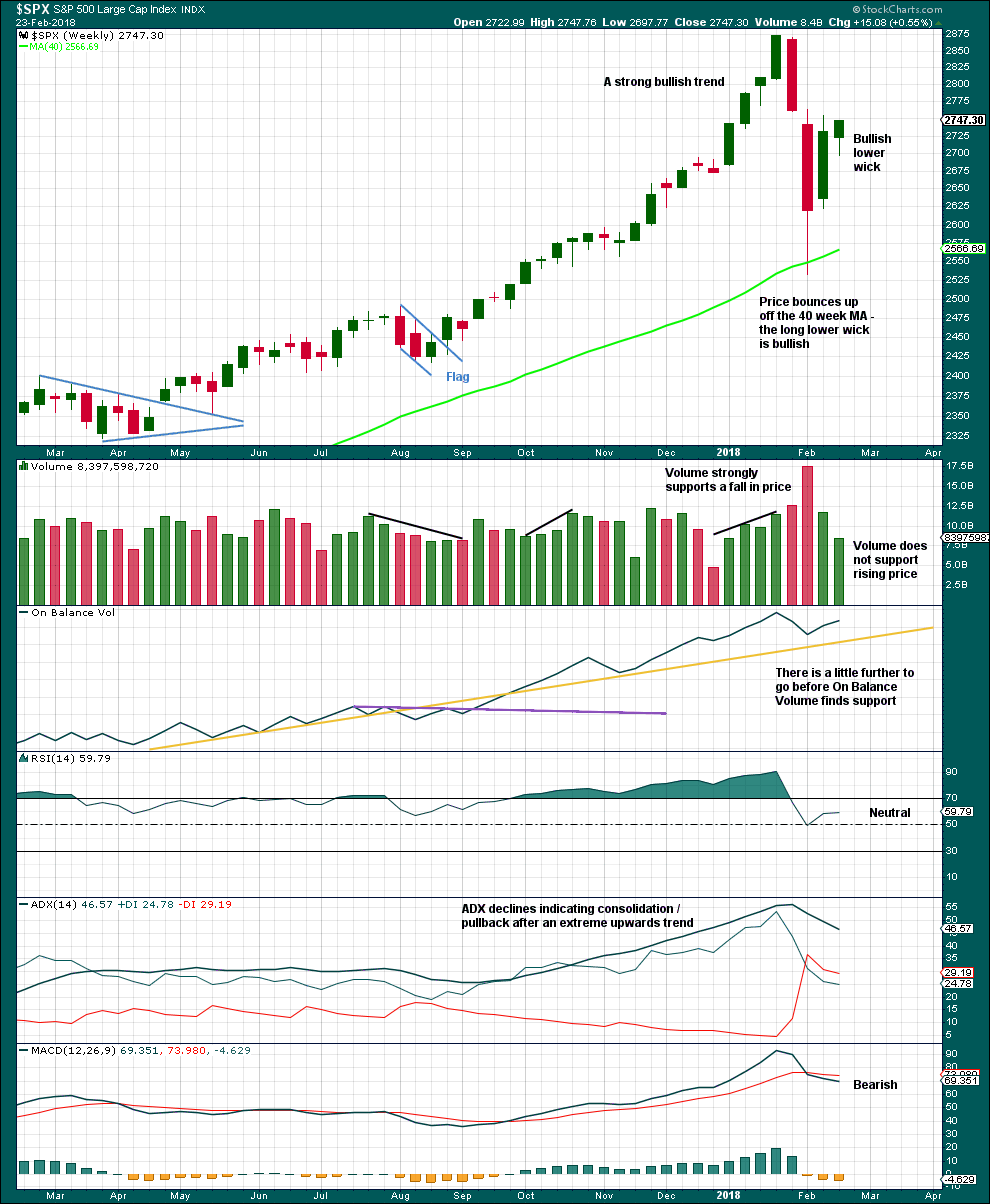
Click chart to enlarge. Chart courtesy of StockCharts.com.
Volume last week is much lower than the prior week, which is bearish.
The longer lower wick on the last weekly candlestick and the shaven head are bullish.
The pullback has brought ADX down from very extreme. A possible trend change to down is indicated, but as yet no new trend is indicated.
DAILY CHART
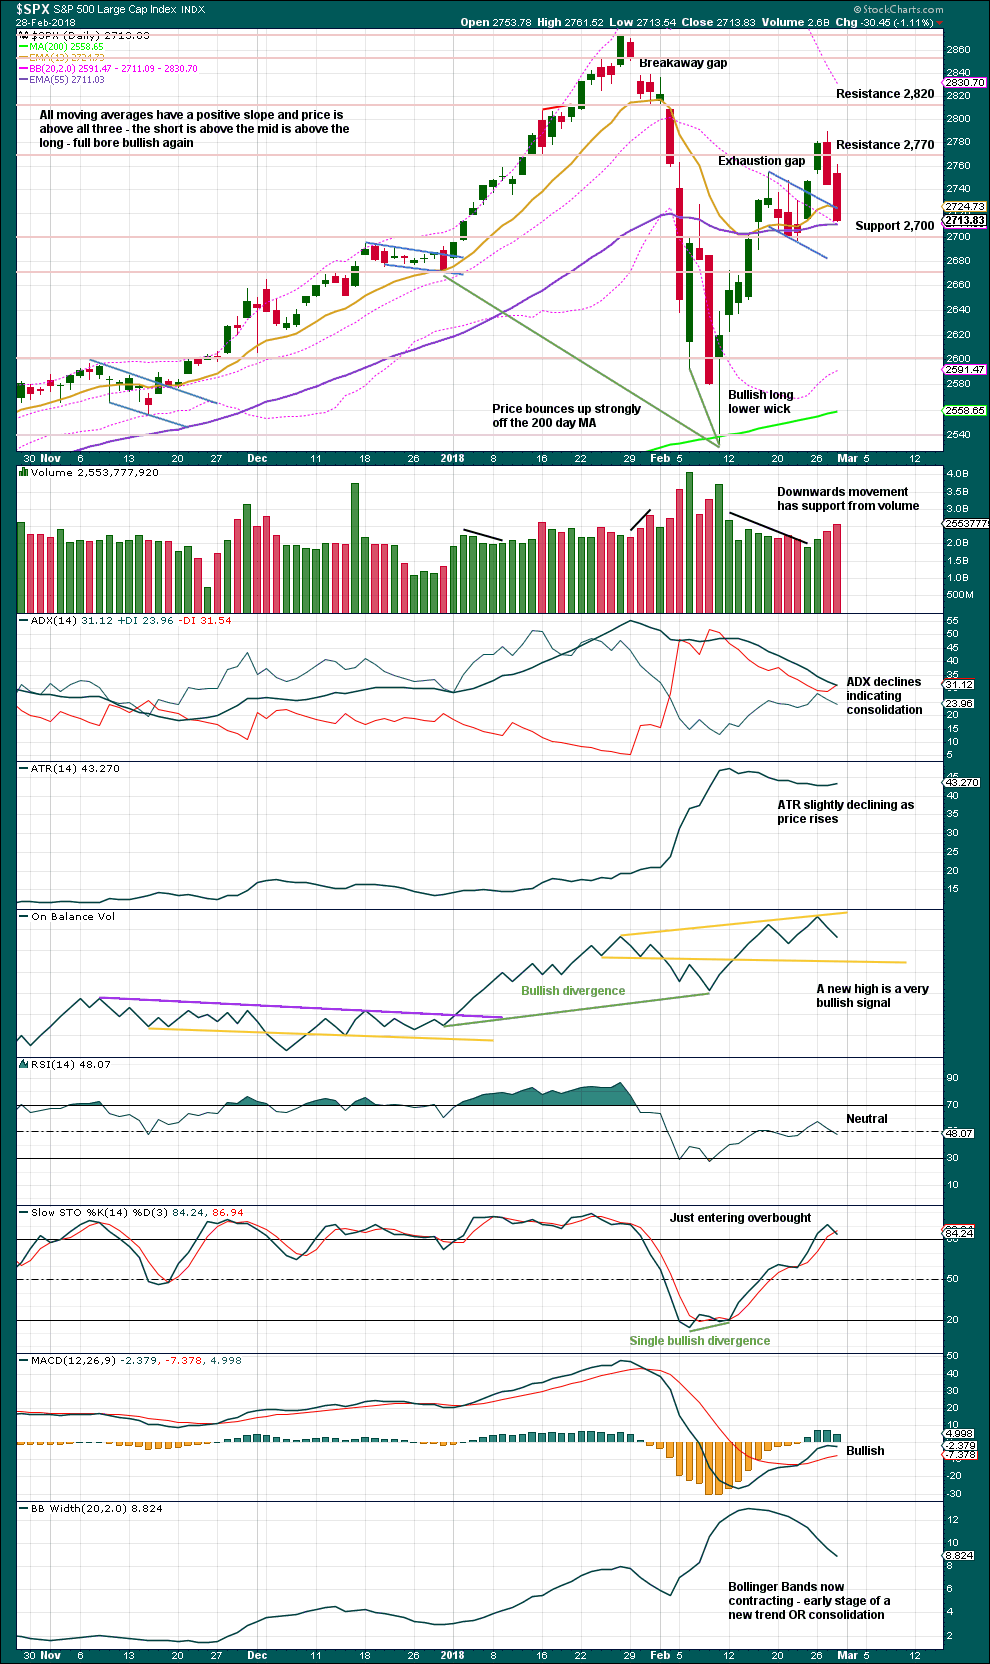
Click chart to enlarge. Chart courtesy of StockCharts.com.
On Balance Volume is still bullish, but note that this does not preclude the new main Elliott wave count. Another deep pullback may happen here, which may find support about the 200 day moving average.
The last two daily candlesticks are very bearish for the short term. There is some distance to go before On Balance Volume finds support and halts the fall in price.
VOLATILITY – INVERTED VIX CHART
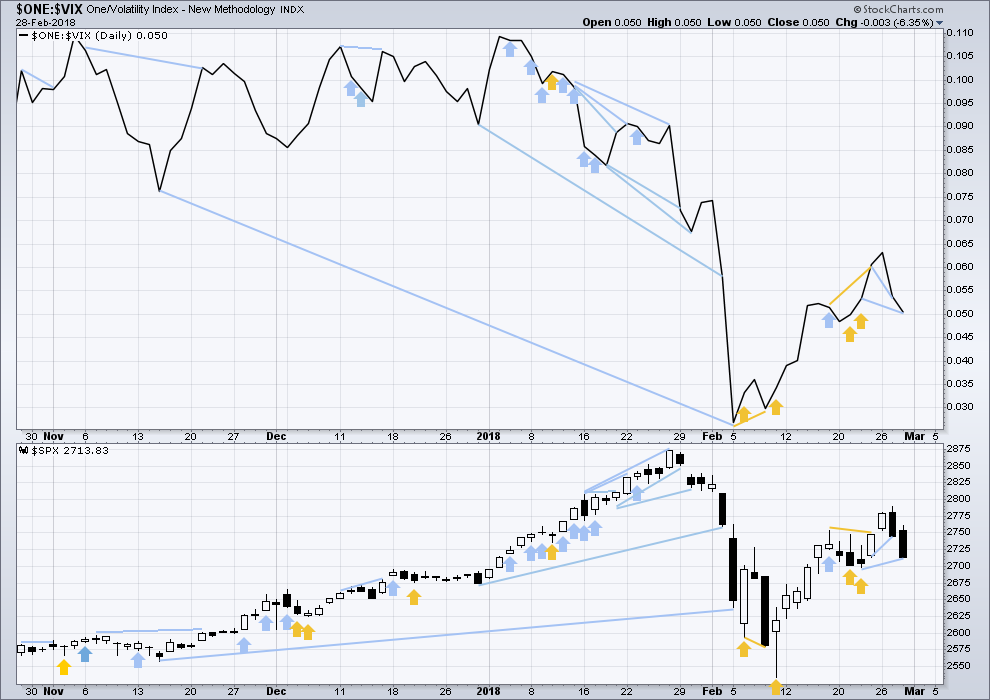
Click chart to enlarge. Chart courtesy of StockCharts.com.
So that colour blind members are included, bearish signals will be noted with blue and bullish signals with yellow.
Normally, volatility should decline as price moves higher and increase as price moves lower. This means that normally inverted VIX should move in the same direction as price.
Inverted VIX today has made a new low below the low of five sessions prior, but price has not. This divergence is bearish if inverted VIX is read as a leading indicator.
BREADTH – AD LINE
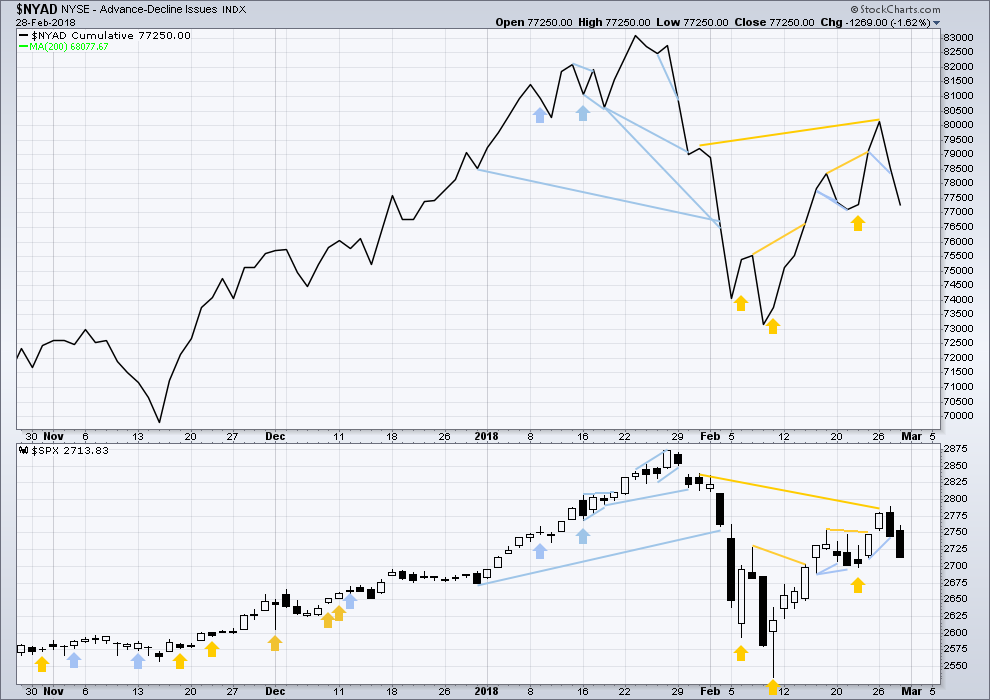
Click chart to enlarge. Chart courtesy of StockCharts.com.
There is normally 4-6 months divergence between price and market breadth prior to a full fledged bear market. This has been so for all major bear markets within the last 90 odd years. With no longer term divergence yet at this point, any decline in price should be expected to be a pullback within an ongoing bull market and not necessarily the start of a bear market.
All of small, mid and large caps last week moved upwards. The bounce has support from wide breadth.
Breadth should be read as a leading indicator.
Bearish divergence noted in last analysis has now been followed by a downwards day. It may be resolved here, or it may require another downwards day to resolve it. There is no new divergence today between price and the AD line.
DOW THEORY
All indices have made new all time highs as recently as five weeks ago, confirming the ongoing bull market.
The following lows need to be exceeded for Dow Theory to confirm the end of the bull market and a change to a bear market:
DJIA: 17,883.56.
DJT: 7,029.41.
S&P500: 2,083.79.
Nasdaq: 5,034.41.
Charts showing each prior major swing low used for Dow Theory are here.
Published @ 07:47 p.m. EST.

Looks like we get a fifth wave down first thing in the a.m. based on futures price action, with a tradeable bounce to follow…
Have a great evening everyone!
Futures are up… so???
A lot of other investment services are focused on telling their clients to raise cash as there likely will be a trade war (something similar given the tariffs announced earlier today). Look for selling into the strength if markets try to move up from current levels.
It’s NOT going to trigger a trade war…. Don’t believe that Wall Street Fear mongering … China needs the USA consumer and commercial markets 100 times more than we need there markets! The same goes for South Korea! In fact we can’t sell into their markets without painful tariffs if at all.
They should be punished for dumping steel and aluminum here! A 25% tariff on Steal and a 10% tariff on Aluminum isn’t going to hurt them.
If they reduce their tariffs we at some point will go back to zero tariffs.
This is the Globalist’s agenda getting poked and they are squirming and squaking… FK the Globalist’s and their No Borders Agenda!!!!!!
The USA needs a very strong and vibrant Steel and Aluminum industry! It’s a National Security issue as well and a middle class Jobs Issue.
Hey All:
/GC and /SI ……………… Look at both those daily chart long lower wick Hammer Candle Stick Patterns on both Gold and Silver Today!
AG to 100 Week MA s-t along with new waves higher starting for Gold and Silver!
Buying AG under $6 and holding LT for 3 months to 1 year+ is a steal based on my fundamental analysis of all that was released last night. YE 2017 Audited Annual Report + Management Discussion and Analysis + events that occurred Jan & Feb 2018. This is a Strong Buy for 2018 and 2019 EPS Profits and investment Profits. As technical and EW is concerned I think a cycle wave 3 up viewing a weekly chart is about to start here in March 2018.
UUP printing bearish engulfing candle, looks like interim bottom in PMs.
I agree with doing away with free rides and making it a level playing field. Good for US economy, Good economic growth and jobs
China is not even a top 10 when it comes to steel coming into the US.
https://www.cnbc.com/2018/03/01/canada-brazil–but-not-china–will-be-hit-hardest-by-trumps-steel-tariffs.html
https://www.trade.gov/steel/countries/pdfs/imports-us.pdf
It’s not the % of imported steel and aluminum, it’s the price that the steel is being dumped at!
Any country heavily subsidizing steel and aluminum + dumping into the US markets are who will be tariffed. I am sure the production cost and price of steel from Canada is very similar to cost & price produced in the USA. That is probably a true statement for Brazil as well.
Bilateral Trade agreements worked out and signed with each of these countries can solve any trade issues between the USA and any specific country. The free ride is over and stealing American Jobs is over! Fair and Reciprocal Trade is now USA Policy. We owe that to the American Workers and other USA Industries.
Compete on a fair playing field!
Yep. China is very worried. The last thing they can afford right now is pressure on their export revenue…
Lot of FAANG are still showing no sign of selling…compared to what the overall market is showing…some disconnect and until that is resolved, we are not anywhere near a bottom.
Wow, 10 year yields really took a turn down. They’re now sitting substantially below where they were before the Feb 5 selloff. Also interesting to see that RUT is almost green on a day like this. Wow. Very little is making sense anymore.
Short term hourly chart updated:
Minor wave C or Y would most likely be a three down. Starting with a zigzag. Which may be all of minor C if intermediate (4) is a triangle, and may be minute a of a flat for minor Y.
So I’ll be expecting a zigzag down now to continue. So within it there should be a good bounce for wave B. But today so far wave A is incomplete, labelled minute wave a on the hourly chart.
I think I’m going to have to separate the two ideas (triangle vs combination) into separate charts for clarity.
Hi Lara, I thought C waves are normally composed of 5 waves not three?
Normally they are. But here I’m expecting it is within a triangle, so most likely will be a zigzag.
I’ll be making it clearer with updated charts today.
Yep. Starting to look like a triangle indeed!
I want to see a sharp move down out of this sideways price action with a nice hammer or at the very least a long lower wick.
I have to say I agree that there is not that much fear visible considering what could be just ahead….
What constitutes fear? VIX > 30? VIX > 100? Remember that even during the 2008 financial crisis we had days with VIX < 40…
This is a tough call. I expect we dive into the close, but do we get a reversal overnight or complete carnage??!
I will be mostly in cash with a small straddle into the close.
If volume shows an increase then I’d expect another red candlestick tomorrow. I would expect this fall to continue until:
1. The structure of minute a down as an impulse is complete.
2. A long lower wick on a daily candlestick.
3. Maybe a bullish signal from VIX or the AD line shows up.
I concur!! But better to hear it from the expert! 🙂
short term buy triggers on this 50% fibo bounce…tomorrow could be a significant up day if that fibo holds.
Anybody have a target for the 4 ?
Look at Lara’s main weekly chart… the right side levels… I think we are about there.
Yep. Looks like one more low needed….
I think we get the low into the close and either a reversal overnight, or all hell breaks loose tomorrow…
“A reasonable range for it to end would be about 0.8 to 0.85 the length of minor wave B at 2,584 to 2,571.”
No, price isn’t there yet. A fair ways to go still. Probably not today. Probably……..
Now I am going to have to invest a whole new batch of hours figuring out how UVXY trades now that they have absolutely screwed it up. This really sucks!
Vere, due to the XIV blow-up and the SVXY crash… Pro-shares is worried about the SEC and Class Action LS’s.
When I watched closely it didn’t always match exactly.
I think supply and demand has an effect on the shares and the trading of it. I think many have stayed away. I think in time they will come back to play. Then it may track better.
Hopefully. Over the years I got to know it reasonably well and made some really spectacular trades on it. It is now trading completely differently than it used to.
Ramps over the last few weeks were sold into by smart money and mom crowd got happy with short recovery. I suspect this time when the selling really picks up, there is a good possibility that we overshot the support level. Now, I am convinced that the long term bull market ended on Jan 27 2018.
As Bo and Lara have pointed out…possible, but would be the first time ever that such has happened without indicators that didn’t show up.
Looks like we are very near Lara’s target for the start of wave 3 up on the main count weekly chart.
Looking into how I should be positioning for this.
Not entering just yet… but I want to have all my ducks in a row.
There are an awful lot of false signals being thrown off by the market right not. This is a really dicey situation and feels like things are on a knife’s edge of chaos….yikes!
3 black crows developing on the daily. This is baaaaaaad for the bulls. I didn’t think we’d revisit the lows but now it seems almost inevitable. The close here will be critical.
From a macro perspective this is probably a good thing. We’re seeing risk-off behavior in the face of a steamroller economy. The effect of these rate hikes and asset devaluations will take a while to ripple down to lower levels of the economy, and I expect the Fed will have second thoughts about that 3rd hike come September. Might see a replay of 2015-2016. Meanwhile, the tax bill will provide plenty of relief.
My question to the structural bearish individuals out there is: what macro event do you think is going to trigger a complete and total economic collapse? This is not 1929 nor is it 2008. There is much greater scrutiny around the big banks and I am curious as to what entity the bears expect too default a la Lehman Brother’s. The thing that turned the 1929 aftermath into the Great Depression was the complete collapse of the banking system and widespread deflation. This was accelerated by the archaic book keeping mechanisms of the day. In the days of mailed checks and no computers, a bank could easily close Friday and be bankrupt by Monday. And the majority of banks were not guaranteed by the Fed. Obviously in 2008 we saw Lehman manage to slip through the cracks and default anyway, but it took a 50:1 leverage ratio and a lot of bad luck and mismanagement from the Fed.
What entity today is the Lehman of tomorrow? Maybe my understanding of this is too limited for me to see the big picture, but I feel like if you are predicting the greatest economic collapse in the history of human civilization, I feel like you don’t really get the benefit of the doubt. Again, if anyone has resources or info that help explain why/when the world financial system is about to collapse, am all ears (bolives1969@gmail.com).
Also a 3 white soldiers pattern developing for UVXY. Will we see VIX break its all time high in the next 2 months?
3 white soldiers pattern was a DUD the last time that occurred on VIX. Not sure you were here then.
I was. I wouldn’t call it a dud. It didn’t signal an imminent spike but the fact that we saw the biggest explosion in VIX history just a month and a half after is notable imo.
A month and a Half After caused me to miss the entire thing. Because the one time I didn’t put a position on since November it took off. I also missed the big market decline as well, the one time in 2 years I didn’t position short when I felt I should. I missed all around.
Now I am back in AG as of this morning on a 3 month to 1 year+ LT trade and I am looking for the end of Lara’s (4) to play wave 5 up.
Not really. It was EARLY, but definitely flagged the impending end of the short vol trade. My long term long vol trades performed spectacularly and I wish I had put in more and held them longer! 🙂
My knee jerk thought: maybe not a financial collapse issue to start, but rather a more global/social issue: WWW III. The korean peninsula situation could ignite it. Even a limited war in that area could be devastating to the markets. And more than just a few nukes can be devastating to the planet’s ecology.
There won’t be WWIII.
NK’s program may be taken out at some point though. Nobody will come to their aid… so no LT war.
Let’s hope that guy abolishes his nuke program on his own.
I agree a real, legitimate WWIII would do it, but that’s not a scenario I want to think about much lol. Won’t be caring very much about what’s in my bank account if that happens.
I am not seeing the panic yet in the markets
I agree. They are all confident the nanny FED is going to bail everybody out…again!!
In the face of the best economic conditions in world history the markets are down over 7%. I’m curious what level you would like to see before it constitutes “panic”. Collapses are a feed forward mechanism so more declines beget even more declines. If you are rooting for the world economy to collapse and the SPX to go under 666 I must say I will not be able to join you.
“but if you talk destruction yeaaa….don’t you know that you can COUNT ME OUT!!!” – Lennon/McCartny
That is not ready to occur yet, I don’t think… I think Lara has the right count of all of them. Even the “old man” in his last IR is hedging of his big end. That tells me based on my experience following his work that he may delay his end call soon to a point in the future. We shall see… he hasn’t changed up yet.
Best economy in world history??
I suggest you take another look at the global debt that has created that laughable illusion…
VIX making a lower high so an interim bottom coming up it would seem… 🙂
O.K. I got hold of Pro-Shares and screamed at them of being the dirty rotten low down lying SOBs and they reminded me that the funds re-balance at the END of the trading day. That is total B.S.. I have traded this beast for years and it ALWAYS tracked the price action of VIX DURING the cash session. Nice try! 🙂
I just bought back into AG. To me… I think it put in a double bottom on daily chart this morning. Full Year 2018 production, Cash Flow and 2nd half 2018 or sooner return to profitability.
All set to take full advantage for Silver’s new Long-term uptrend! A major player in Silver when the Primero transaction closes this month. I believe the new wave up… which I believe will be a Cycle 3 may start any day this month on the weekly chart. To be the most leveraged stock to Silver’s new up cycle.
BTW: My new position in this is for 3 Months to 1 Year or more. No STOPS from this level on AG.
Maybe I will add stops as it approaches & passes through the 100 Week MA.
That’s probably a very good call. Not to mention the gold/silver ratio at about 80; that’s been a good signal in the past that a reversal is in the works
I like to play Silver directly but I don’t like any of the available vehicles.
To me the very best way to play it is through AG.
I know all of you play technicals only… but you should read the just released management and discussion analysis on AG + annual report… you can get to them on sedar dot com then search data base then company then enter First Majestic Silver. I read through all last night & this morning. + add in Jan & Feb events… Solid… Solid balance sheet!
They have made the investments in 2017 to ramp up production and improve grade and with this Primero purchase and using more innovative technologies… they are going to be very profitable going forward.
+++ Fully leveraged to the price of Silver!
Thanks for the info joseph. I follow gold/silver and have my eyes on about a dozen companies. AG is on the list. It has performed terribly over the past 18 months, but your analysis is solid. Today’s action was very positive and bullish. Thanks for the info and good luck
The lying S.O.Bs at Pro-Shares continue to rip off traders. I am giving the SEC a call over this crap…no way UVXY is trading at 1.5X. What the hell are they thinking…that no one would notice???!!
If the market cannot manage a relief bounce of any kind after this sizeable a decline, the bottom could really drop out from under this baby…
Looks like we’re not quite done with this fourth wave triangle….stand by… 🙂
Until the buy the dip folks don’t get punish, this market is not going to be safe…both AMZN and AAPL now dropping so little to support S&P for now. IWM is being held back but that is fine as it too will drop like rock soon..
They are probably starting to get a bit slack-jawed by now I imagine…lol! 🙂
New low. Time for a bounce! 🙂
How high?
You mean, bounce down lower, right? And did anyone look at the Feb 5 action? This is tracking exactly.
Fibo’s below: 2685.5 (on it now), 2656.4, 2627.3, 2591.2, then all the way to 2533.
If it continues tracking to the Feb 5 pattern, the fireworks to the down side haven’t even begun yet.
Great call on the Feb 5 repeat Kevin!
Sorry, my chart data from IB is WRONG from 2 days ago: shows a high of 2780 for SPX, when in fact the high was 2789. They “corrected” this error about two hours into the session that day by adjusting a 5 minute bar in real-time (and freaking me out), but the early morning data that day stays wrong here two days later. And keeps messing with me. So all those fibo #’s are all a little too low. As you probably all see yourselves.
Price hanging onto shelf underside by the fingernails….Ouch!!
I think the right analogy for this market is a very sloppy drunk staggering home, but in fact quite lost.
We are in a fourth wave. We make a new low today and then get a nice bounce. How high depends on what degree we are at.
LOL
Sounds legit.
Ongoing battle around round numbers DJI 25K and SPX 2.7K. Price now testing underside of that shelf after morning break…
Wow, algos are really have fun with Powell’s testimony.
Took my UUP profit right here. Looks a bit like a 5 wave up might be in the complete zone, and price is close to a 1.27% extension, and perhaps this is a major cusp point in the the markets generally. So kaching for now. Next!!??
Possible analogous price action to current: look at hourly chart of SPX, Feb 5 morning. Down (gap in that case), a significant head fake up, then kablooie!! Obviously the current lows are more than a little significant here.
ProShares ripped off a lot of traders long SVXY and UVXY when they changed the rules in the middle of the game. It is absolutely incredible that these cretins were permitted to literally steal 100 million in premium from option traders. The smart ones will know exactly what to do…. 🙂
Finding support at 50% fibo of overall 11% downmove. So far….
Look at DAX…a probable roadmap…. 😉
Perhaps, but I want to see the battle right here on this 50% and 100% fibo get resolve first. I’m suspicious it holds today. I’ve cashed short and gone long, and cashed long and…am waiting to see what’s next.
VIX up. Futures up…somebody’s a’lyin’….I wonder who?! 🙂
This could still be what is now the Alternate count
Interesting to see them try to gap this down tomorrow morning in the face of green China. I’m not quite convinced with the new daily.
All depends on what the algos make of Powell’s testimony I guess.
To my mind Lara absolutely made the right call switching to the bearish model as the main. It’s the more likely scenario now. But it’s not certain by any means. My hourly short system got me in on the smaller side late yesterday, and I doubled very quickly this morning.
Mind if I ask what exactly your hourly short system is?
Yes, but I’ve concluded the long term trend now is no longer up, and I’ll be making adjustments. During a secular bull, wherein I’m taking daily and weekly and hourly timeframe longs, the idea of the hourly short is an “insurance policy” to reduce losses at the higher timeframes when there’s a significant correction. That all said, it merely calls for a short when the hourly 8 ema drops below the 34 ema, and then trail stops above the hourly bars. Did I use it today? Not quite, I took my short profit the moment I saw price hesitating/turning at the obvious fibo’s, because of the huge potential for a turn decision there, and because I have no higher timeframe longs to protect. Right this time.
“The first in a series of three fourth wave corrections for subminuette wave iv may not move into subminuette wave i price territory above 2,538.02.”
Perhaps 2738.02? 🙂
Yes, indeed. Thank you very much for pointing that out. Fixed now.
🙂
Lara,
I am seeing the next leg down to possibly hit 2514-2515 level bit below the previous 200 MA. Does that equate to fib projections?
Yipee!
Got to catch the wabbit…
Hey can Eye drop in too??!!!!
Party wave?
Everyone welcome!