Some downwards movement has begun the new trading week exactly as expected from last Elliott wave and technical analysis.
Summary: The larger trend is up. The next target is at 3,020.
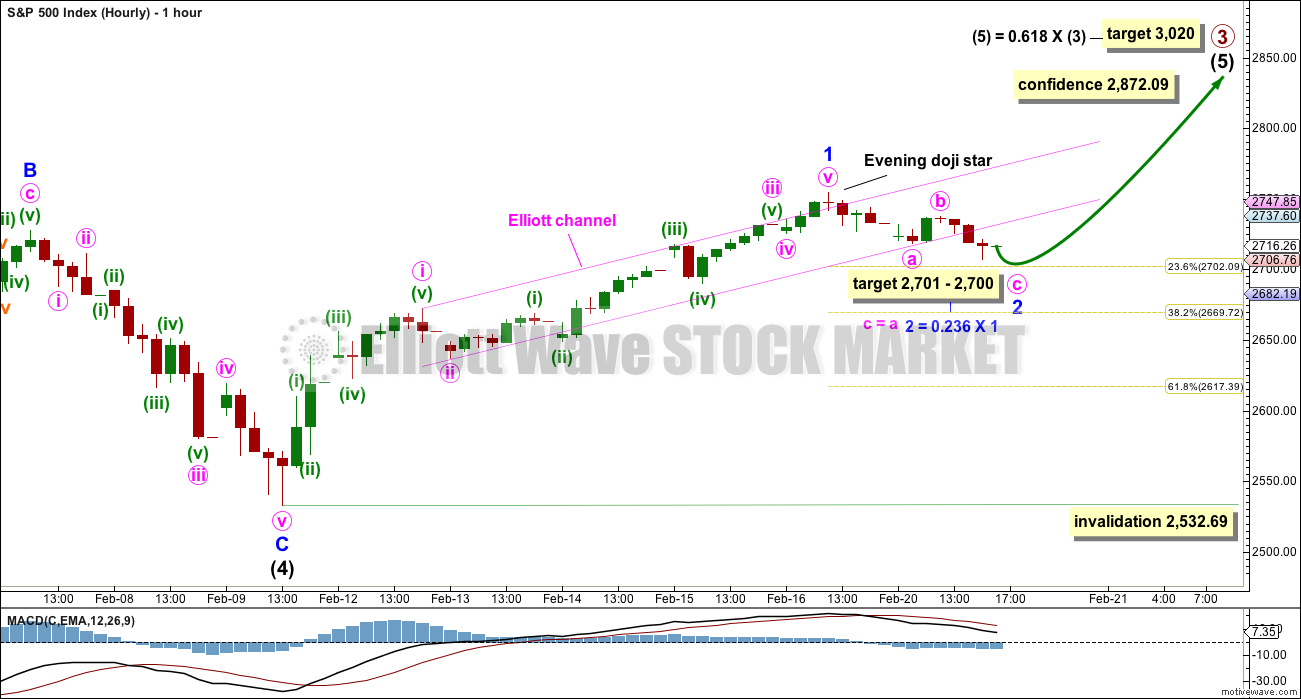
Downwards movement should continue tomorrow. This has support today from a bearish signal from the AD line. The first target is at 2,701 – 2,700. If price keeps falling through this first target, then use 2,670 and the last target 2,617.
Thereafter, the upwards trend should resume.
Always practice good risk management. Always trade with stops and invest only 1-5% of equity on any one trade.
The biggest picture, Grand Super Cycle analysis, is here.
Last historic analysis with monthly charts is here. Video is here.
An alternate idea at the monthly chart level is given here at the end of this analysis.
An historic example of a cycle degree fifth wave is given at the end of the analysis here.
MAIN ELLIOTT WAVE COUNT
WEEKLY CHART
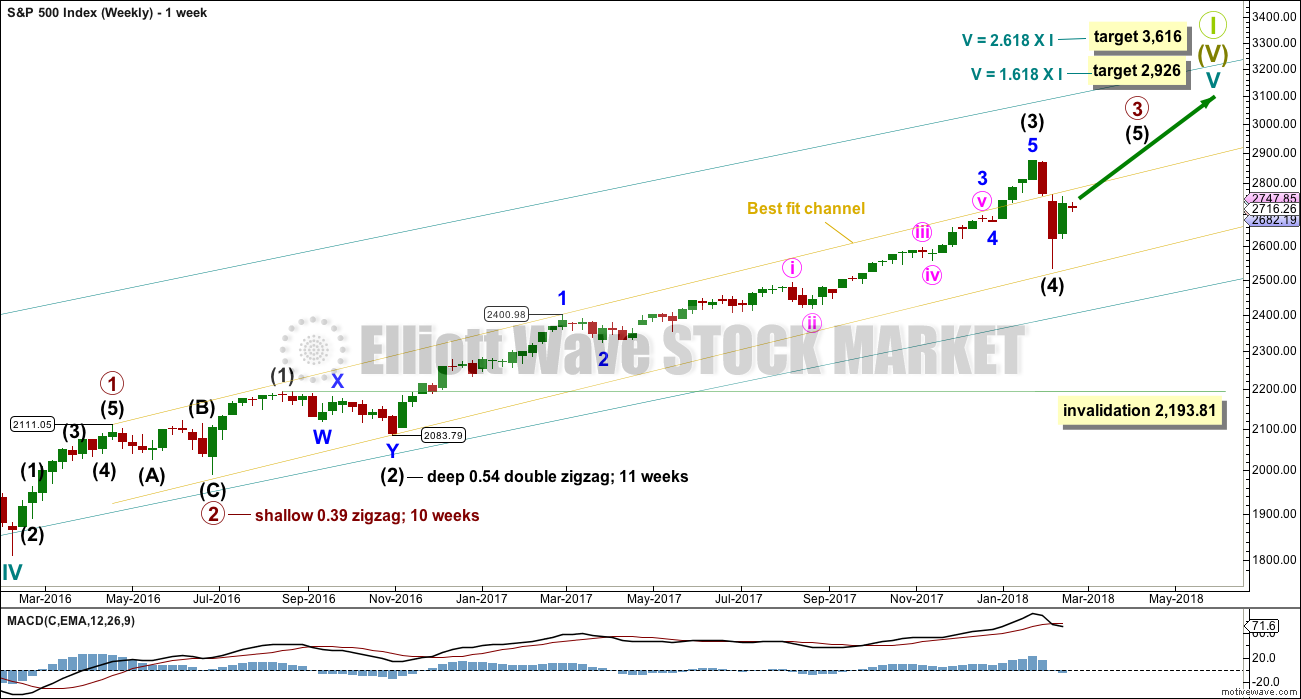
Cycle wave V must complete as a five structure, which should look clear at the weekly chart level. It may only be an impulse or ending diagonal. At this stage, it is clear it is an impulse.
Within cycle wave V, the third waves at all degrees may only subdivide as impulses.
Due to its size intermediate wave (4) looks proportional to intermediate wave (2), even though their durations so far are quite different.
Intermediate wave (4) has breached the Elliott channel drawn using Elliott’s first technique. The channel may be redrawn when it is confirmed as complete using Elliott’s second technique. A best fit channel is used while it may still be incomplete to show where it may find support. Price points are given for this channel, so that members may replicate it on a semi-log scale.
Intermediate wave (4) may not move into intermediate wave (1) price territory below 2,193.81.
DAILY CHART
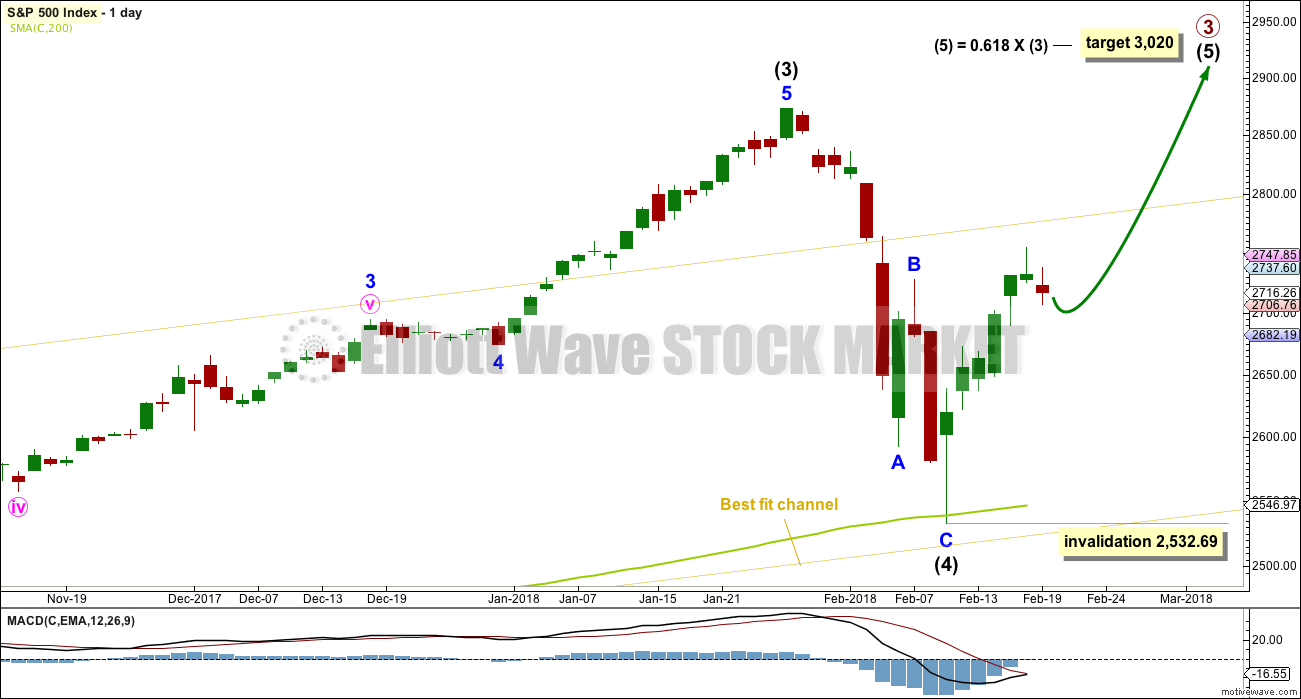
The S&P has behaved like a commodity to end intermediate wave (3): a relatively strong fifth wave with a steep slope. The high looks a little like a blow off top. This is followed by a sharp decline, which is typical behaviour for a commodity and not common for the S&P.
The very long lower wick on the candlestick at the end of intermediate wave (4) is strongly bullish. It looks like intermediate wave (4) may have ended there.
Despite the duration of intermediate wave (4) being much quicker than intermediate wave (2), the size is proportional. On weekly and monthly time frames intermediate wave (4) now has the right look.
The downwards wave labelled intermediate wave (4) may be seen as either a three wave zigzag, as labelled on this daily chart, or it may be seen as a five wave impulse. Both possibilities must be considered. The main hourly and alternate hourly charts consider it as a zigzag. The second alternate hourly chart considers it may have been a five.
HOURLY CHART
A new all time high would add confidence to this wave count (even though an alternate idea published would remain valid).
Minor wave 2 has breached the Elliott channel about minor wave 1, indicating that minor wave 1 is over and minor wave 2 may have begun.
It is possible that minor wave 2 may be a relatively brief and shallow correction. This has been a feature of this bull market up until the arrival of intermediate wave (4). It may again be a feature of this market during intermediate wave (5). The target expects this.
If price keeps falling through the target, then the 0.382 and 0.618 Fibonacci ratios would be the next targets for minor wave 2 to end.
Minor wave 2 may not move beyond the start of minor wave 1 below 2,532.69.
ALTERNATE DAILY CHART
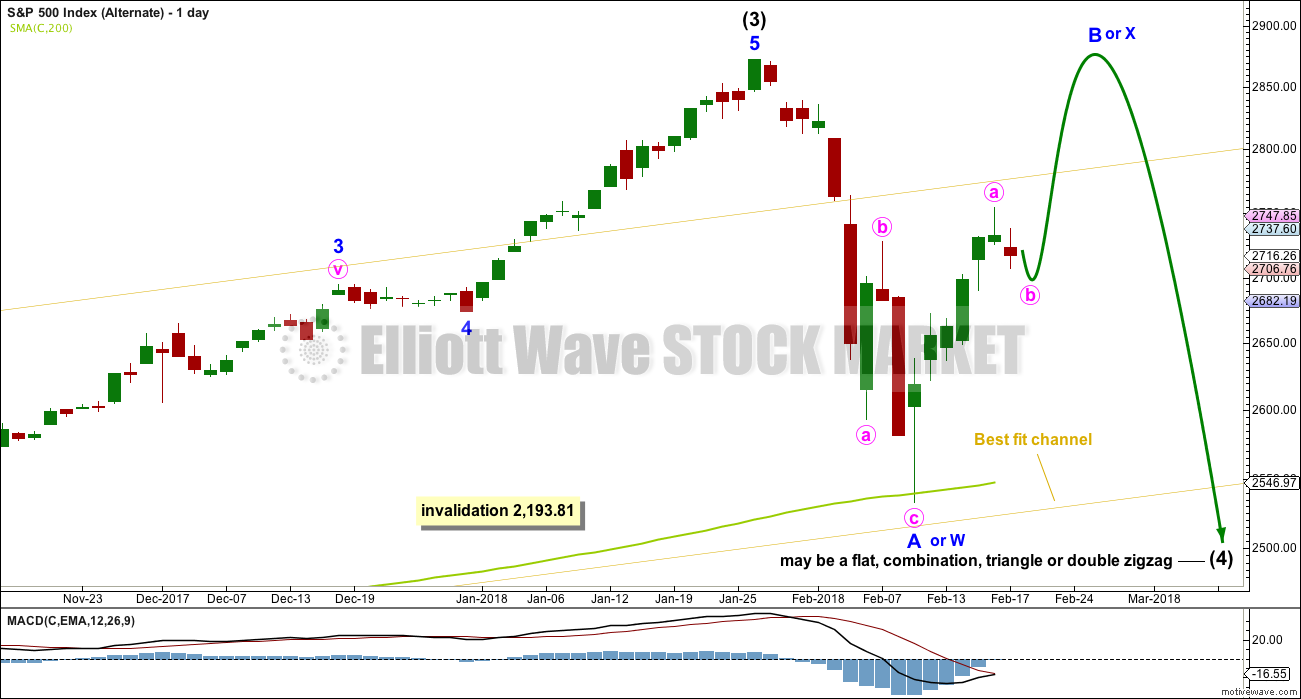
This wave count is identical to the main daily chart, with the exception of the degree of labelling within intermediate wave (4). If the degree is moved down one, then only minor wave A may be complete within a continuing correction for intermediate wave (4).
If it continues further, and if analysis of minor wave A as a zigzag is correct, then intermediate wave (4) may be a flat, combination, triangle or double zigzag. Of all of these possibilities a double zigzag is the least likely because that was the structure of intermediate wave (2). Intermediate wave (4) should be assumed to exhibit alternation until proven otherwise.
If upwards movement continues further, then the idea of a double zigzag may be discarded. Double zigzags normally have a strong slope against the prior trend, and to achieve a strong slope their X waves are usually shallow.
All of a flat, combination or triangle would have a very deep minor wave B. An expanded flat, running triangle or combination may have minor wave B or X make a new all time high. Unfortunately, for this reason there is no upper price point which differentiates this alternate idea from the main wave count.
Minor wave B or X should be expected to exhibit weakness. Light and declining volume and divergence with oscillators at its end are features of B waves, and also of X waves which are analogous.
Minor wave B or X may be any one of more than 23 possible corrective structures, but it would most likely be a zigzag. It looks like it may be subdividing as a zigzag at this stage.
This alternate wave count would expect a strong breach of the 200 day SMA, which would be unlikely. The first expectation should be for price to find strong support there.
ALTERNATE HOURLY CHART
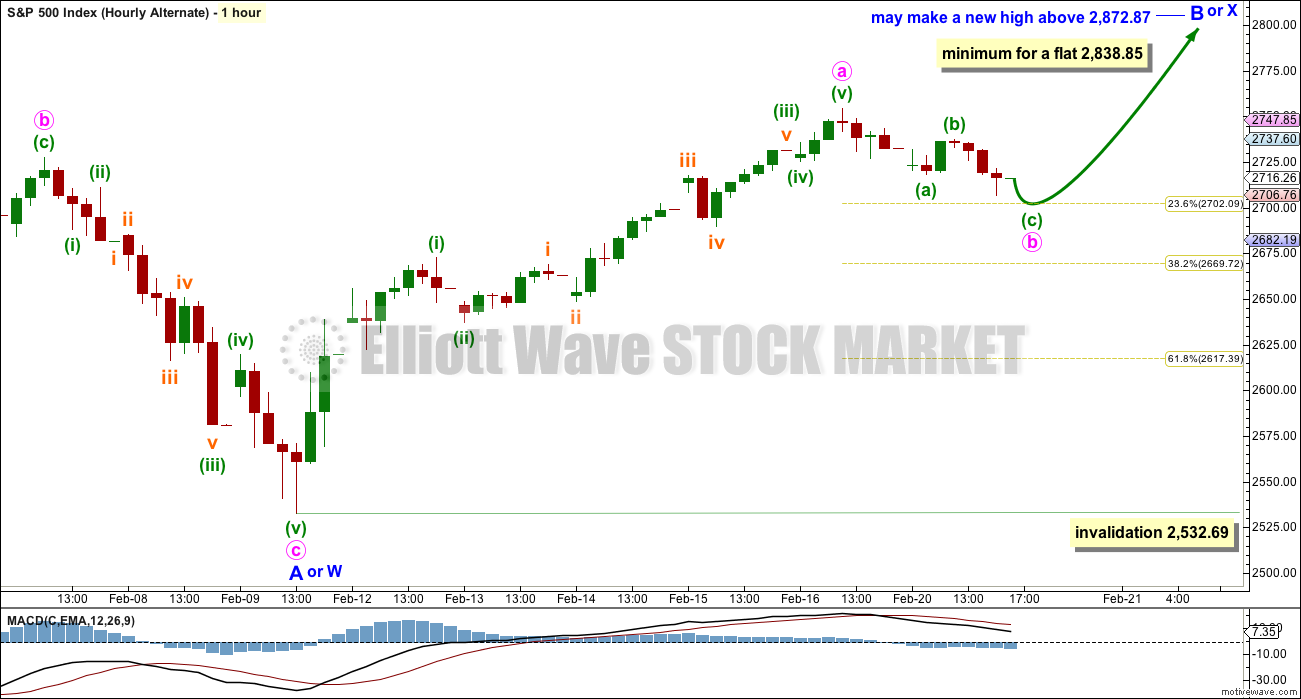
Upwards movement off the low may be an incomplete zigzag for minor wave B. Zigzags subdivide 5-3-5, exactly the same as the start of an impulse.
If intermediate wave (4) is a flat correction, then within it minor wave B must retrace a minimum 0.9 length of minor wave A.
If intermediate wave (4) is a triangle, there is no minimum requirement for minor wave B. It only needs to subdivide as a three wave structure.
If intermediate wave (4) is a combination, then the first structure may be a zigzag for minor wave W. Minor wave X may be any corrective structure and it may make a new high above the start of minor wave W. There is no minimum requirement for minor wave X of a combination, but it would very likely be fairly deep.
Minor wave B or X may be unfolding as a zigzag. So far, within minor wave B or X, minute wave a may be a complete five wave impulse. Minute wave b may correct to either the 0.618 or 0.382 Fibonacci ratios. Minute wave b may not move beyond the start of minute wave a below 2,532.69.
SECOND ALTERNATE HOURLY CHART
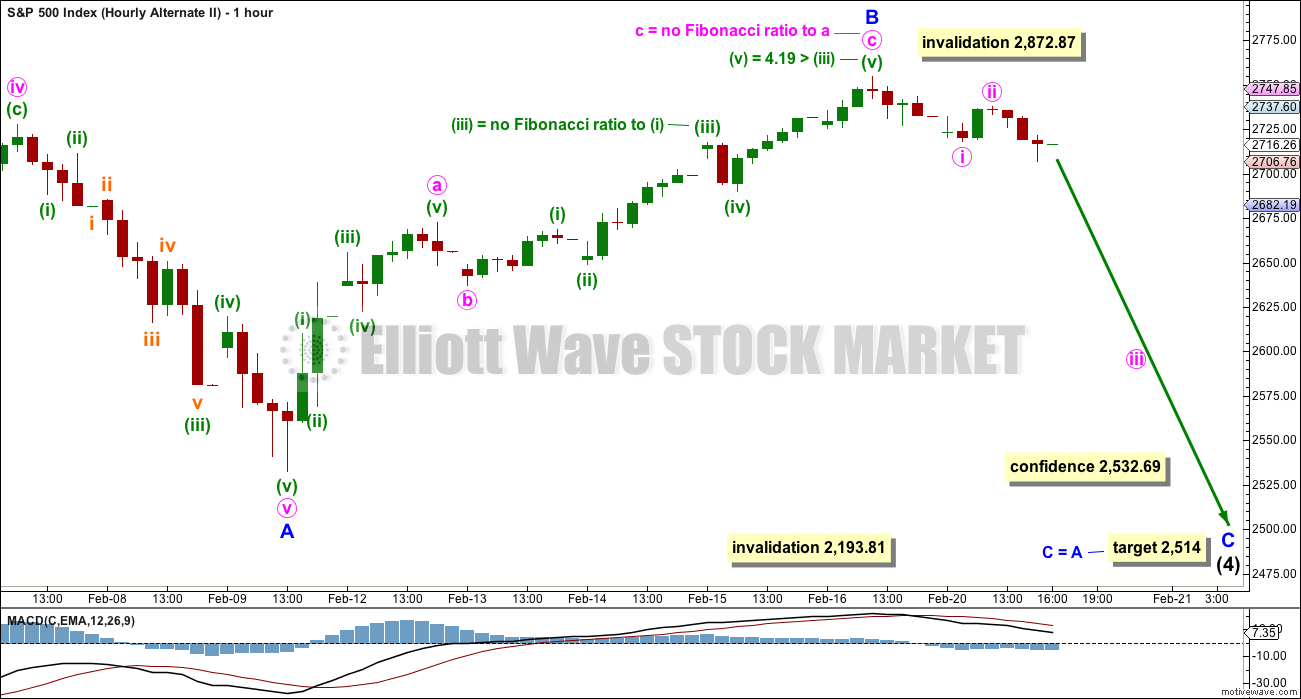
It is also possible to see the last downwards wave as a five wave impulse. Intermediate wave (4) may be continuing lower as a single zigzag, subdividing 5-3-5.
Within a zigzag, minor wave B may not make a new high above the start of minor wave A at 2,872.87.
Minor wave B may be now complete ending close to the 0.618 Fibonacci ratio of minor wave A.
Minor wave C may now be underway. However, this wave count would expect a strong breach of the 200 day SMA, which looks unlikely. The first expectation should be for price to find strong support there.
TECHNICAL ANALYSIS
WEEKLY CHART
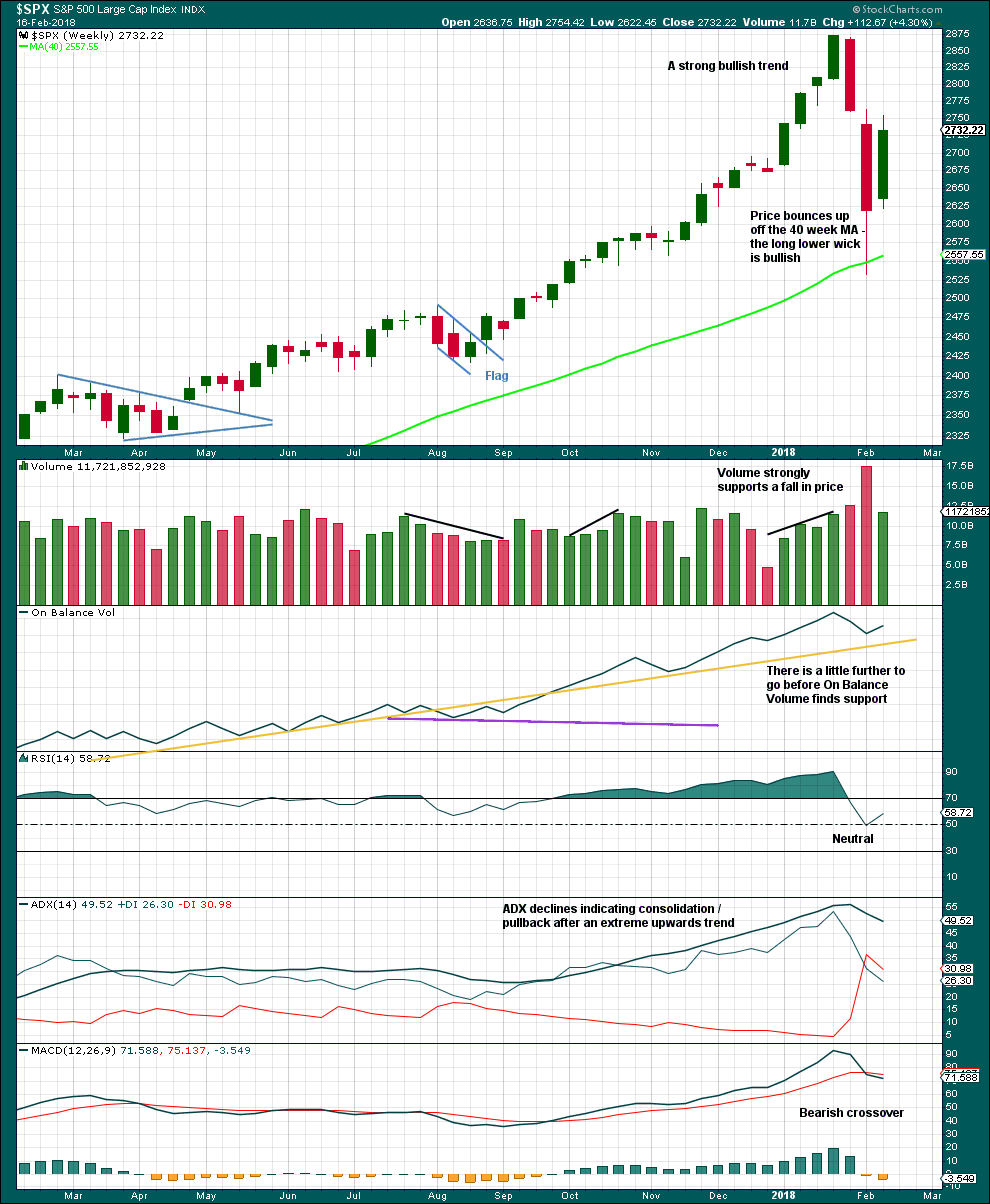
Click chart to enlarge. Chart courtesy of StockCharts.com.
Volume this week is much lower than the last downwards week, which is bearish, but it is stronger than the previous four upwards weeks, which is bullish.
There is nothing bearish about this weekly candlestick.
The pullback has brought ADX down from very extreme. A possible trend change to down is indicated, but as yet no new trend is indicated.
DAILY CHART
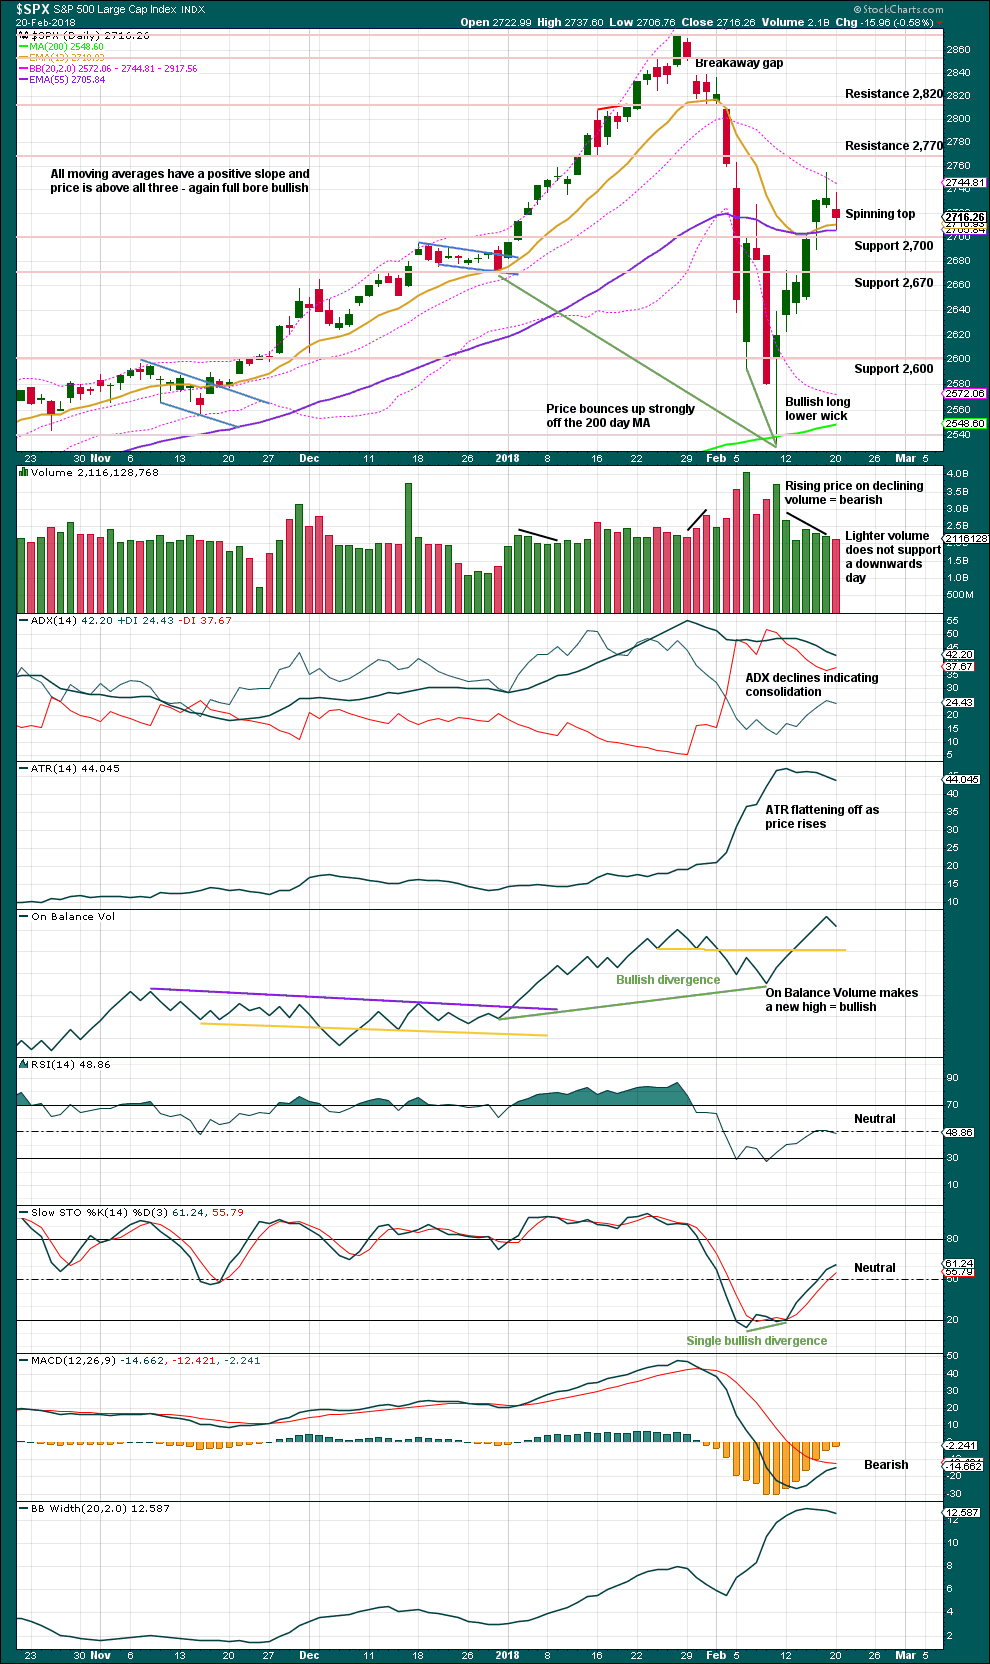
Click chart to enlarge. Chart courtesy of StockCharts.com.
The long upper wick on Friday’s candlestick was bearish. This is now followed by a spinning top that puts the trend into neutral. This looks like a small pause within an upwards trend. There is a little bit of strength today in downwards movement.
On Balance Volume remains very bullish.
VOLATILITY – INVERTED VIX CHART
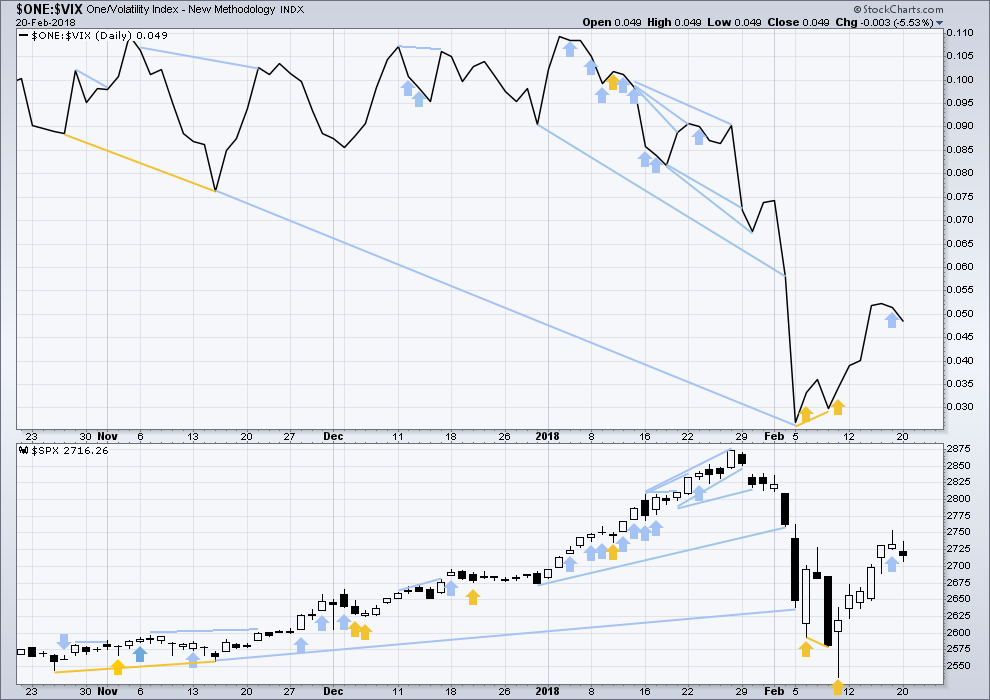
Click chart to enlarge. Chart courtesy of StockCharts.com.
So that colour blind members are included, bearish signals will be noted with blue and bullish signals with yellow.
Normally, volatility should decline as price moves higher and increase as price moves lower. This means that normally inverted VIX should move in the same direction as price.
Short term bearish divergence noted in last analysis has now been followed by a downwards day. It may be resolved here, or it may require another downwards day to resolve it.
There is no new divergence today. The downwards movement in price came with a normal corresponding increase in market volatility.
BREADTH – AD LINE
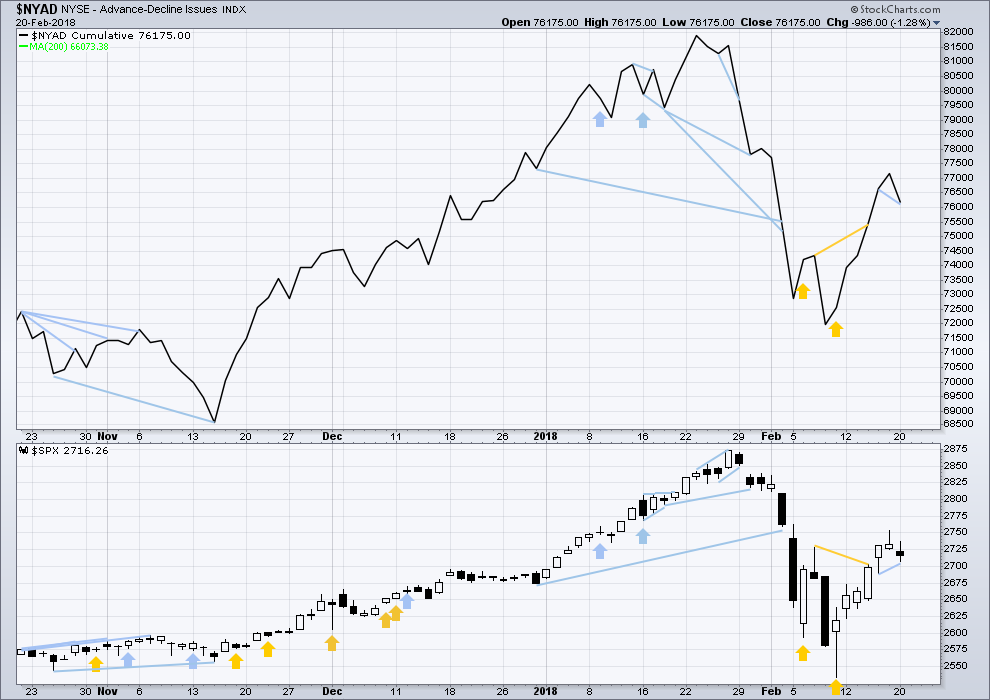
Click chart to enlarge. Chart courtesy of StockCharts.com.
There is normally 4-6 months divergence between price and market breadth prior to a full fledged bear market. This has been so for all major bear markets within the last 90 odd years. With no longer term divergence yet at this point, any decline in price should be expected to be a pullback within an ongoing bull market and not necessarily the start of a bear market.
All of small, mid and large caps last week moved higher. The bounce has support from wide breadth. They all also have long upper wicks on their daily candlesticks for Friday.
Breadth should be read as a leading indicator.
There is short term bearish divergence between price and the AD line today: the AD line has made a new low below the low two sessions prior, but price has not. This decline in breadth should be read as a leading indicator. Price may follow.
DOW THEORY
All indices have made new all time highs as recently as four weeks ago, confirming the ongoing bull market.
The following lows need to be exceeded for Dow Theory to confirm the end of the bull market and a change to a bear market:
DJIA: 17,883.56.
DJT: 7,029.41.
S&P500: 2,083.79.
Nasdaq: 5,034.41.
Charts showing each prior major swing low used for Dow Theory are here.
Published @ 9:41 p.m. EST.

2670 and 2620 are the relevant targets for a bounce tomorrow and Friday if we head down.
Okay so the way I see it, we are either about to start minor 3 up for a HUGE upwards move, or start minor C down for a HUGE downwards move. This being the case, I think the most likely thing is we’ll get sideways action and no move at all, lol.
Absolutely classic head fake to finish off the run up today. NOW this is starting to look and feel a little bit more like a minor 2 down. And it could drop another 170 points and still “just” be a minor 2. Or it could be the C down launching and it’ll stop at 2200 or so. Hmmm. Well, watch out below!!!
Kevin, my target if it is the “C” is 2260-2270, but I also believe the 2417 pivot will provide substantial support.
I am looking in wonder at the fact that VIX closed RED today.
Don’t think I have ever seen anything quite like it.
There are clearly some very confused traders out there…or is it just me?
Of course the final thrust out of the smaller triangle (noted by Kevin) probably took quite a few by surprise with its huge reversal, which could have easily been missed if you were not keeping the bigger pattern in mind. Wow!
You actually were right Kevin about the smaller triangle that was unfolding with that final thrust up out of it, but since it was part of a larger pattern there was a very good chance that we would see a sharp reversal after the thrust. A nimble trader could actually have traded the smaller coil; I preferred the bigger one! 🙂
Good morning everybody!
Before I go through comments below this morning, here’s your updated main hourly chart.
I’m going to label this sideways movement still an incomplete minor wave 2. The target is the same.
Minute b fits very nicely as a flat correction.
Minute a fits as a leading diagonal, a five. So minor 2 may be a zigzag.
If my target is wrong it may not be low enough. Next targets still the 0.382 and 0.618 Fibonacci ratios.
The perfect touch of the underside of the pink Elliott channel is very satisfying analytically. Because that trend line looks to be currently providing resistance I’ll keep it on the chart. It may be useful again.
And also entirely valid:
A new high above 2,748.25 would see this the main wave count and the first idea published in comments today above discarded.
And so the key is the structure of what I have labelled minute c down on the second chart.
Is it a five or is it a three?
Long term members will know that this is the crux of the difficulty with Elliott wave. It is very often impossible to tell with certainty if a wave has subdivided as a three wave zigzag or a five wave impulse. They look the same. How many of the small subdivisions do you count? It makes a difference.
So when I look at this wave on the five minute chart it looks best I think as a five. Which means the second chart would be right. If my five minute analysis is right.
This is what I see on the 5 min chart:
And so… this?
This fits what I see on the 5 min chart.
I think this may be the one this morning.
And that’s my train of thought so far today. Over and out.
Thanks Lara. I was of a similar mind for Minor 2. But my lower degree count was different. That’s why I appreciate your analysis so very much. You teach well. Thanks.
You’re most welcome as always Rodney
All eyes on that invalidation at 2706.73…..uh oh….bye bye!!!
A common mistake we often make as traders is getting distracted by intra-day market noise. The banksters will drive you batty if you make only that your focus. While I know some of you don’t think that markets can be manipulated, at least intra-day, that happens to be my own view as I see it all the time. What is much harder, if not impossible, is to manipulate certain moving averages as they develop over many trading sessions, and are not subject to intra-day shenanigans. They give you more reliable information not susceptible to intra-day B.S.
O.K. No more freebies! 🙂
You’re hired Verne!! 🙂
Funny. Last week a friend of a friend, the latter being an international business attorney wanted to meet with me when he heard I used to trade with Bryan Bottarelli. A very interesting conversation. This guy knew Martin Armstrong quite well and all about the ker-fluffle over his trading code.
Whipsaws like today is why I love spread trades. I started with a very narrow 0.5 point spread which allows me to simply widen the spread when price moves against me and cash in profits on the long side while continuing to limit upside risk by buying higher strike calls. If and when I am proven wrong, I can simply add to my long calls and ride the move up…what’s not to like? 🙂
This is so awesome!!!!! Algos vs. Banksters, at least we can say Vol. is back, Enjoy everyone!
Pretty sure the “algos” and the “banksters” are one and the same, no?
Without going into huge detail, algos can be driven, or lead buy cash injections into the spot and futures markets on the indexes. Near term evidence of this can be seen in Q4 futures after market ATR, and VOL and reversal signals being constantly “reversed.” The past few weeks many of the very large independent HFTs and Hedge Funds have adjusted settings from buy the dips to sell the rips, which is how the banksters were overrun today. I can’t describe the tectonic shift that is in the process of occurring. Without corporate buybacks last week, the market would have likely fallen further.
POP was on Fed Min Release.
It is a well-know rule that you always want to trade against the initial “FED-announcement- driven” market move…
The 30-minute move post-Fed is always a head-fake. Almost always goes back to where it was before the announcement, then resumes as normal.
So many Freebies Verne, geez. Everyone should buy him a beer…..
Well Chris you know what Rodney Dangerfield said doncha?
“Can’t get NO RESPECT!” 🙂 🙂 🙂
We all do get well taken care of by Lara though and that’s good ’nuff for me!
One day when I can travel (when my son has finished school) then I’d like to visit you and I’ll buy you a beer. Or two.
🙂 🙂 🙂 🙂
As I said, SPX was squeezing on the hourly!
Finally, I’ve got an hourly bar with an uptrend signal again!
Why the pop? I’m lost, I thought we are looking for C down?
FWIW Lara’s main count calls for a Minor 3 up, with the C wave for the move down being already completed. It’s the alternate that calls for a C down.
Verne I do believe that’s a C-O-I-L that’s formed in SPX. Entered from below. Should this not be exited to the upside here? How does that jibe with your bearish outlook?
On the 15 minute, the larger coil still shows a down-trend origin. If we close above the 50 day by much and permanently fill the gap I will have to reconsider. For now, I am widening my bear call spread to 1.5 points by selling my SPY 275 calls and buying the 275.50 ahead of an expected reversal…. 🙂
Nope. No larger coil. A minor 2 (or minute 4, I continue to be suspicious of this little pulback as a minor 2), and now a new impulse up, either a 3 or a 5 of some timeframe. A continuation wave of a bull trend. For now. Maybe a big C down is coming soon. But if so, it’s going to start at a higher price that this. IMO.
O.K. You win! 🙂
Hmmm. How quickly sentiment changes….
A 2? Or…is this the start of an impulsive C down?!!! I’m guessing 2. I often guess wrong.
Oh, no…could Verne be wrong on his bearishness today and this week? Everything I’m seeing is pointing up, agreeing with Lara’s main count. It would be glorious to see new all time highs this month!
As I’ve learned, it doesn’t pay to be a bear. Even if you’re right, the market is somehow levitated higher. Go with the trend!
🙂
SPX is showing a squeeze now on the hourly. It has moved from downtrend to neutral on the hourly, as well. I’d sure like to see the hourly trend move to “up” and the start of sequence of up bars with rising lows…you know, a real uptrend!!! At times like these, it seems it’ll never happen again…
This. Let’s go green!!
Much mo bettah now!! Hourly back to an uptrend. (and interestingly, still in a squeeze). Now I want to see 3, 5, 7, or more in a row all bright green up bars with a higher low every bar. Why not?!! It’s 3 time.
DJI could not even manage a good-bye kiss of the 50 day. All it has to show for its efforts is yet another naked upper wick…or should I say like Eddie Murphy…”NE-KED!” 🙂
.
What you saw this morning was nothing more than the bulls insisting on a re-match over the 50 day dust-up. I guess the first A—Kicking was not sufficiently punitive so they came back for one more…! 😀
Doji on the hour chart…
Naaaaahhh! Ya think??!!! 🙂
People scoff at my jawboning about the banksters but the truth is if you start thinking like them you can make some pretty good trades. I day-traded the dip yesterday and got out as I fully expected a pump today. For a few brief seconds last night DOW futures sported a 1450 points spike! I had never ever seen anything like it. I could be wrong, but I suspect savvy traders are going to fade this ramp as the volume is remarkably muted…(see the word-play there??) 🙂
Nothing has changed about the coiling range…NADA!
ANET, recently trading at 312, is now available for your consideration at 242…on very positive earnings, in fact! No guarantee it’s bottomed out but it’s likely.
There are a two companies that are still trading despite the fact that they are completely insolvent. One is Sears, (SHLD), and the other is General Electric (G.E.).
Very low risk income via bear call credit spreads until they eventually give up the ghost; a remarkable situation really…no charge! 🙂
BTW, for those of you paying attention to volatility, the 21 day had been support for UVXY lately…
Buying VXX March 16 41 strike calls for 4.20. First 25 of 100 full load…
I’m suspicious the move up is over for an hour or two, it’s a typical length in this period for a push up, has a decent 5 wave structure on the 5 minute…and NDX has hit it’s top again. I’d guess there’s an abc 2 here that will take price back to the broken downtrend line and area of 50% fibo, around 2722.
Take a look at the 15 minute chart. Seems clear to moi… 🙂
The VIX move up off the lows will be sharp….
Verne,
Are you playing UVXY long or some other VIX long in anticipation of a ramp higher by VIX?
I am adding to my long vol position every time UVXY moves below 17 in my short term account. I sold most of my position yesterday on the pop over 18 and am reloading today to lower cost basis.
I am trading the counter trend bounce by cashing in the long side of my bear call spread and replacing with higher strike calls. 🙂
Hope springs eternal. Take a look at that red VIX candle will ya? Who exactly ARE these people? A low being hammered out… 🙂
Look for a green VIX print to signal resumption of droopage… 🙂
Down trend line broken, 5 minute 8/34 ema have crossed, swing highs have been exceeded. The hourly 8/34 never got negative. However, my hourly trend indicator is still in the red. I have a partial long position pending more confirmation here. Could be wrong but gotta go with what the price action and waves counts tells me, and the early signal this morning is an impulse 3 up may be firing off after completion of a 2.
Sure looks like this is the minor 3 kicking off here. If so, the bulls are about to have a MONSTER week. If yesterday’s high is breached, look out, because the bears are about to be taken to the cleaners. FWIW there seems to be a lot of strength in Asia and the UK, with Europe still lagging a bit. If everyone starts firing in sync, there’s a long way up.
Ummmm….. 🙂
Umm what? This is exactly what Lara’s wave count calls for. I know you are bearish literally 100% of the time Verne, but I am just trying to follow Lara’s analysis. Could the alternate be right and we are headed back down? Sure, but only if price proves it to be the case. I was just pointing out what the main wave count is calling for, i.e. a massive move upward. It could be wrong, but only time will tell.
Verne makes sure theres always a bearish view to consider!!! He’s often right too. But not always. I’m long here. Gotta be; my methodology says so, because the count says so, the trend indicators say so, the ema’s say so, etc. etc. We’ll see how it plays out. I might even resort to a little prayer to the market gods, because I could use some larger profits this week!!
Oh I agree. Verne shows that a skilled trader can make money no matter which way the market moves. However, as a more inexperienced trader, I learned my lesson trying to trade against the longer term trend back in August/September.
That is the wise course of action Bo. There are a few experienced traders on the forum who get the strategies I use so my trades against the larger trend are definitely not for everyone. I also happen to be currently of the opinion that the move down is not yet done, so that is how I am trading it. Lara did give an alternate! 🙂
He!He! 🙂
Futures pointing to a “managed decline” underway. I saw something yesterday that suggests a massive amount of capital is being expended to forestall a market rout. Remarkably, VIX is slightly lower. I wonder how long before it dawns on the herd that a 20 handle VIX, and thsese price levels in equties amounts to nothing short of financial prestidigitation? Something’s gotta give! 🙂
In either scenario the central banks loose: if they don’t normalize rates and policy the public will eventually find out that inflation and debt (monetizing debt) is the Political/Globalists way of transferring wealth to the top-cue market collapse or they do normalize, hike 5 times, help with de-leveraging and let recession and cyclical bear market occur. It amazes me investors willingly choose to play with fire and make hugely erroneous ethical errors in being complicit with central banks, instead of actually doing some work, research, and capital commitment to companies and ideas they like and support. Next few years should be fun and hopefully on the back end, real capital markets will return.
Foist!
If you are in South Korea, I’ll give you a gold medal!
Will it be 24 carrot Doc? 🙂