Analysis since the low on the 9th of February has been bullish. Price continues to rise as expected.
Summary: The next target is at 3,020.
On Balance Volume today gives a bullish signal that offers strong support to the main bullish Elliott wave count.
Always practice good risk management. Always trade with stops and invest only 1-5% of equity on any one trade.
The biggest picture, Grand Super Cycle analysis, is here.
Last historic analysis with monthly charts is here. Video is here.
An alternate idea at the monthly chart level is given here at the end of this analysis.
An historic example of a cycle degree fifth wave is given at the end of the analysis here.
MAIN ELLIOTT WAVE COUNT
WEEKLY CHART
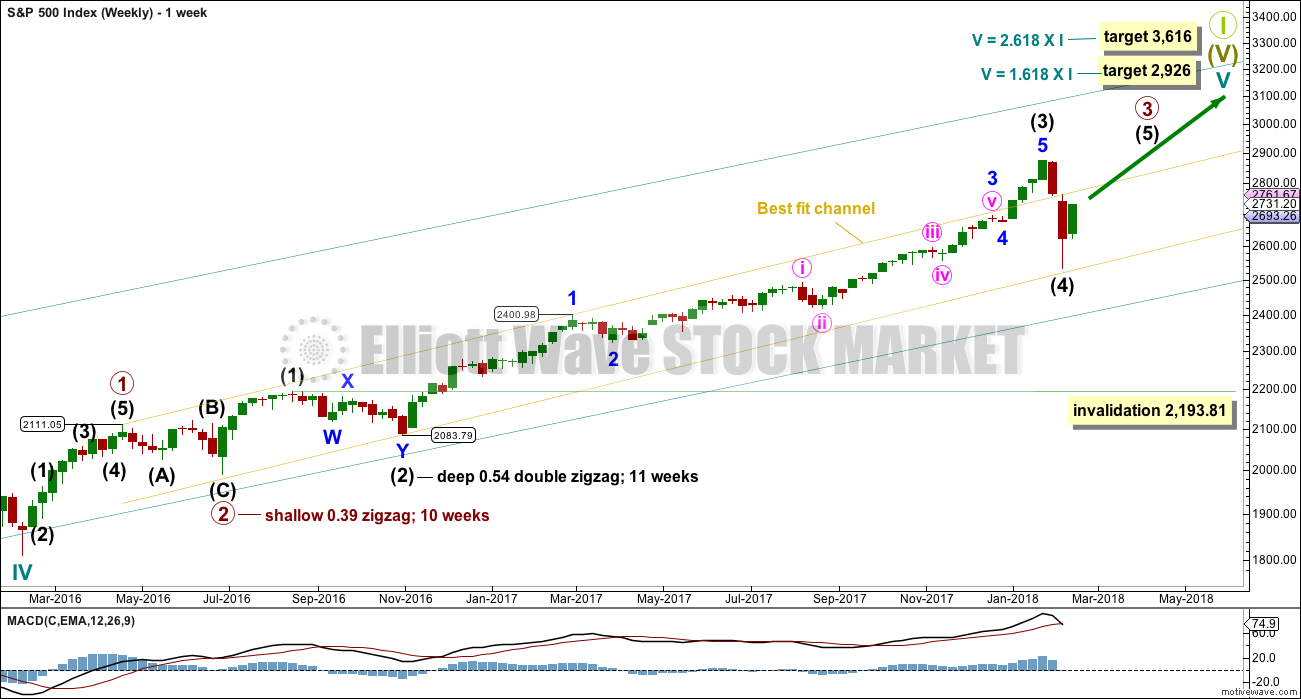
Cycle wave V must complete as a five structure, which should look clear at the weekly chart level. It may only be an impulse or ending diagonal. At this stage, it is clear it is an impulse.
Within cycle wave V, the third waves at all degrees may only subdivide as impulses.
Due to its size intermediate wave (4) looks proportional to intermediate wave (2), even though their durations so far are quite different.
Intermediate wave (4) has breached the Elliott channel drawn using Elliott’s first technique. The channel may be redrawn when it is confirmed as complete using Elliott’s second technique. A best fit channel is used while it may still be incomplete to show where it may find support. Price points are given for this channel, so that members may replicate it on a semi-log scale.
Intermediate wave (4) may not move into intermediate wave (1) price territory below 2,193.81.
DAILY CHART
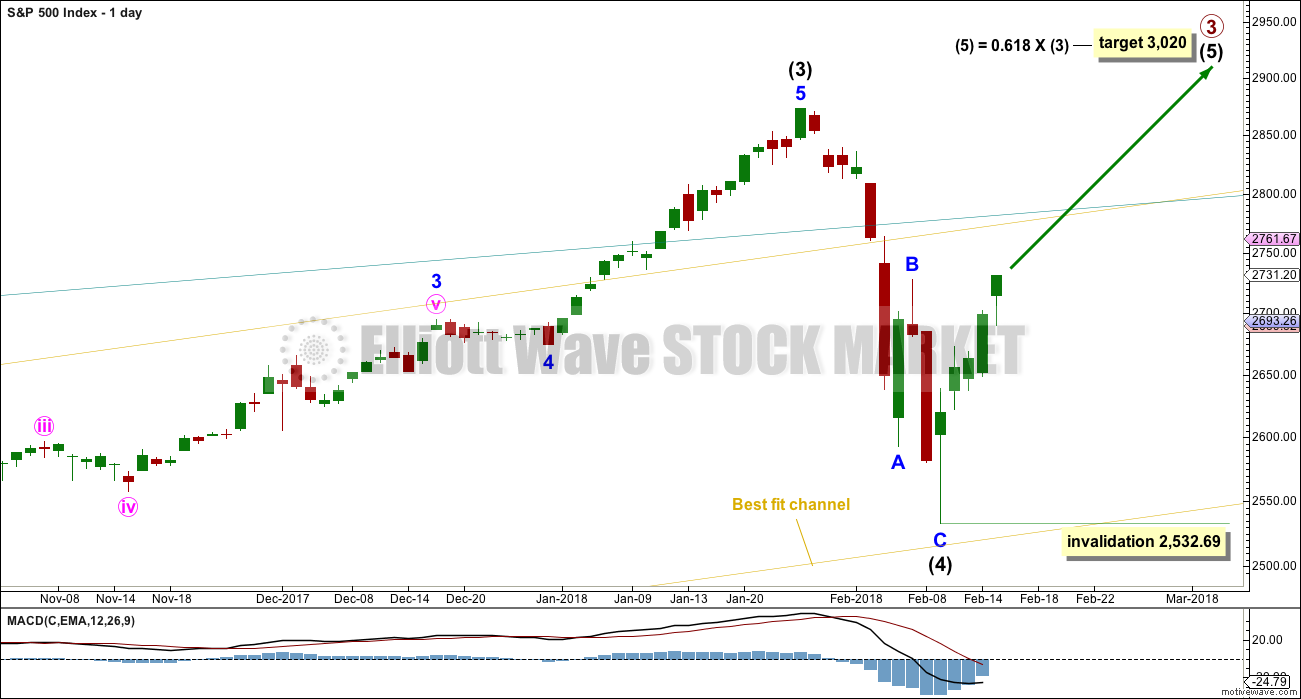
The S&P has behaved like a commodity to end intermediate wave (3): a relatively strong fifth wave with a steep slope. The high looks a little like a blow off top. This is followed by a sharp decline, which is typical behaviour for a commodity and not common for the S&P.
Friday’s low is only a little above the lower edge of the best fit channel. The very long lower wick on Friday’s candlestick is bullish. It looks like intermediate wave (4) may now have found its low.
Despite the duration of intermediate wave (4) being much quicker than intermediate wave (2), the size is proportional. On weekly and monthly time frames intermediate wave (4) now has the right look.
HOURLY CHART
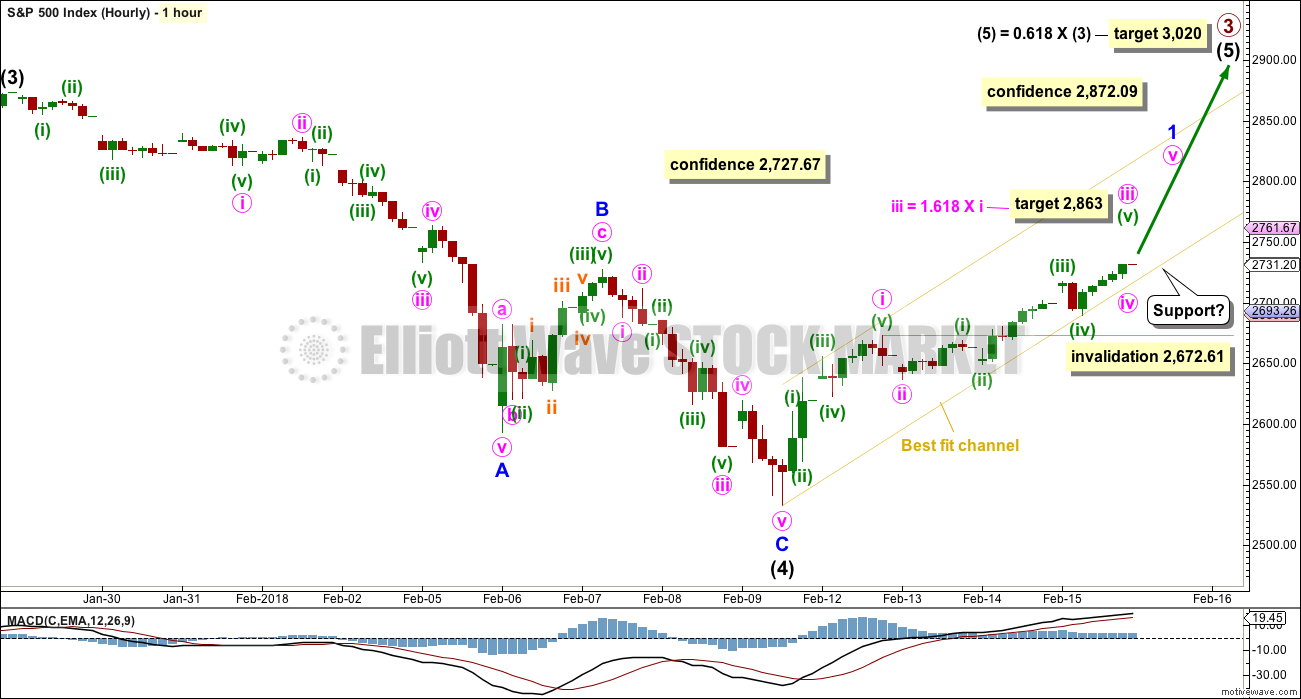
A zigzag downwards may now be complete.
A new high today above 2,727.67 adds some more confidence to this wave count. This upwards movement may not be part of minor wave C; minor wave C must be over.
A new all time high would add confidence to this wave count (even though an alternate idea published would remain valid).
An impulse upwards looks to be completing, and it is labelled minute wave iii. The target expects it to exhibit the most common Fibonacci ratio to minute wave i.
When minute wave iii is complete, then the following correction for minute wave iv may not move into minute wave i price territory below 2,672.61.
The best fit channel is slightly adjusted today so that it contains all upwards movement. If this channel is breached by downwards movement (not sideways), then it may be indicating a trend change. At that stage, either minute wave iv may be underway or possibly also minor wave 1 could be complete and minor wave 2 could be underway.
ALTERNATE DAILY CHART
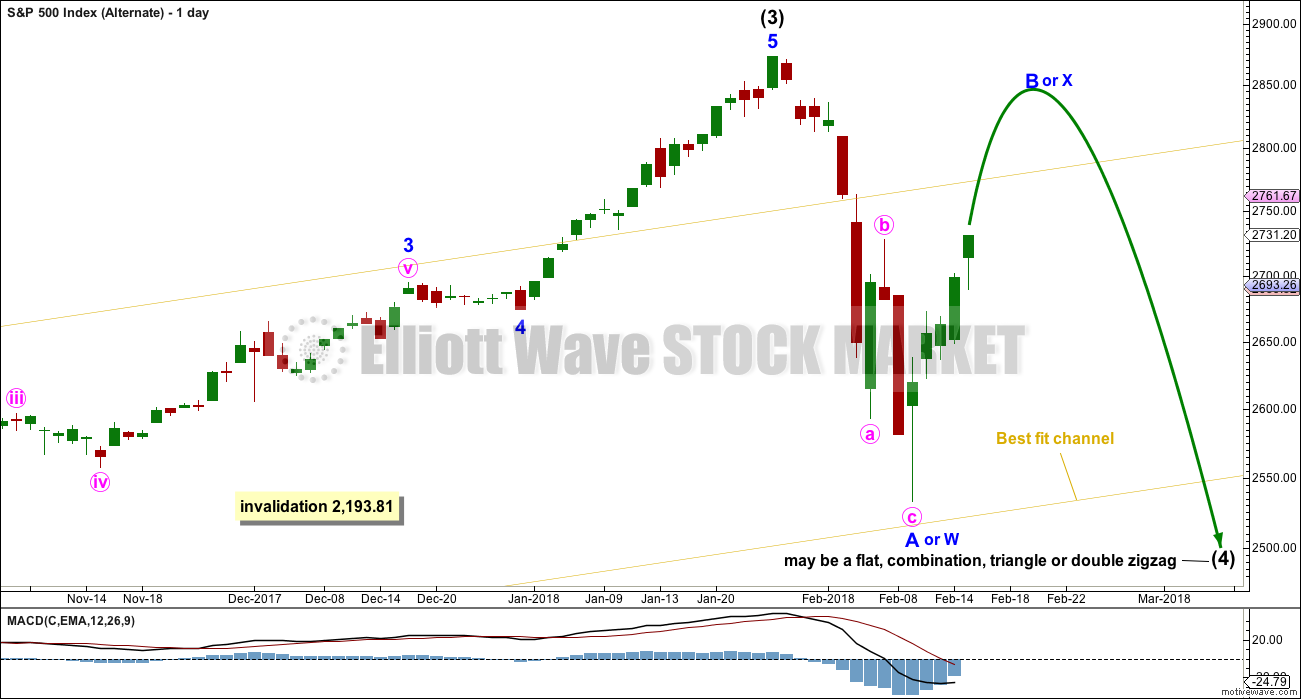
This wave count is identical to the main daily chart, with the exception of the degree of labelling within intermediate wave (4). If the degree is moved down one, then only minor wave A may be complete within a continuing correction for intermediate wave (4).
If it continues further, and if analysis of minor wave A as a zigzag is correct, then intermediate wave (4) may be a flat, combination, triangle or double zigzag. Of all of these possibilities a double zigzag is the least likely because that was the structure of intermediate wave (2). Intermediate wave (4) should be assumed to exhibit alternation until proven otherwise.
If upwards movement continues further, then the idea of a double zigzag may be discarded. Double zigzags normally have a strong slope against the prior trend, and to achieve a strong slope their X waves are usually shallow.
All of a flat, combination or triangle would have a very deep minor wave B. An expanded flat, running triangle or combination may have minor wave B or X make a new all time high. Unfortunately, for this reason there is no upper price point which differentiates this alternate idea from the main wave count.
Minor wave B or X should be expected to exhibit weakness. Light and declining volume and divergence with oscillators at its end are features of B waves, and also of X waves which are analogous.
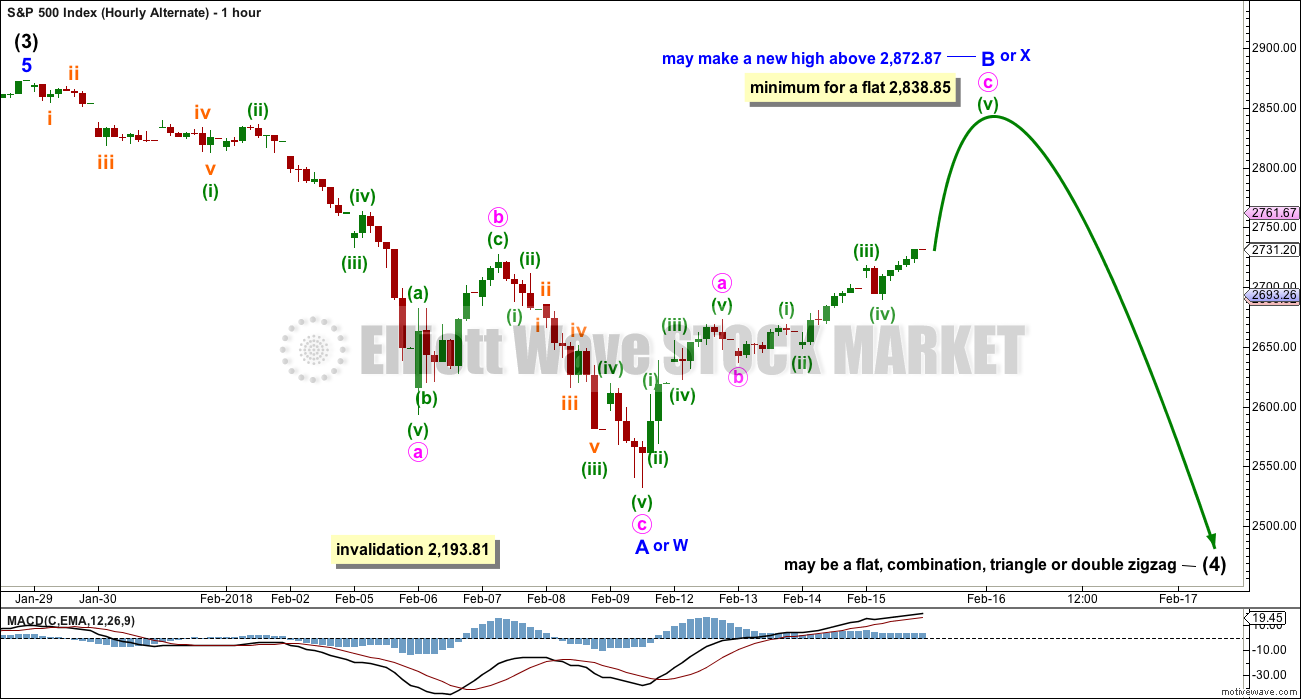
ALTERNATE HOURLY CHART
The labelling of subdivisions for this alternate is identical to the main wave count. The degree of labelling within the last zigzag down is moved down one degree.
Upwards movement off the low may be a zigzag for minor wave B. Zigzags subdivide 5-3-5, exactly the same as the start of an impulse.
If intermediate wave (4) is a flat correction, then within it minor wave B must retrace a minimum 0.9 length of minor wave A.
If intermediate wave (4) is a triangle, there is no minimum requirement for minor wave B. It only needs to subdivide as a three wave structure.
If intermediate wave (4) is a combination, then the first structure may be a zigzag for minor wave W. Minor wave X may be any corrective structure and it may make a new high above the start of minor wave W. There is no minimum requirement for minor wave X of a combination, but it would very likely be fairly deep.
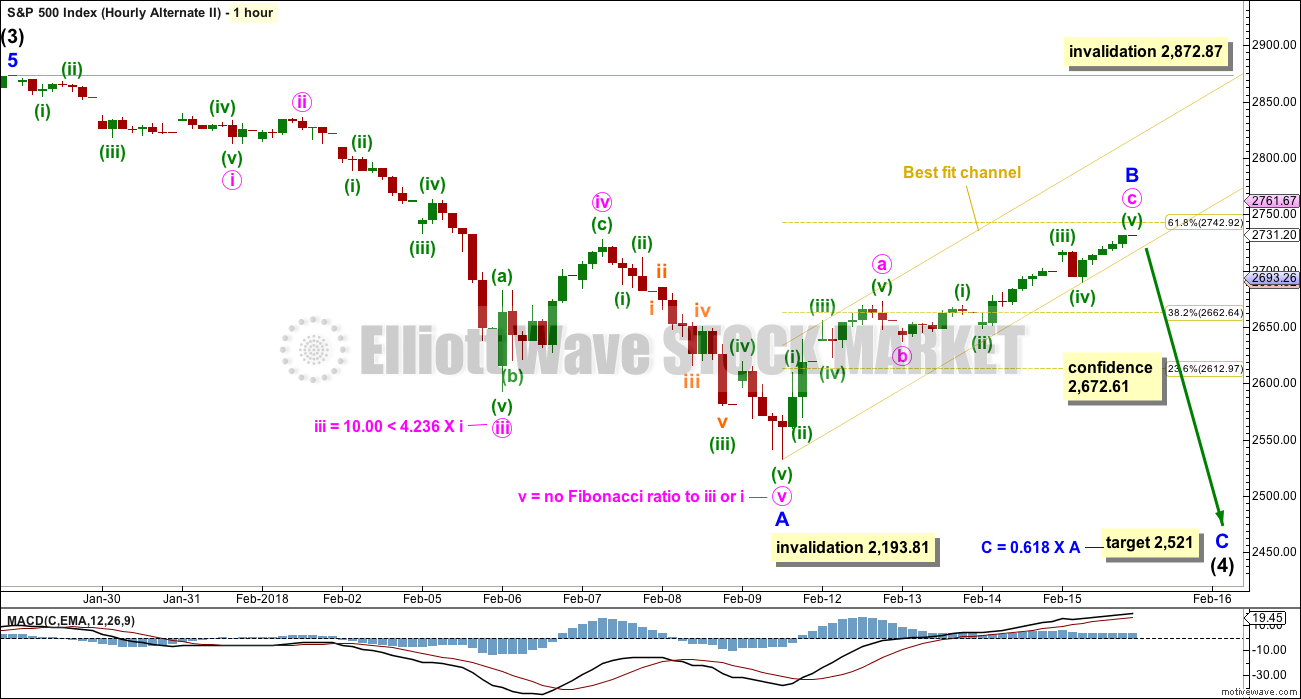
SECOND ALTERNATE HOURLY CHART
It is also possible to see the last downwards wave as a five wave impulse. Intermediate wave (4) may be continuing lower as a single zigzag, subdividing 5-3-5.
Within a zigzag, minor wave B may not make a new high above the start of minor wave A at 2,872.87.
Minor wave B may be now complete ending close to the 0.618 Fibonacci ratio of minor wave A. If it continues a little higher when markets open tomorrow, then look for strong resistance about 2,743.
A breach of the yellow best fit channel by downwards movement (not sideways) would be an early indication that the upwards zigzag of minor wave B may be complete.
The target for minor wave C assumes that intermediate wave (4) may end with only an overshoot of the yellow best fit channel on the weekly and daily charts. A long lower wick may overshoot the lower edge of the channel, before price quickly turns back upwards.
If minor wave B moves higher, then the target must also move correspondingly higher.
TECHNICAL ANALYSIS
WEEKLY CHART
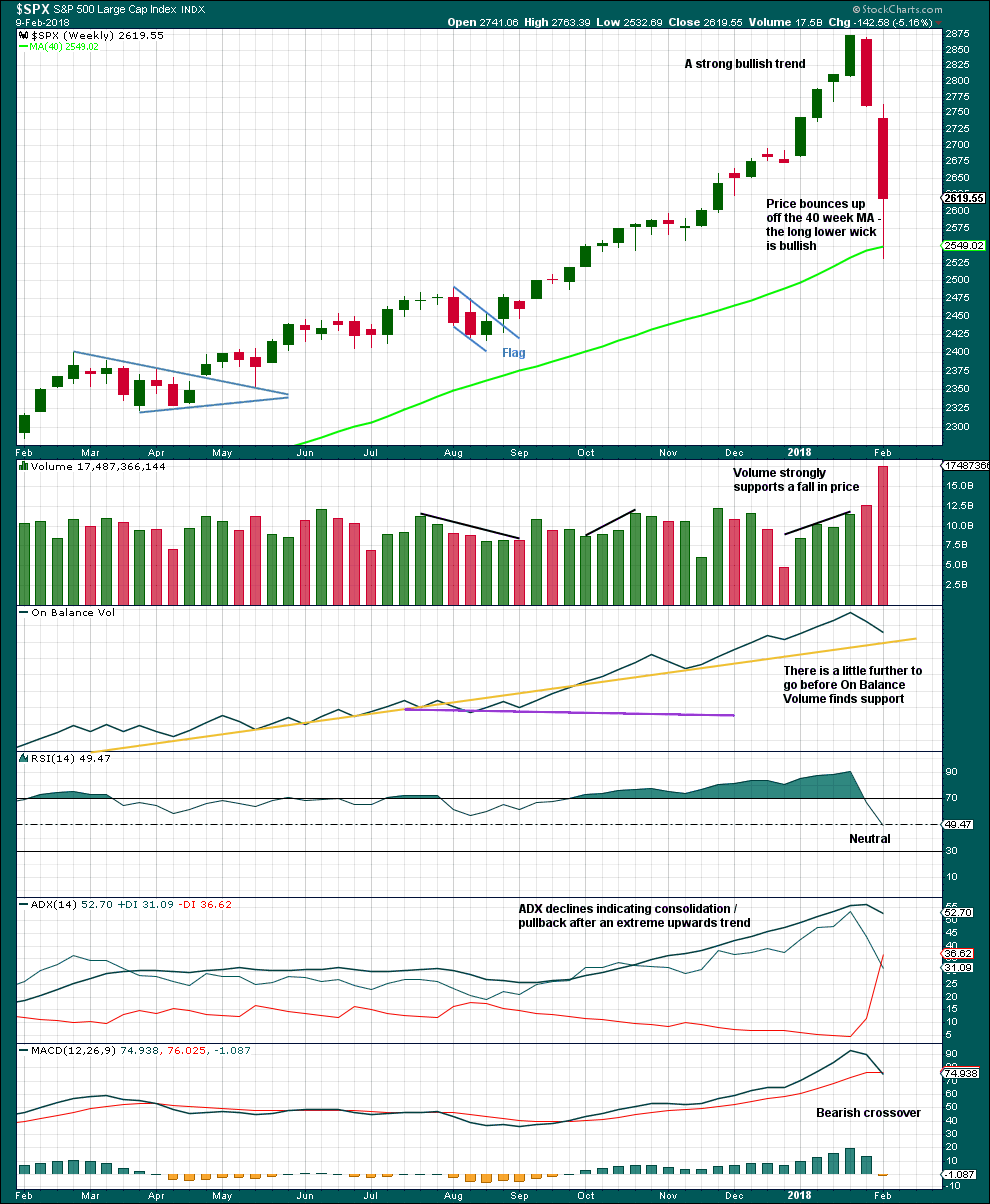
Click chart to enlarge. Chart courtesy of StockCharts.com.
This pullback has now brought RSI well back down into neutral territory. ADX is declining from very extreme. A possible trend change to down is indicated, but as yet no new downwards trend at this time frame.
In the first instance, support should be expected for On Balance Volume at the yellow trend line. A breach below this line by On Balance Volume would be a very strong bearish signal. A bounce up off the line would be a strong bullish signal.
DAILY CHART
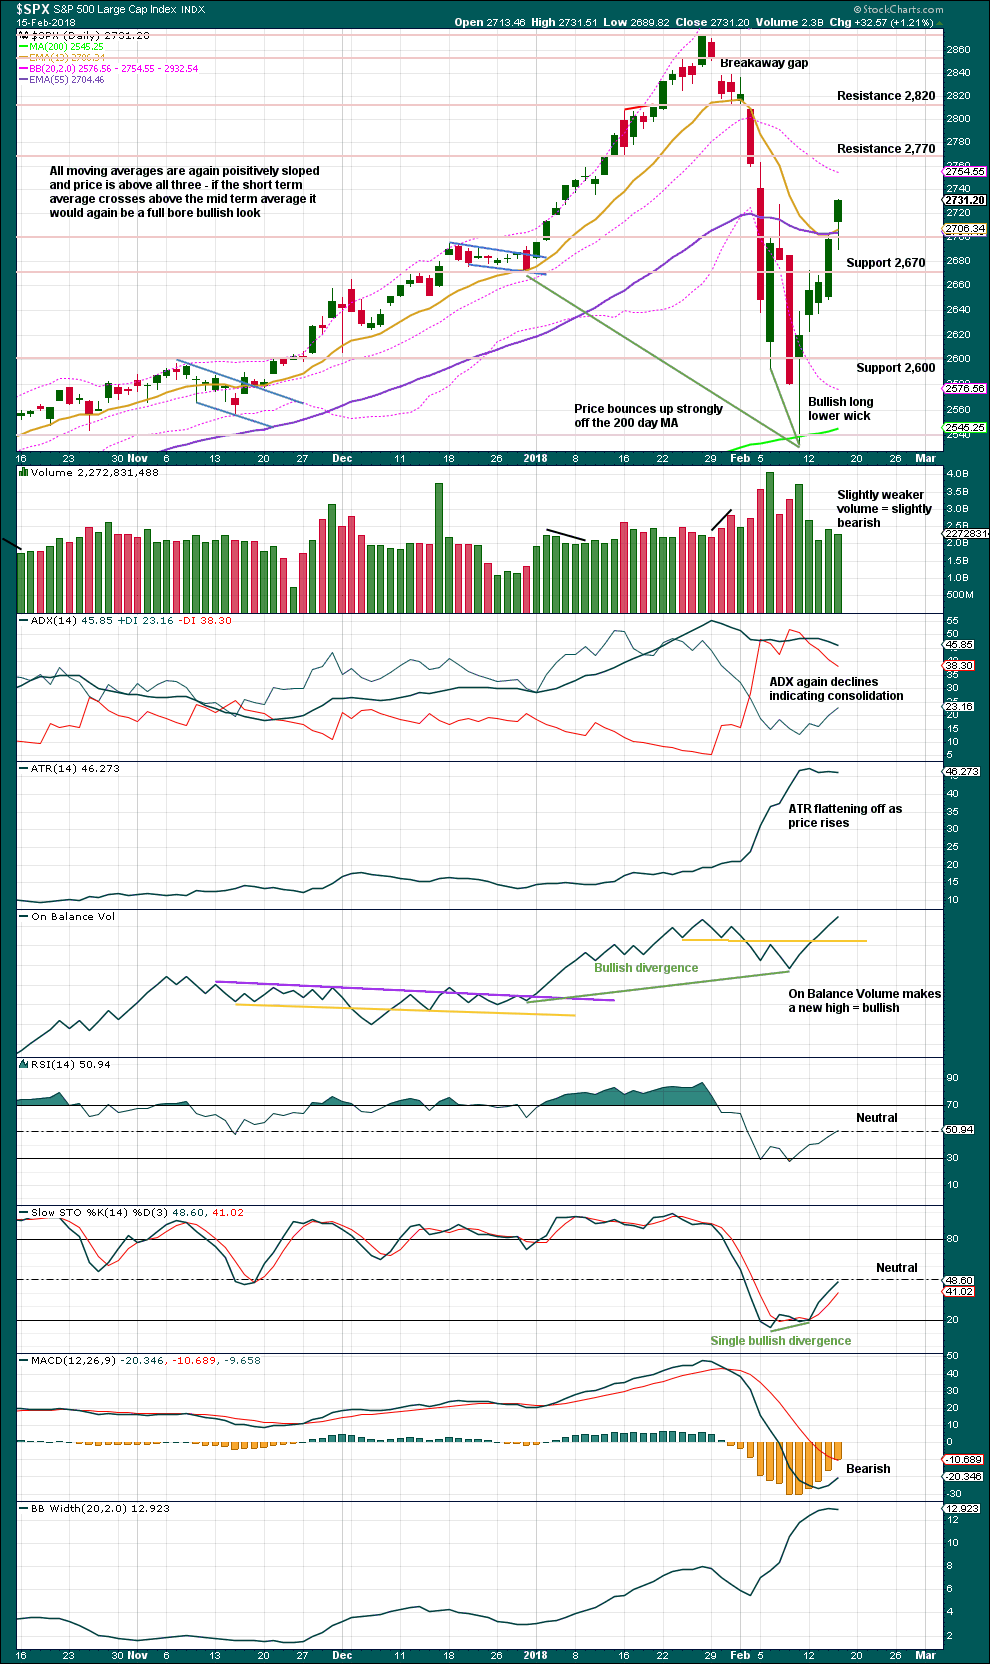
Click chart to enlarge. Chart courtesy of StockCharts.com.
The long lower wick today is bullish as is the shaven head.
On Balance Volume makes a new high today. This is a strong bullish signal. This strongly supports the main Elliott wave count.
There is now plenty of room for an upwards trend to develop here. Neither RSI nor Stochastics are anywhere near overbought.
VOLATILITY – INVERTED VIX CHART
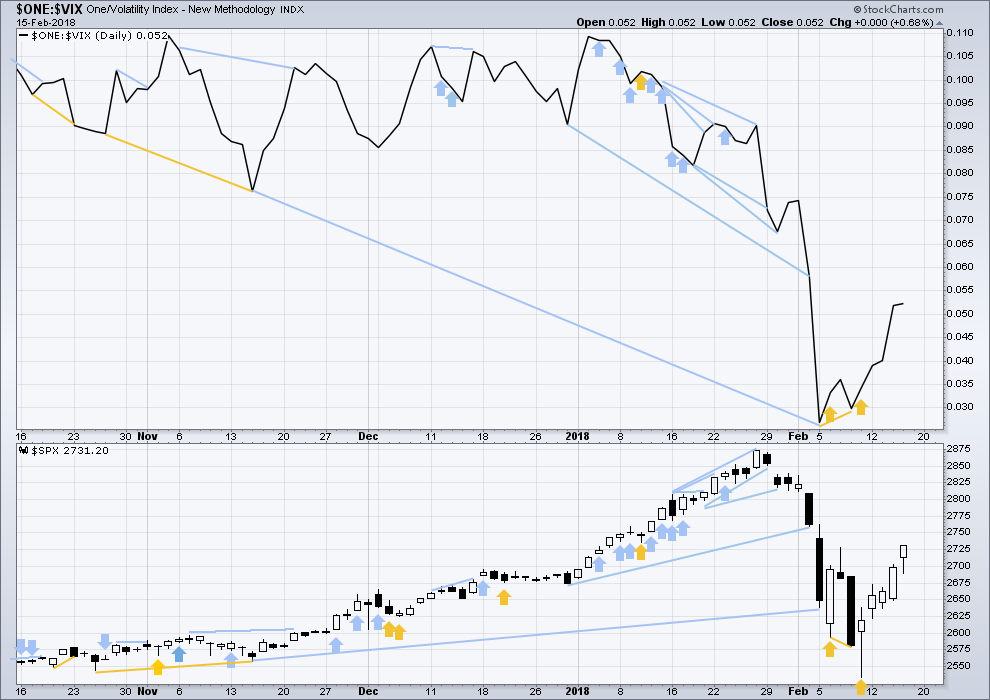
Click chart to enlarge. Chart courtesy of StockCharts.com.
So that colour blind members are included, bearish signals will be noted with blue and bullish signals with yellow.
Normally, volatility should decline as price moves higher and increase as price moves lower. This means that normally inverted VIX should move in the same direction as price.
Both price and inverted VIX have moved higher today. The rise in price comes with a normal corresponding decline in market volatility.
BREADTH – AD LINE
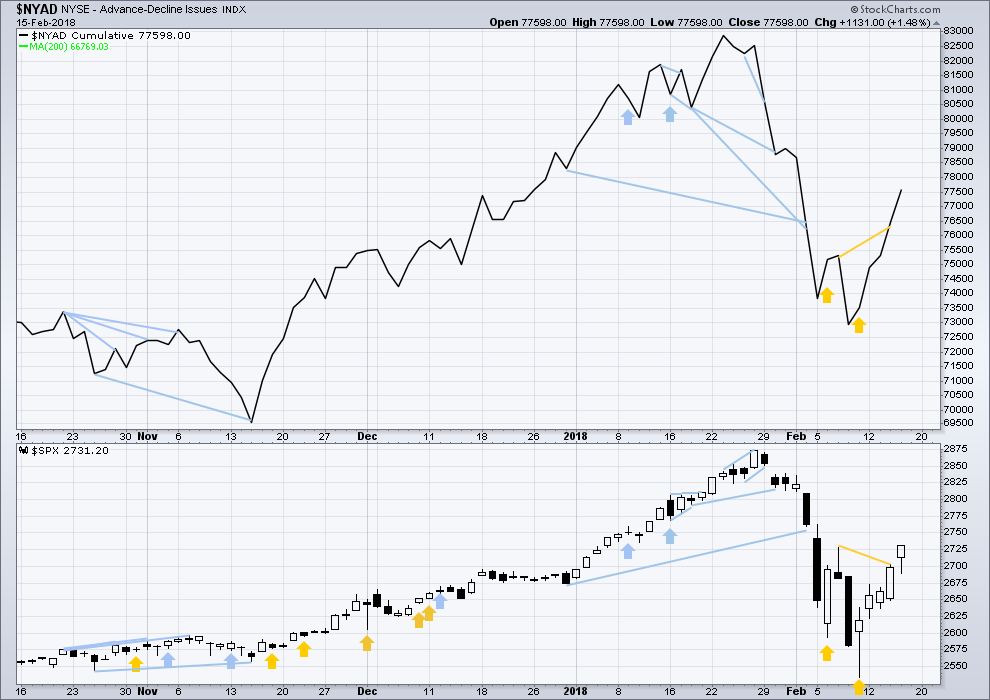
Click chart to enlarge. Chart courtesy of StockCharts.com.
There is normally 4-6 months divergence between price and market breadth prior to a full fledged bear market. This has been so for all major bear markets within the last 90 odd years. With no longer term divergence yet at this point, any decline in price should be expected to be a pullback within an ongoing bull market and not necessarily the start of a bear market.
All of small, mid and large caps last week moved lower. The decline has support from wide breadth.
Breadth should be read as a leading indicator.
Both price and the AD line moved higher today. The rise in price has support from rising market breadth. This is bullish.
DOW THEORY
All indices have made new all time highs as recently as three weeks ago, confirming the ongoing bull market.
The following lows need to be exceeded for Dow Theory to confirm the end of the bull market and a change to a bear market:
DJIA: 17,883.56.
DJT: 7,029.41.
S&P500: 2,083.79.
Nasdaq: 5,034.41.
Charts showing each prior major swing low used for Dow Theory are here.
Published @ 7:09 p.m. EST.

Of course in the chart below any decline could well come in what is actually a new uptrend as Lara has pointed out and would have to be traded nimbly…but of course! 🙂
For many months, now a very reliable market “tell” has been long lower wicks at the end of declines. Almost without exception that has been the signal to the start of a strong move higher. Could another tell be now developing in the market? While not technically gravestone dojis as those require the same opening and closing prices, recently long upper wicks seem to be signaling an imminent market decline. Very interesting.
Agreed, the candlestick wicks should be given attention.
Although smaller wicks can also mean a smaller shorter term move in the other direction… as your comment following above points out.
I guess we will see if Friday’s shooting star gets confirmed Tuesday… 🙂
I guess the rumors about some heavy hitters taking the other side of the ridiculous short vol trade were correct. One of them was Peter Thiel.
It is just beginning to unwind…the ETPs were spared going into negative equity by a hair’s breadth…
It strikes me that this 4 hasn’t gotten back to the price area of the last lower degree 4…yet. And it strikes me that this 4 is still a bit on the shallow side compared to the matching 2. AND it strikes me that perhaps we have a completed X wave up, and a Y down coming next/now. So…I’m guessing there’s more down comin’ a real soon here. Perhaps.
Hi Kevin
If theres a Y coming what does that mean?
How low can a Y wave take us?
Thank You
the Y wave may take about as long as the W wave…. most commonly.
Lara’s of course correct, and note that at Y = W, price should just about reach the top of the prior minuette 4 around 2717.
However, it’s important to keep in mind that this could be the start of a much larger wave structure down, including a massive C wave down to new lows below the daily 200 MA. So careful, because this may not be a bull market corrective wave but the start of a bear market impulse down (or, if you will, a correction at a very high timeframe, maybe primary). The bullish count invalidation is the top of the minute 1 around 2672. And perhaps the zone at which shorts should be seriously considered?
It could still be a bull market possibly and still have a correction from here.
So lets just say we go to 2760 – 2780 early next week.
We can correct to 2680 easily and then still go higher from there.
I went back for the last 70 years to look at 10 – 12% market corrections and even in bull markets it can take 2 – 4 months before the market hits new highs and during those time frames i was looking at monthly candle sticks and i noticed that a lot of them where maybe not showing a low as the first drop on the monthly candle sticks but i did notice a lot of them where showing a 5 – 7% of there peaks on the second month and even the third month of those candlesticks.
Theres been a just a few times where the market came completely back in 4- 6 weeks after a 10% correction to find that just 3 – 6 months later led to a bigger correction.
Even when you look at the 1990’s stock market chart most 10% corrections at 3 – 5 month shelfs were the market somewhat moved sideways.
All thoughts and ideas are welcome.
Thank You
Again, not trying to be too dismissive here, but the best evidence suggests the bull market has a lot of room to run. It’s not *impossible*, but it would suggest that our best efforts at predicting these types of moves are futile. It would suggest that 100 years of technical analysis cannot be replied upon. That is a scary thought.
Another possible count is a second wave after an impulse down now at a 62% retrace, or even an a, b of a zig zag with a c down on deck to complete wave four. As traders we have to be aware of all the possibilities and prepared to take what Mr Market offers… 🙂
I sure hope so. My UVXY 16 strike calls got whipsawed around by those wiley market makers but sadly for them, they ended up slightly in the money. They are going to have to go get me a couple thousand shares come Tuesday, lol! 🙂
I had a feeling the futures buyers would step up into the close to get positioned on the cheap as they have been doing all day!
If anyone is holding UVXY calls you should see a nice pop on Tuesday as MMs are going to have to deliver shares of 16 strike calls which closed in the money. I am sure they dislodged quite a few traders not familiar with their OpEx tricks. They will have to buy UVXY at the market so we could see a gap higher Tuesday- a good time to cash in some chips! 🙂
The trend is up folks.
Easiest way to make money is to stick with the trend.
Until of course the trend changes to down.
First hourly chart updated:
Second alternate hourly chart updated:
Nailed the short term top of TMV, nice. Great run today!
stopped out!
That was not symmetrical
??? The most recent swing low was 2727, any stop above there in this situation is suicide, IMO. You have to use sufficiently sized stops. If it’s too large a loss, size down. Also, if we are talking about short term day trading here, there’s been no buy triggers yet.
Just my $0.02, and just trying to help, I don’t mean to be critical.
One trigger just fired: swing high on 5 minute exceeded. I popped for one unit there. My second unit will be when confirmed with trigger #2: a cross of the 8/34 ema lines on the 5 minute. I won’t/don’t use these triggers any old time: they are nice when popping off what should be a 4 bottom, in a strongly uptrending market.
No, I was selling the c wave down
I gotcha. Yea it was a shorty, consist with this tremendous buying pressure we’ve had all week.
This is really too wierd. The banksters generally wait until just before the close to ramp the market higher and intimidate bearish trades getting positioned for the coming week just before a holiday week-end. How come they ramped it early today?
What if the bulls threw a party and nobody came??!! lol!
Are we setting up for a bloody Tuesday?
I am watching the 50 day with GREAT interest….
Verne, Gartman is short. I’m now thinking I’ve gotta cover….dammit! 🙂
Oh, no!!!….say it ain’t so! 🙂
yep, I agree Kevin
A minute 4 here that is symmetric in length with the corresponding minute 2 would put the bottom around 2719. And C = A of this 4 is at about 2721. Then there’s the 1.62% extension of A down and that’s at 2717.
So…2717-2721 is the zone I’ll be watching intently for buy triggers out of.
Though one of the other pullbacks in the last week projected here falls at 2727, which price just about hit a moment ago. That’s very possible too. I’m taking buy triggers, bottom line. There could be a ferocious start of the 5 before the bell, wouldn’t want to miss it!
Hey Guys, FWIW, you generally DO NOT see VIX moving from deep with red territory to strongly green on minor pullbacks during an impulse wave up….
Good data to have. I will be going short if/when the SPX 20 minute 8/34 crosses over negative, and we get a red bar below the 34. Not until. This market should be launching a 5 wave up soon. That biases me to the long side. But I’m flat until the all clear on this 4 is sounding.
wave c of minute 4 I think
I am wondering of the market makers are also assuming the implosion of the explicit short vol trade now means it is quite OK to go back to the old days of piling on the VIX and other vol instrument shorts….hmmnnn…!
Either that, or some entity now thinks that VIX 20 could be another even horizon trigger…!
Either the market holds the 50 day line, or it strings the bull up by the neck…very simple people! 🙂
Fade to save….very fun!! My vix calls are ripping already
I suspect quite a few folk in the hedge fund community are buying…lol!
He! He! I am holding a few UVXY 16.00 strike calls as I knew the market makers would screw around with that strike today, lol!…boy are they feeling some PAIN…it could get much worse! 🙂
This looks like minute 4 of the 1-up. Could be over before the end of the day but I think it could also extend into the close. I’m looking for one more high and then a day or two of downward movement, followed by one of the best buying opportunities of the year as the 3 kicks off. Personally I think we’ll see panic buying into the close followed by a high on Monday and a drop to the 2700-2720 area.
Your probably right about one more up day.
Lol im not sure about panic buying on super low volume.
More like easy manipulation by big players since today has lower volume then usual.
No-brainer dude! 🙂
But of course, we know that there is NO SUCH THING, as market manipulation! Good luck trading with that point of view. I could tell ya stories about a few VIX expiration “events” that’ll make your hair curl! 🙂
Filled on UUP put credit spread for 0.11 🙂
Yes indeed ladies and gents…somebody very interested in buying cheap vol. A green print and we could see a wee bit O’ panic… 🙂
He!He! Once again very timely repurchase. Come on bulls….one more ramp! We got plenty of time before the close! lol!
Why, I wonder, would anyone of sound mind be diving long into a market of uncertain direction into a holiday week-end??? Oh, wait….look at that volume…..maybe not too many jumping on board after all… 🙂
GBTC has move from a low of 9.6 to a high of 19.4. In 10 days. So if you are looking for high leverage and volatility…wow.
Kevin,
Last time I inquired there were no options or shares available to short. This one is over the counter for BITCOIN and with USD move higher cryptos will come down JMHO.
I have no doubt it’ll come down. And go up and come down. I’m merely pointing out it’s available, with super super super leverage. Not often you can trade for 10’s of %s in days with flat out purchases!
If someone wants to trade it both ways actively, you have to go to the futures market.
The premium over the actual asset of that beast is truly incredible!
Strictly for short term trading imho! 🙂
SPX approaching 2757 where minute iii = minute i, and the start of a very likely zone for a wave iv of some timeframe to start up. Price seem exteeeeeended to me. Someone of size is going to want to book some profits soon I suspect.
61.8% fibo at 2742 now working as strong support…for now.
Hi Kevin
Now it seems the 2742 is now acting as a resistance.
We sill see if that holds up.
Goners! Now how deep does this go? Has hit my smallest symmetry move lelvel. Next one down I have is at 2727.5. I doubt it’s going far but…I won’t reenter long until a recross of the 5 minute 8/34 ema lines and above the 62%. Nyet…
I snuck a quick bite out of VXX as it started to fall, pad the profit line a tad for the day.
As I was saying….someone of size is going to want to book profits.
Quick pop on March puts. Buying back for 10% less. These kinds of manic market moves, contrary to popular opinion, are NOT the sign of a healthy market. The market continues to behave as if risk has disappeared….but some of us know better…. 🙂
Sold expensive March puts. Let’s hope the bulls remain frisky so I can buy em back… 🙂
I just remembered markets are closed for Presidents Day on Monday!
Wonder how strong things will be this afternoon?
If they fade it…RUN!!!! 😀
One of two things is going to happen to cement the case for full bore long, or full bore short. The move down following this impulse will either bounce at the 50 day, or it will slice right through it. No need to follow the lemmings. Mr Market will make it perfectly clear what he intends… 🙂
couldnt agree more
Interesting. I just noticed UUP is sporting an inverted island gap reversal with gap up today closing yesterday’s what is now starting to look like a capitulation gap down. If the dollar is turning here, it has a LONG way to go to the upside and it should be s set-it-and forget-it trade. More adventuresome traders, like moi, will employ the new trend to execute a number of safe doubles.
Question: How much money will you have if you can safely double 500.00 in ten consecutive trades? 🙂
(rolling profits, of course)
500 * 2^10 = 500 * 1024 = 512,000.
I like math. I like 10 straight winners in a single instrument even more. Best of luck with that! Particulary with the “safe” part.
He!He! Gonna post ’em 🙂
Let’s try to get our initial 500 courtesy of Mr. Market in three or four credit spread trades. Selling to open the March 16 UUP 22/23 bull put spread for limit of 0.10, 25 contracts. Risk is 2,500.00 if UUP trading below 22 at expiration. Reward is 250.00 if above 23 for 10% ROI.
Selling out of the money puts to avoid ambush assignment.
Will close spread if UUP moves and closes below 23.00.
My, Oh my! The BTFD cohort sure are frisky! 🙂
Timely repurchase of short puts.
Now to look at VIX. Will the risk parity dudes keep going long, albeit in stealth fashion?
Wow, this market is really slow today!
SPX has moved up 0.6%, in only a little over 2 hours of trading. In normal times, that’s not slow! These haven’t been normal times.
I was wondering what Nick meant! 🙂
Talk about strange….March SPY puts have not BUDGED on this ramp up… What the….!!!!!???
I wanted to roll out my Feb short puts but hardly worth the effort..buying back Feb 28 265 short puts. Opening STO order for 267 puts at 10% above current ask, holding 263 puts….
I am glad I took profits on my Miners trades yesterday. UUP gapped higher at the open. If the dollar has bottomed, there are going to be some intereting implications. I thought it was very strange that the dollar was declining while rates were moving higher. It will be interesting to see how many hold long positions over the long holiday weekend.
TMV still consolidating gains…
I’ve gone long TMV and UUP this morning, myself…oh, and GLD, too. And of course I’ve got UPRO. And a little ERX and ITW. I’m watching HAL closely for a buy signal. Hey hey hey there went the 62% fibo! Up up and away today!
Still holding TMV long term. Looking for a spike down bear raid to reposition short term trade…ever seen one of those? 😀
If UUP gap remains open at the close, I will be loading a massive bull put credit spread!
The market is going up fast, that’s all I know for certain. So I’m trading it long, using a 5 minute 8/34 ema and swing indicator methodology for one trade, and a 20 minute similar methodology for a second. Given the immediate strong upward trend, I won’t short unless/until the 20 minute system signals a short. The 5 minute system, if it signals “short”, I merely exit. Once the market gets back into a bear mode, I’ll switch that approach around. Trying to get more mechanical to make sure I’m maximizing on these moves. I see the market stalling at the 62% fibo at the moment, but I suspect it’s going to push through it here before flashing any sell signals. We’ll see!!
Yep. My bull spreads already nicely in the green but I have a trigger finger ready to slam the door shut on short puts at any sign of monkey business! 🙂
The next bearish signal will be surrender of the 50 day. Until that happens, I will enjoy the ride…
There is another interesting dynamic occurring in the market right now. Chris Cole of Artemis Capital has stated in no uncertain terms that people who are assuming the short vol matter has been resolved with the blow-up of XIV and SVXY are seriously mistaken. He said that is just a fore-taste of what is coming. Those ETPs represented only the relatively tiny explicit short vol trade as compared to the multi trillion synthetic short vol trade that will have to be unwound over time unless VIX returns to historic low values. At these levels of VIX hundreds of billions of exposure STILL needs to be unwound, or hedged at these higher VIX levels. That situation is very interesting on an OpEX day as market makers are manipulating price around strikes to ensure worthless expirations, while hedge fund managers must continue to hedge their VAR synthetic short vol positions by going long VIX futures. This makes what UVXY does in this environment of competing interests quite revealing as there is a lot of interest in going long vol on the cheap! We don’t know if resolution is going to come in two weeks, or in two years but it is coming….! 🙂
Reading some other reports yesterday and it appears that momentum players have been buying stocks in this rally while the big players (Smart Money) is selling into these rallies. I am sure once the options expiration is over, we are likely to see the true colours of this market…standing put till then.
On balance volume has been a quite reliable signal. A close above the 50 day ma Friday means time to load up on March bull put credit spreads! 😀
Come on Verne, volume has declined each day its gone up, up/down volume is negative, over-confidence immediately crept back in. Absolutely, massive outflows from equities and credit as well. Suckers rally; excuse me 2 wave bounce or B wave which already displayed negative divergence on the hourly. Plus, Dax and FTSE have all confirmed downtrend.
Oh I agree! I still see a possible expanded flat or zig zag for a possible wave two, which technically can re-trace 100 of wave one!
I said “spreads” because even if a bounce of the 50 day means we go higher, which I think it exactly what it would mean, it does not mean we are going to the moon! Bullishness certainly is once again abounding! 🙂
How many times does Lara have to point out that volume has consistently declined throughout this bull market? The heaviest volume day was the big 2/6 up day. On balance volume just broke to a new all time high, meaning up/down volume is *up* and now shows bullish divergence with price. FWIW, OBV breakouts have been THE most reliable indicator throughout this Trump-rally. I think there’s a lot of people waiting for a C wave that will never arrive. The bulls’ days are numbered, but at this stage, unless you believe there is imminent economic weakness about to emerge, it is hard to be anything but bullish.
Bo,
You think in the enviornment that will stroke interest rates and inflation higher, the bullishmess will remain at current levels. I am surprised as rate trend higher, we are going to see the consumer side getting hit the most due to over exposure to cheap line of credits and loans including mortgages. People are maxed out of loans and mortgages.
Bo is clearly not a macro economic outlook kind of guy so I get the impression that those kinds of arguments will not sway. He does make a salient point about the persistence of low volume as the market has trended higher and I also agree it is clear we cannot ignore signals from OBV. I have been wrong every time I did. Personally, the reclaim of the 50 day is my line in the sand for short term trades. 🙂
imminent economic weakness, are you kidding? Retail sales lower, mortgages lower, PPI and CPI both much higher than expected, consumer credit above 13trillion, yields up and dollar down due to credit risk and economic weakness, auto sales 5 yr low, capital goods negative .6%, Baltic Dry Index below is 200 day. And how big is the trade deficit and FEd debt?Moreover, the market does not and never will trade on ECON, it’s liquidity and rates driven only.
You’re talking about slight declines from all time highs all across the board. Retail sales declined this same time last year, and tell me, what happened in Q3 and Q4?
High PPI and CPI? We had 3 rate hikes last year. Inflation is only high compared to the absurdly low levels we’ve had throughout this recovery. Literally all the values you cite at are above average levels compared to the last 10 years.
Compare the environment to 06-07 and it’s night and day. The housing market isn’t crashing, the banks are secure. And that’s the most critical factor anyway. Like you say, the market trades liquidity and rates. I’d also argue you can factor corporate earnings into that too.
Banks secure, thats a good one lol
Iranian banks yes, all others, NOPE!
By the way, LIBYAN banks were also sound, AND Iraq’s….are we starting to see a pattern here?
Some of you know exactly what I am saying…others…never mind!!! 🙂
You can cry conspiracy theory all you want, but all the evidence suggests the banks are a thousand times more secure than in 2007. Tell me, where’s the Lehman of today?
Here is the St Louis FED report on current US banks capital ratio.
What is wrong with this document?
https://fred.stlouisfed.org/series/DDSI03USA156NWDB
Let’s see, an additional 57 T in global debt since 2007 equates to a banking system 1000 times stronger?….that is a most interesting perspective! 🙂
A MINOR 2 is LOOMING. It’s not impossible that instead of just ahead, the minute 4 was the pullback today (the 15th), and this is now minute 5 underway, and when complete, minor 2 starts. The real point being, when the next correction starts up, don’t assume it’s “only” a minute 4. Probably…but not guaranteed. The minor 2 when it shows up could take price back very close to the 200 SMA and not violate any impulse rules. These are massive wave structures.
Also, I think that a viable target for minute iii is at 2757 (or so), where minute iii = minute i. The target at minute iii = 1.618 * minute i doesn’t seem consistent with the existing wave lengths (it’s rather high), but we’ll see. Another significant level is about 2759, the 1.618 extension of minute i. So my first key decision/resistance zone tomorrow is 2759-2779, a large zone but as I see it a high potential turn zone for starting at the minute iv (or minor 2, possibly).
That would be great green light to see a bounce off the 200 day and huge confirmation we were done with the correction.
Also, there’s the 61.8% fibo of the entire ATH to SMA 200 swing sitting just above at 2742. Huge market decision point there. So key levels I’m working today:
2742 (62% fibo)
2757 (minute i = minute iii)
2779 (1.62% extension of minute i)
Best of luck all.
(note: I typo’d in the above note when I entered 2759, intending it to be 2779 in one spot…and then again when I intended it to be 2757. Late night work does that!!).
Minor 2 could possibly be shallow also.
That was a feature of the last rise up for some time.
I’ll take a stab at answering the question, “why are so and so always so bearish?”
I believe the answer is simple and pragmatic. They are a corporate shop, and they have a marketing/mechandising department. That department knows very well that the best way to get more members is to get ON TV on the financial talk shows. The only sure path to getting there is to CALL A TOP in the market (calling for higher highs and then having that happen? Ho-hum as far as the media goes!). So they simply demand that their practioners CALL SOME TOPS!! It doesn’t matter if the call fails over and over; everyone forgets. Eventually, just as a broken clock is eventually on time, they call a major top. Success! They get a spot on TV. Their membership goes up. Never mind the serious customers who fled long ago because of the poor quality of analysis.
Probably too simplistic but it meets Occam’s razor, anyway.
Thank you Lara for not striving to get TV gigs!!
FWIW the membership here does increase when price moves lower strongly. And declines when price moves up in a slow steady march.
And I totally suck at marketing. So, yeah. Whatever.
I can only put my analysis as it is out there occasionally for public consumption. They will make of it what they will.
I potted the post on this site for a while . Never really gleamed much from it . It s amazing the number of post when the market is down vs the number of post while the market complacent . There were a few time s in all the volatility late 2016 when post were over 100 on this site . Interesting observation .
Well, perhaps your marketing skills and strategies are not what you’d like them to be. However, the most important marketing quality is accuracy of calling the waves. The 2nd most important quality is care for your client. You, Lara, are tops in both.
As an example, lets use the most recent 340 point SPX correction so far followed by an almost 200 point rebound. First of all, no one (and I mean no one) anticipated that magnitude of this decline. That is why it was a shock. You, Lara, had to switch from anticipating a Minute correction to Minor and ultimately to Intermediate. You did this without hesitation once the data presented itself, even though a couple of days before you said an Intermediate degree correction was an extremly low probability. You made the switch and stuck to your guns. And you were right on! You helped guide your clients carefully and conscientiously because you care for them. And you nailed the bottom!
You can go back to the summer of 2016 when we broke out above the SPX 2100 level for another wonderful example. We all were bearish, this includes other EW analsyts, but once we broke out, you made the switch and forecast a target towards 2900. People could not believe it considering all the financial negatives of the US and elsewhere. However, that was a fabulous call. We are we today? We are headed directly towards 2900+ having already come within a stone’s throw of it. Tops analysis!
I am in my 7th year with you Lara, not because of glitzy marketing campaigns and unrealistic promises of riches without work or risk. Rather I am still a member here because 1) Your market analysis and commentary is tops, and 2) You care for your clients. I appreciate both of those characteristics.
Now, as a marketing person, your job is to figure out how to present that to potential clients in a way that makes them want to subscribe to your services. I don’t know how to do that. But you might have a subscriber who does.
Furthermore, what is more important to you in life, having the largest subscription base or helping some people earn the most they can investing while using your guidance? I think I already know the answer.
Have a great weekend Lara. In my book, you are the tops!
Me too, Rodney. You said it better than I could! I appreciate Lara’s exquisite analysis and also her fine customer care.
Keep up the great work, Lara!
Unfortunately I’ve missed this amazing rebound the last few days, as my bride and I are traveling. I kept watching for that sharp downward C, and was reluctant to go long and then ignore it while traveling. Of course, looking back, that would have been exactly the most profitable thing to do. Oh well…
Hard to believe that people who sign up for the service walk away. I don’t get it!
Thank you for the very kind words Rodney and Curtis.
And congratulations Curtis on your marriage!
Cesar has the contact for a copy writer who specialises in technical analysis, we’re hoping this person can help.
But I can never do anything too “salesey”. I will not make promises of riches via trading. Because I’m not teaching people how to trade, that’s a skill quite separate from analysis.
When price broke out over 2,100 though my first target was 2,500, not then 2,900. Just to be accurate Rodney LOL
After more than 21 years, she’s still and always my “bride!”
Lara
I really like all the possibilities that you present.
Much better then EWI where they just say the market is crashing with really not much alternatives.
What do you give the odds of it hitting the 2743 ish give or take some points then going down.
Thank You
There may be some resistance about 2,735. So price needs to break through before we expect it will continue higher.
Number Uno…Where is my buddy wabbit?
Valentine’s not over yet Doc!