
This Elliott wave count begins at the end of the global financial crisis in March 2009. This Elliott wave count will focus only on the current upwards bull market, which is subdividing as an impulse.
MONTHLY CHART
Click chart to enlarge.
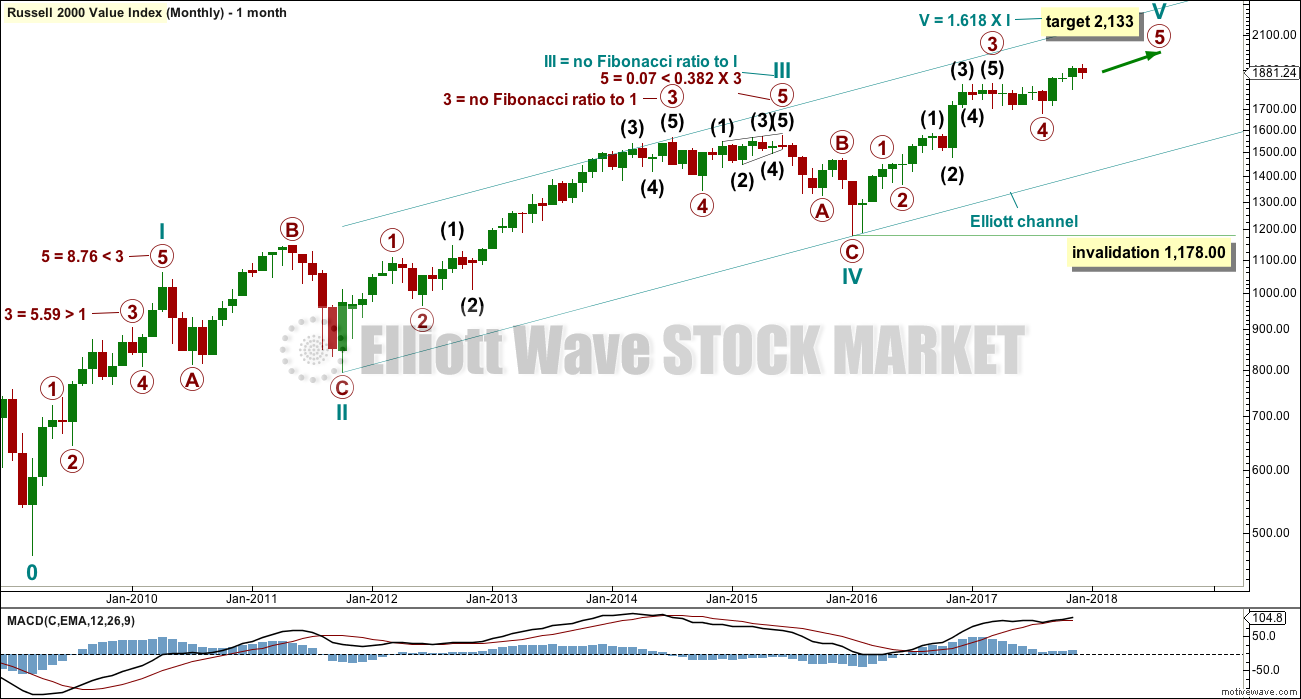
At this stage, within the impulse, waves I through to IV look to be complete.
Cycle wave V has passed equality in length with cycle wave I. The next Fibonacci ratio in the sequence is used to calculate the next likely target.
Along the way up, any deeper corrections should find support about the lower edge of the teal Elliott channel. A breach of that channel would indicate a trend change, possibly at Super Cycle degree, prior to invalidation.
Within cycle wave V, no second wave correction may move beyond the start of its first wave below 1,178.00.
WEEKLY CHART
Click chart to enlarge.
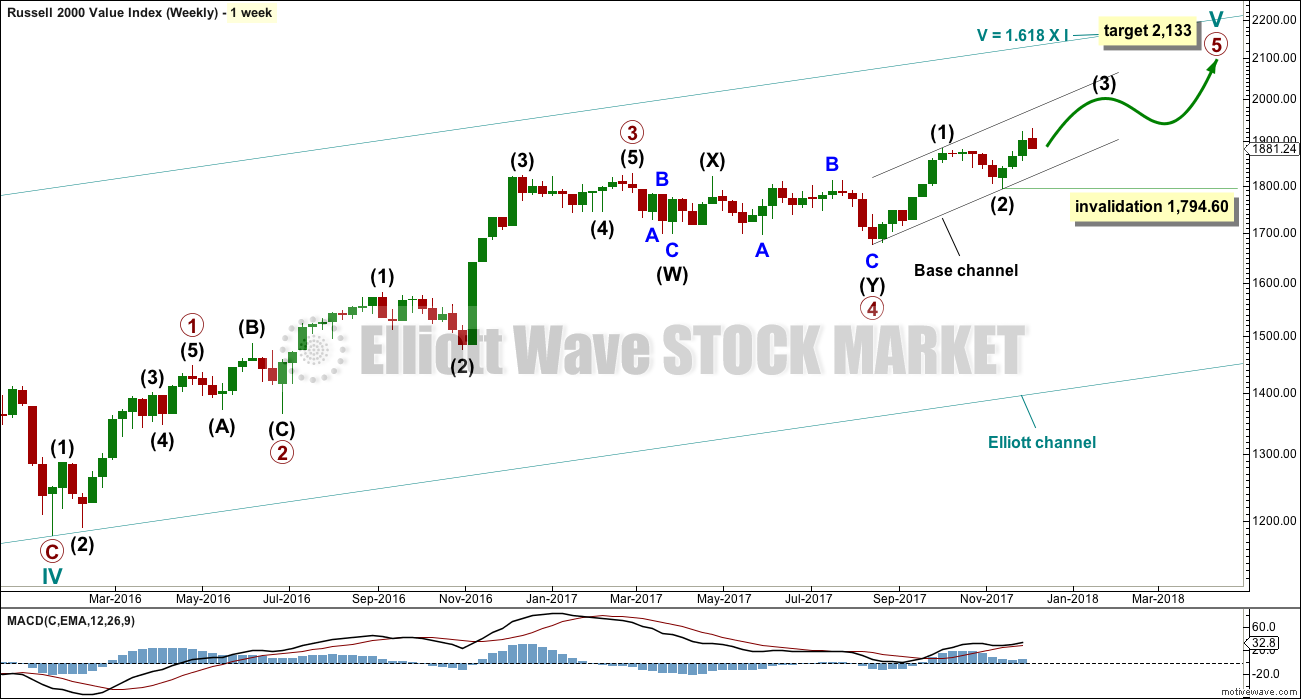
This weekly chart focuses only on cycle wave V. So far it looks like it is unfolding as the more common impulse. The other structural possibility, not considered here, would be an ending diagonal.
Apart from within primary wave 1, there are some remarkable Fibonacci ratios in this wave count.
At this stage, this wave count agrees with MACD: the fifth wave of primary wave 5 so far exhibits weaker momentum than primary wave 3, and the middle of primary wave 3 is the strongest upwards movement and agrees with the strongest portion of the histogram within primary wave 3.
Primary wave 5 looks like it may be unfolding also as an impulse. Within primary wave 5, intermediate waves (1) and (2) look to be complete. Within intermediate wave (3), no second wave correction may move beyond the start of its first wave below 1,794.60.
While primary wave 5 upwards continues, any deeper corrections should find strong support at the lower edge of the black base channel. If that channel is breached, then it would be possible that primary wave 5, and cycle wave V, could be over.
DAILY CHART
Click chart to enlarge.
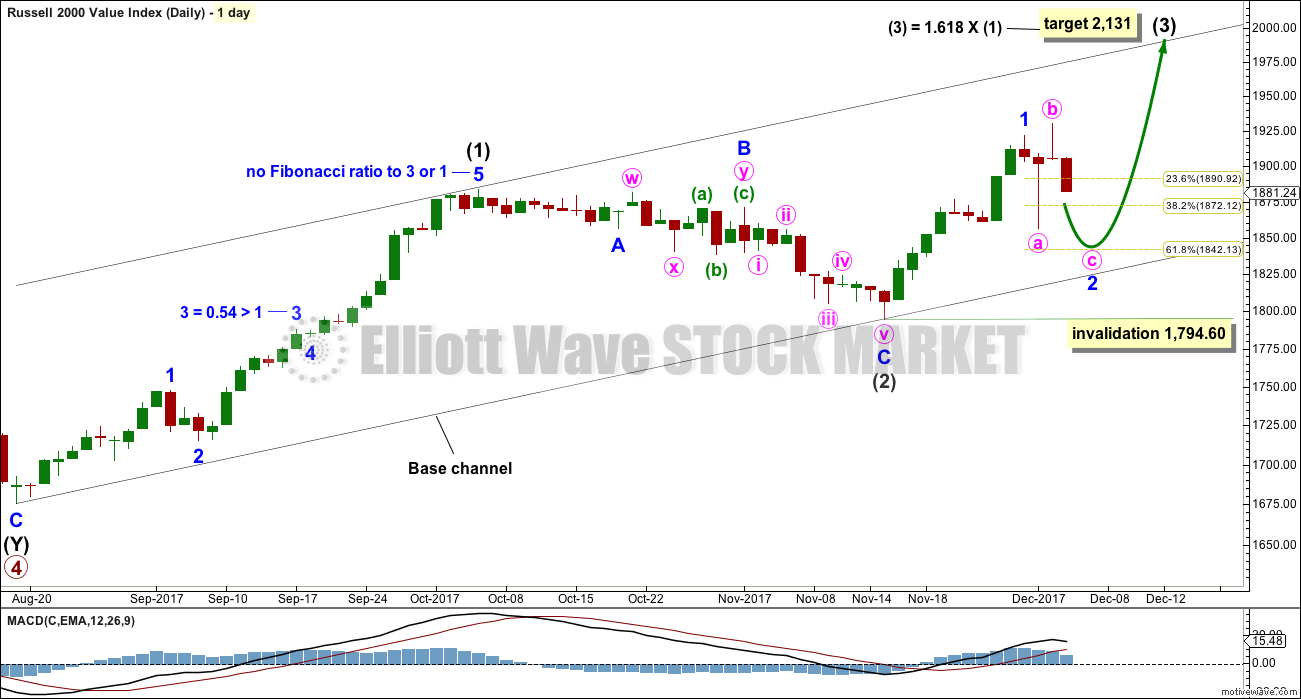
At this stage, intermediate wave (3) may be underway.
If this wave count is correct, then minor wave 2 should move lower. Minute wave c should move below the end of minute wave a at 1,856.30 to avoid a truncation and a very rare running flat. Minute wave c would be likely to end about the 0.618 Fibonacci ratio of minor wave 1 at 1,842.13.
Minor wave 2 may not move beyond the start of minor wave 1 below 1,794.60.
The target for intermediate wave (3) expects to see the most likely Fibonacci ratio to intermediate wave (1). This target is very close to the final target for cycle wave V. It may be that after intermediate wave (3) there could be a time consuming intermediate wave (4), and then a very short intermediate wave (5). This is possible given that fifth waves can be quite short and brief.
When intermediate waves (3) and (4) are complete, then the final target may be calculated at three degrees. At that stage, it may widen to a zone or change.
TECHNICAL ANALYSIS
MONTHLY CHART
Click chart to enlarge. Chart courtesy of StockCharts.com.
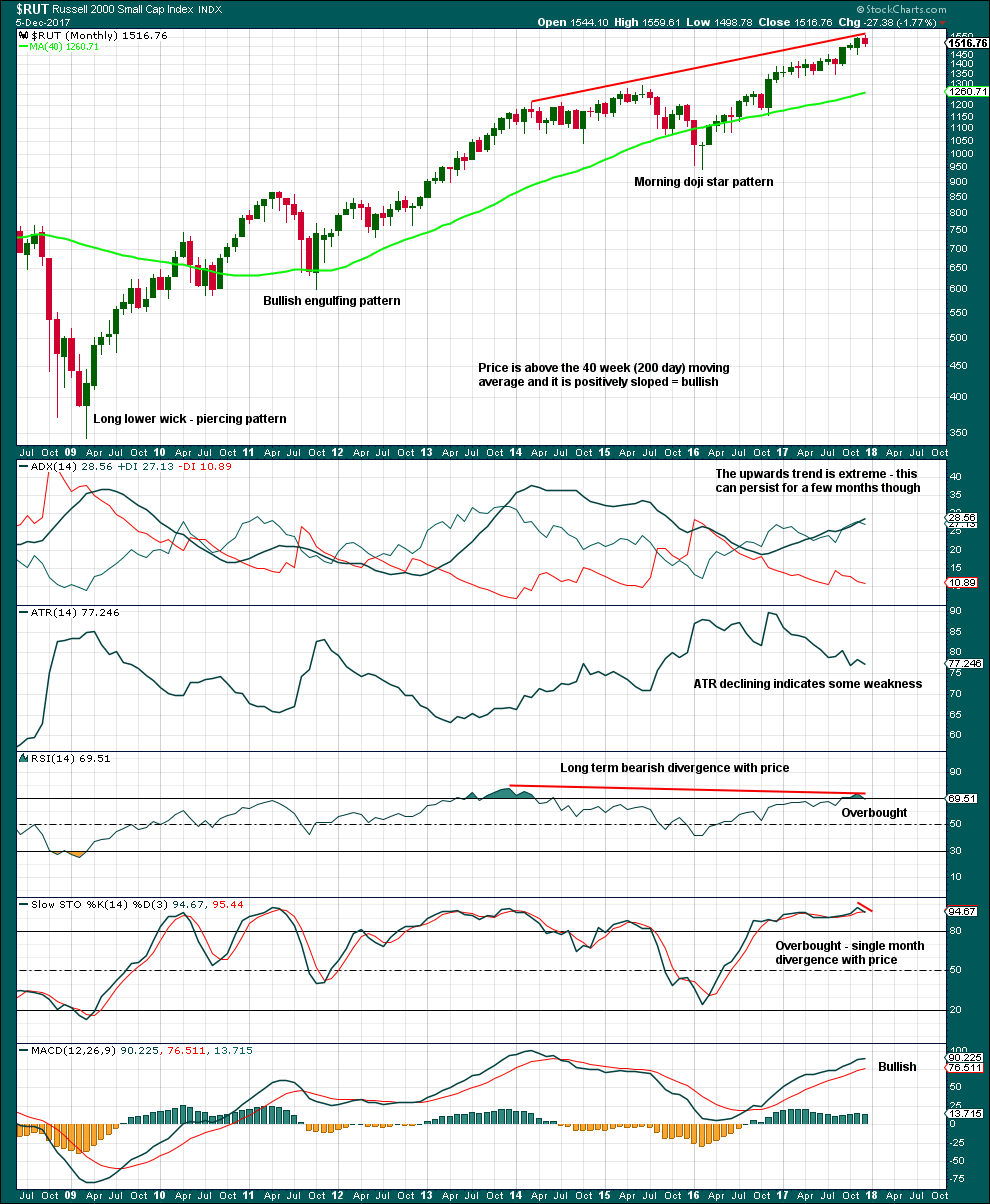
Unfortunately, StockCharts do not provide volume data for this index. As BarCharts also do not provide volume data, I am unable to use volume data and On Balance Volume. This hampers technical analysis substantially.
There is some long term weakness, but that cannot tell us when price may turn. Look for a bearish candlestick reversal pattern at highs. That is not yet in existence.
DAILY CHART
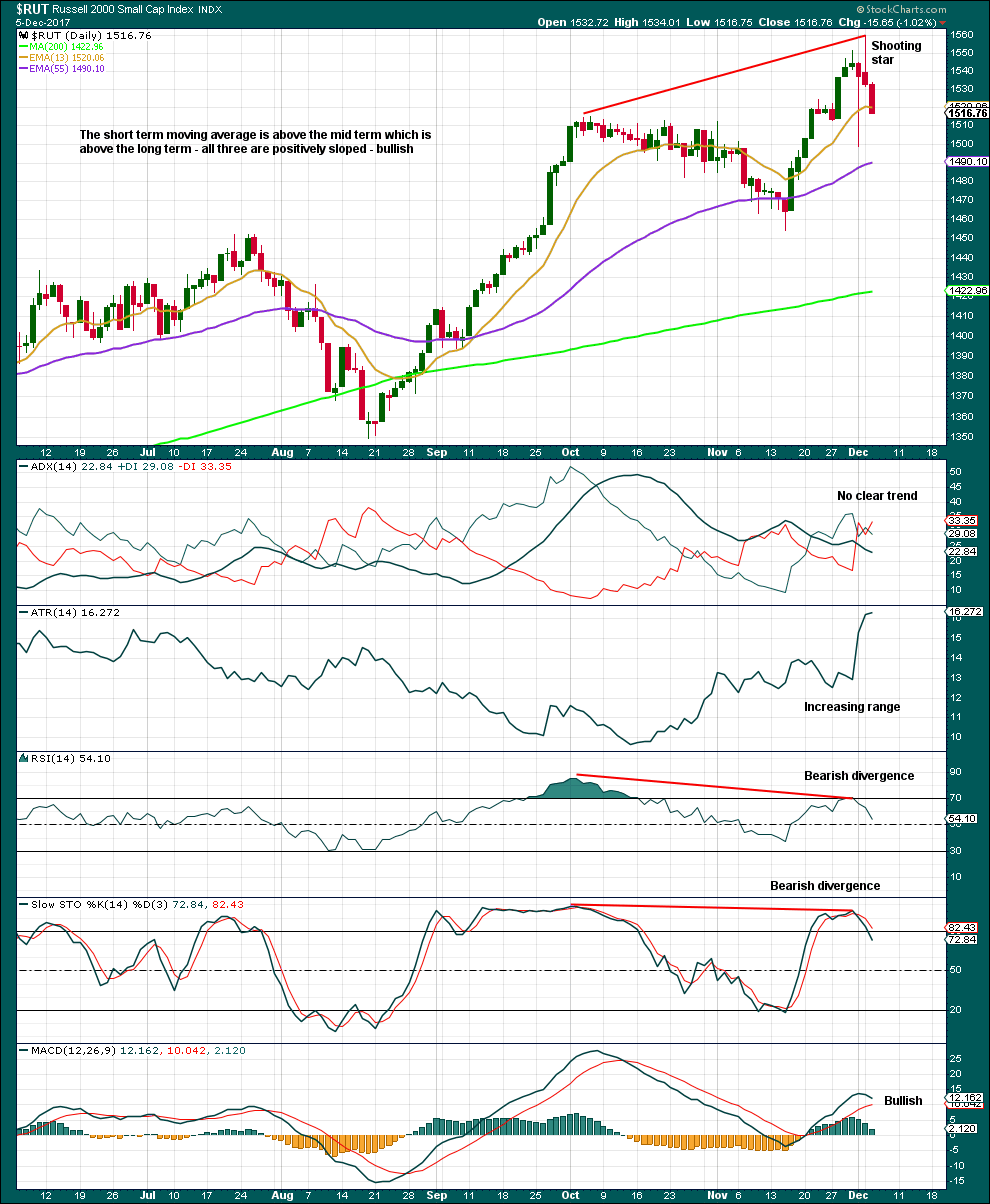
Click chart to enlarge. Chart courtesy of StockCharts.com.
From Nison regarding shooting stars:
“Since it is one session, it is usually not a major reversal signal as is the bearish engulfing pattern or evening star. Nor do I view the shooting star as pivotal resistance as I do with the two previous mentioned patterns.”
Weakness evident in bearish divergence in conjunction with this reversal signal may however be signalling a deeper or longer lasting correction to unfold about here. There is reasonable risk here to the downside. However, for that view to be dominant first a new swing low below 1,454.16 should be seen.
Published @ 02:15 a.m. EST.
Fantastic Lara, TY!!!
What is the reason you chose to analyze the RUJ, versus the RUT? I do realize they are very close to identical re: structure and daily moves, but the RUT seems to be where all volume is, and supports the most diverse ecology of ETF (long, short, leveraged).
That’s what BarChart provide. That or RUO. They didn’t have RUT.
Thanks for the analysis. It is helpful.