
Could the indicators and classic technical analysis used here at Elliott Wave Stock Market have warned of the last three major crashes of 1987, 2000 and 2007?
1987
WEEKLY CHART
Click chart to enlarge.
A candlestick pattern at the high offered the first warning of a trend change.
Moving averages are lagging indicators. They offered no warning at the high. They only caught up with the crash after the low; in November 1987 they were full bore bearish.
ADX gave no warning.
RSI offered a strong warning with double bearish divergence while overbought.
Stochastics offered a weak warning.
MACD was fully bullish at the high.
Volume data is unavailable for this time period from StockCharts.
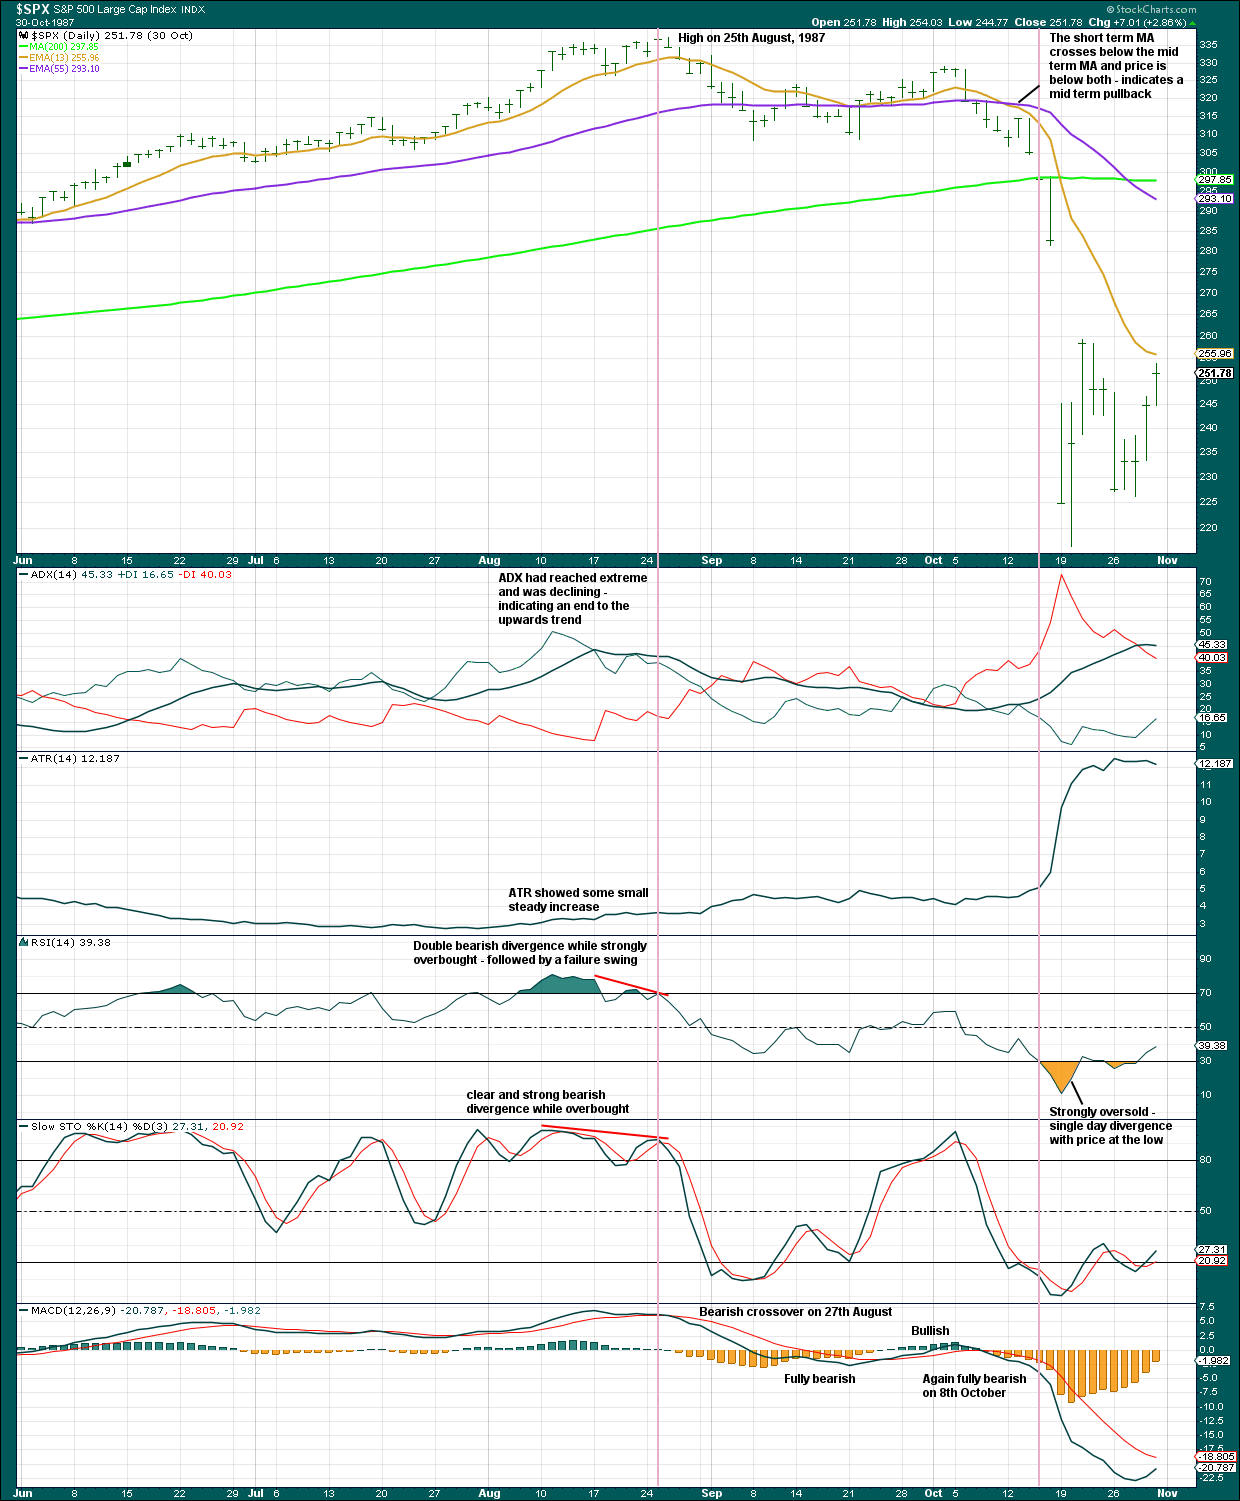
DAILY CHART
Click chart to enlarge.
Moving averages were fully bullish at the high. This changed on the 13th of October to a mid term pullback, and finally on the 28th of October they were fully bearish.
ADX at the daily chart level did offer an early warning of an extreme upwards trend susceptible to a pullback.
RSI offered a reasonable warning of a high in place, as did Stochastics.
MACD gave a bearish crossover on the 27th of August, and was fully bearish by 15th of September.
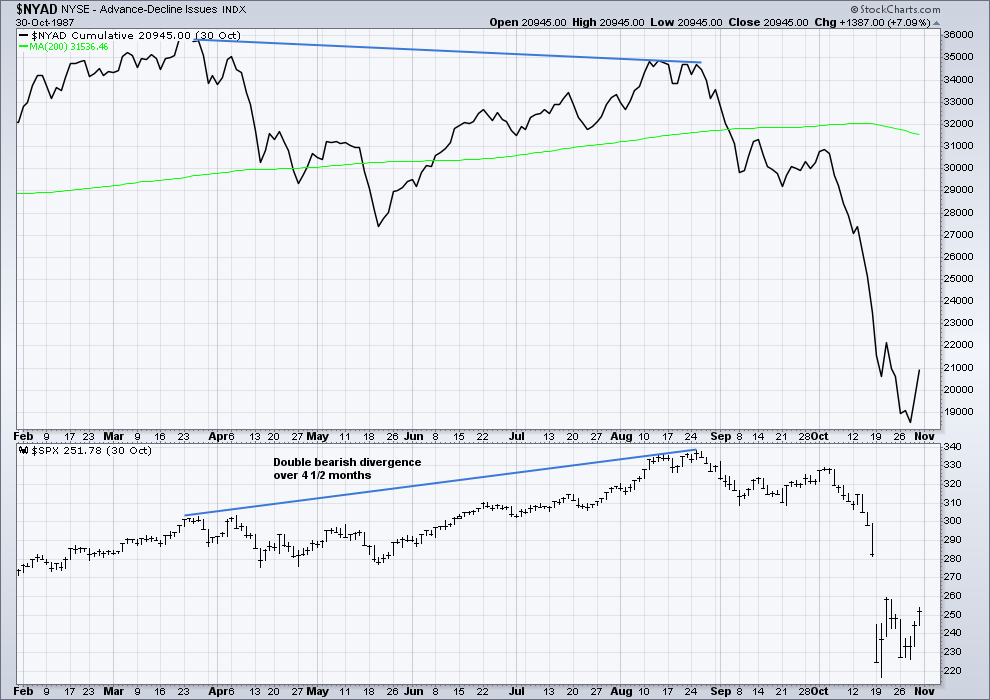
AD LINE
Click chart to enlarge.
The AD line did offer a strong warning, with over 4 months of clear bearish divergence. Double divergence developed just before the high.
2000
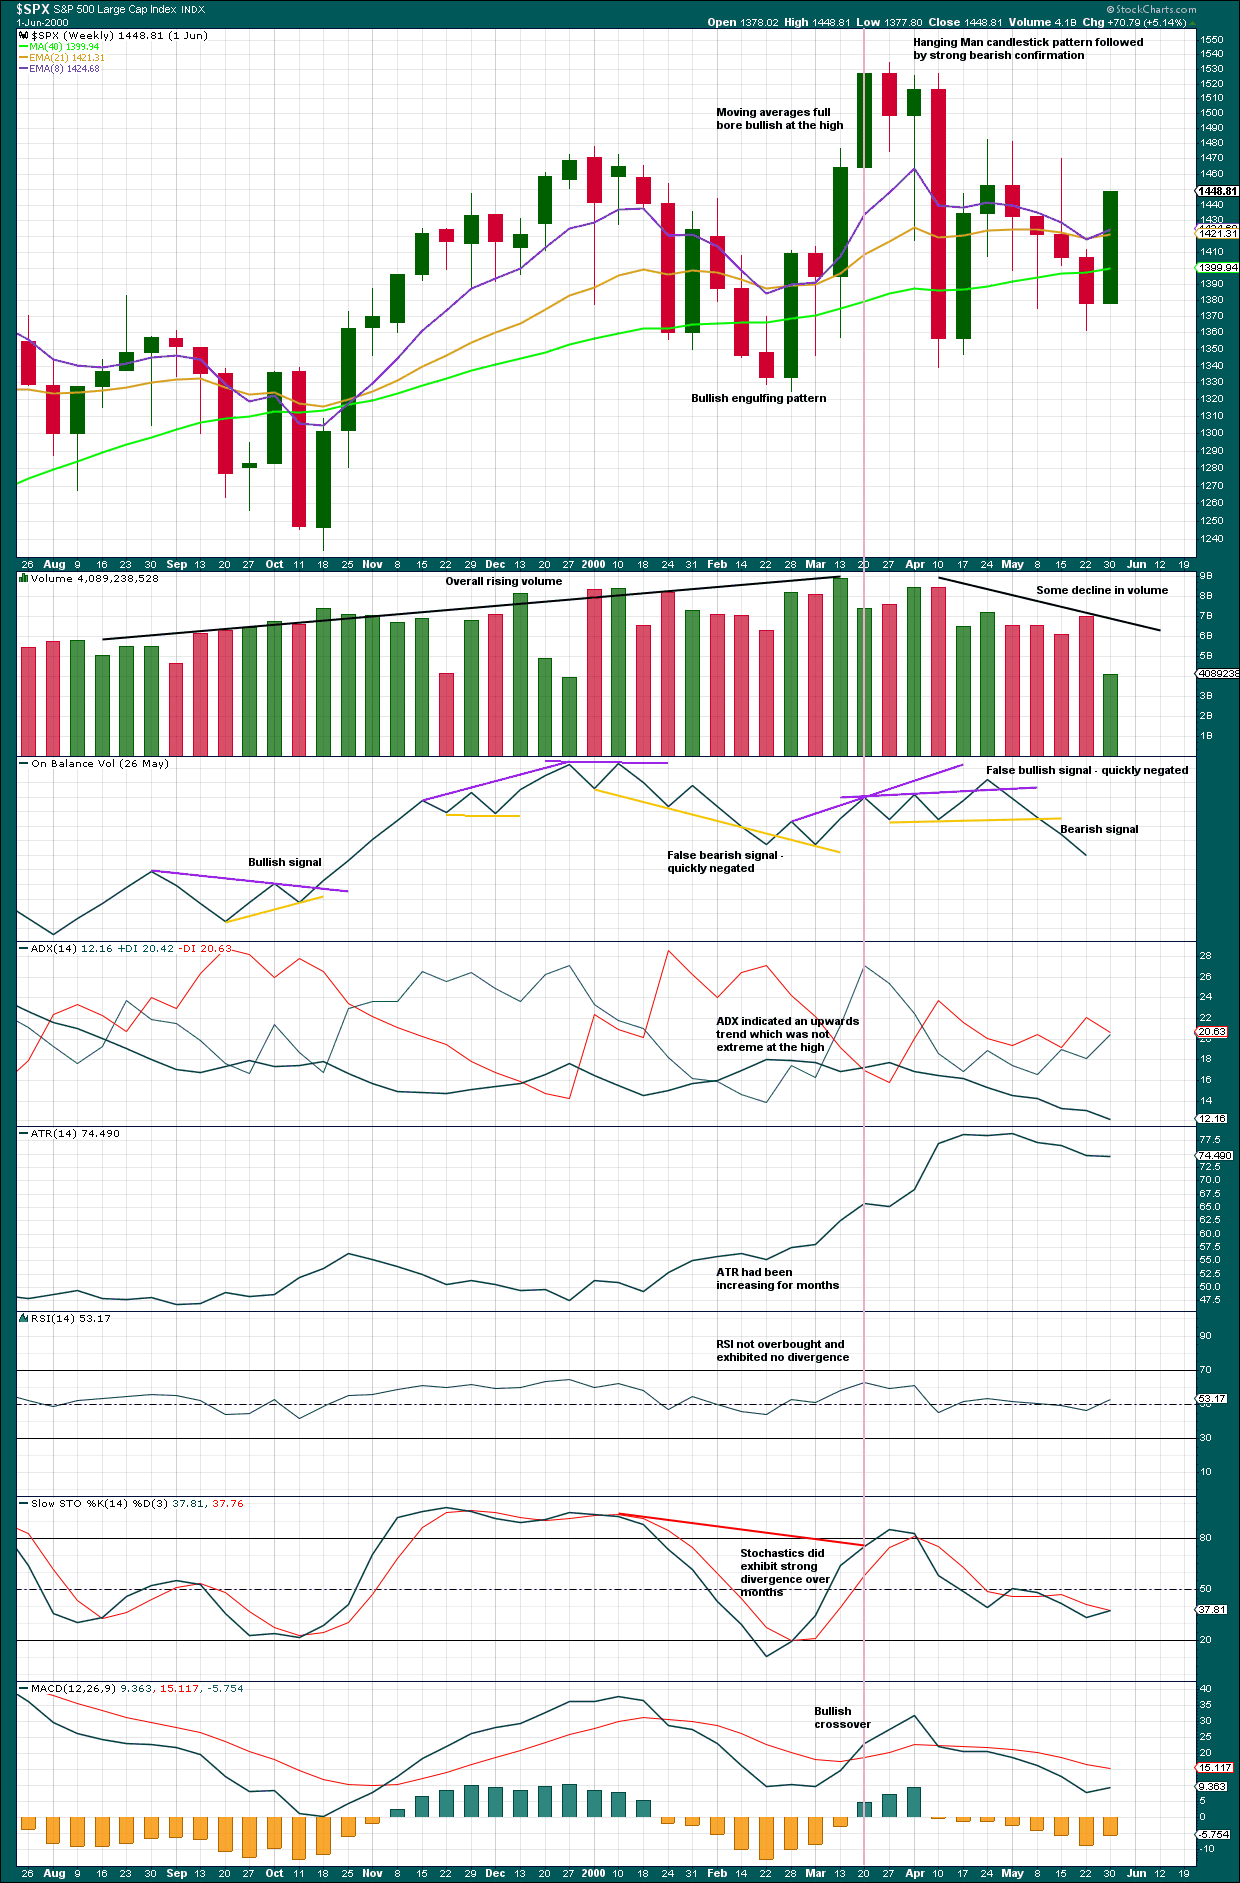
WEEKLY CHART
Click chart to enlarge.
For later data, volume data is also available.
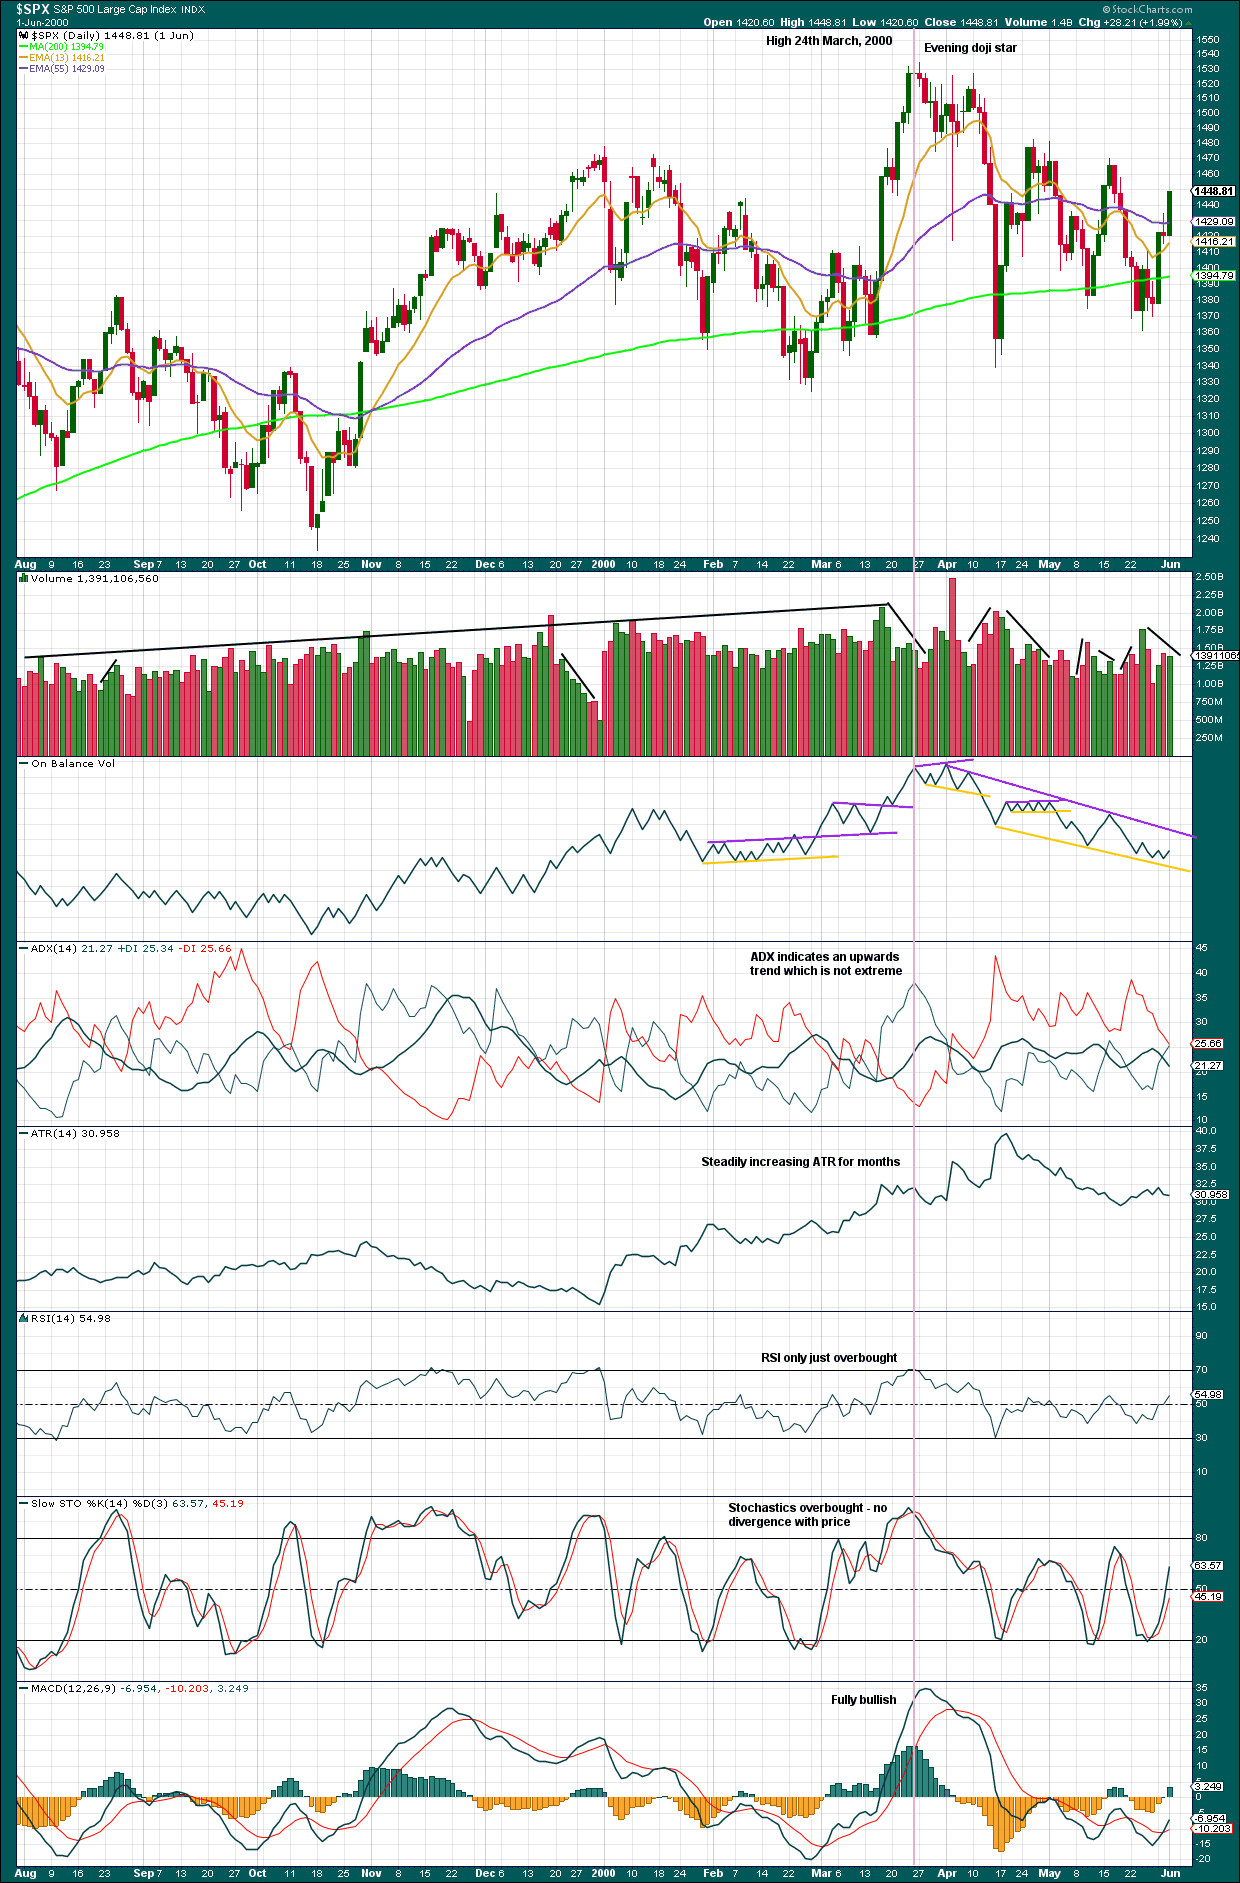
A strong bearish candlestick reversal pattern was seen at the high.
Volume offered no warning. The first bearish signal from On Balance Volume came in mid March.
At the high, in March 2000, moving averages were fully bullish.
ADX offered no warning. ATR offered no warning.
Not only did RSI not offer any warning, it indicated there was room for price to rise.
Stochastics did offer a warning with bearish divergence.
MACD was fully bullish at the high.
DAILY CHART
Click chart to enlarge.
A candlestick reversal pattern was given at the daily chart level as well as the weekly.
The first bearish signal from On Balance Volume came on the 12th of April.
ADX and ATR offered no warning. RSI showed very weak bearish divergence and was not overbought at the high.
Stochastics offered no warning. MACD was fully bullish.
By the 13th of April, bearish signals came from: On Balance Volume, MACD, ADX and rising volume with falling price.
AD LINE
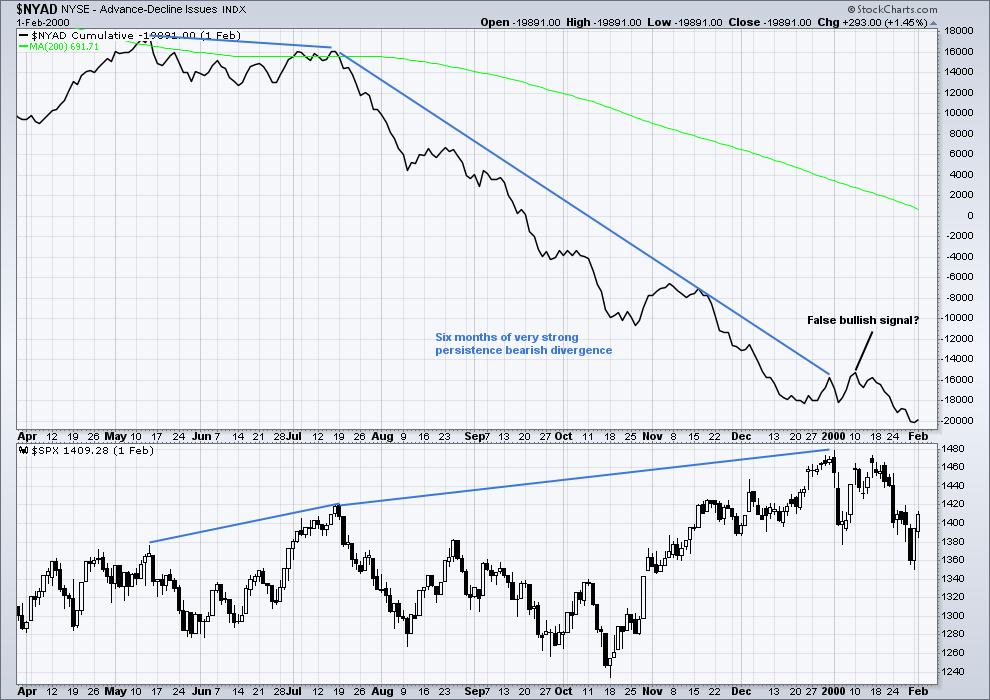
Click chart to enlarge.
Of all three examples looked at in this article, the strong and persistent divergence between price and the AD line in March 2000 is the most striking. This would have been a very strong warning that something big to the downside may be brewing.
2007
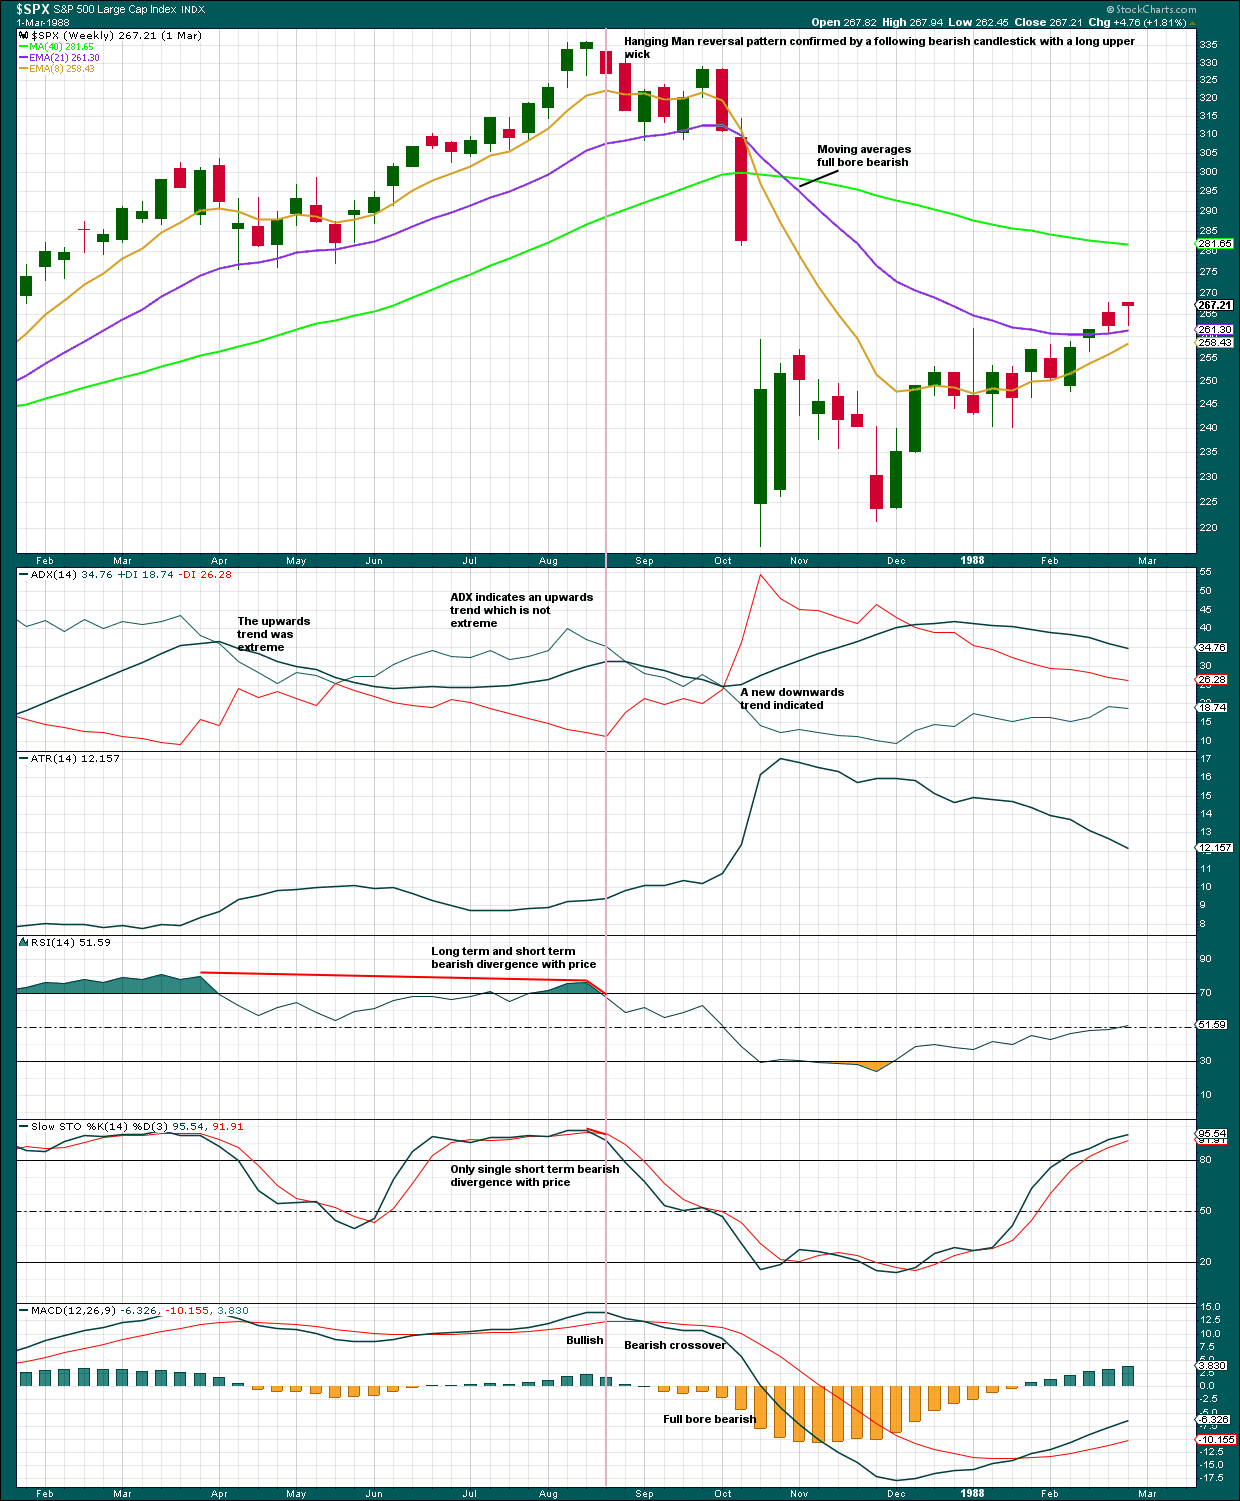
WEEKLY CHART
Click chart to enlarge.
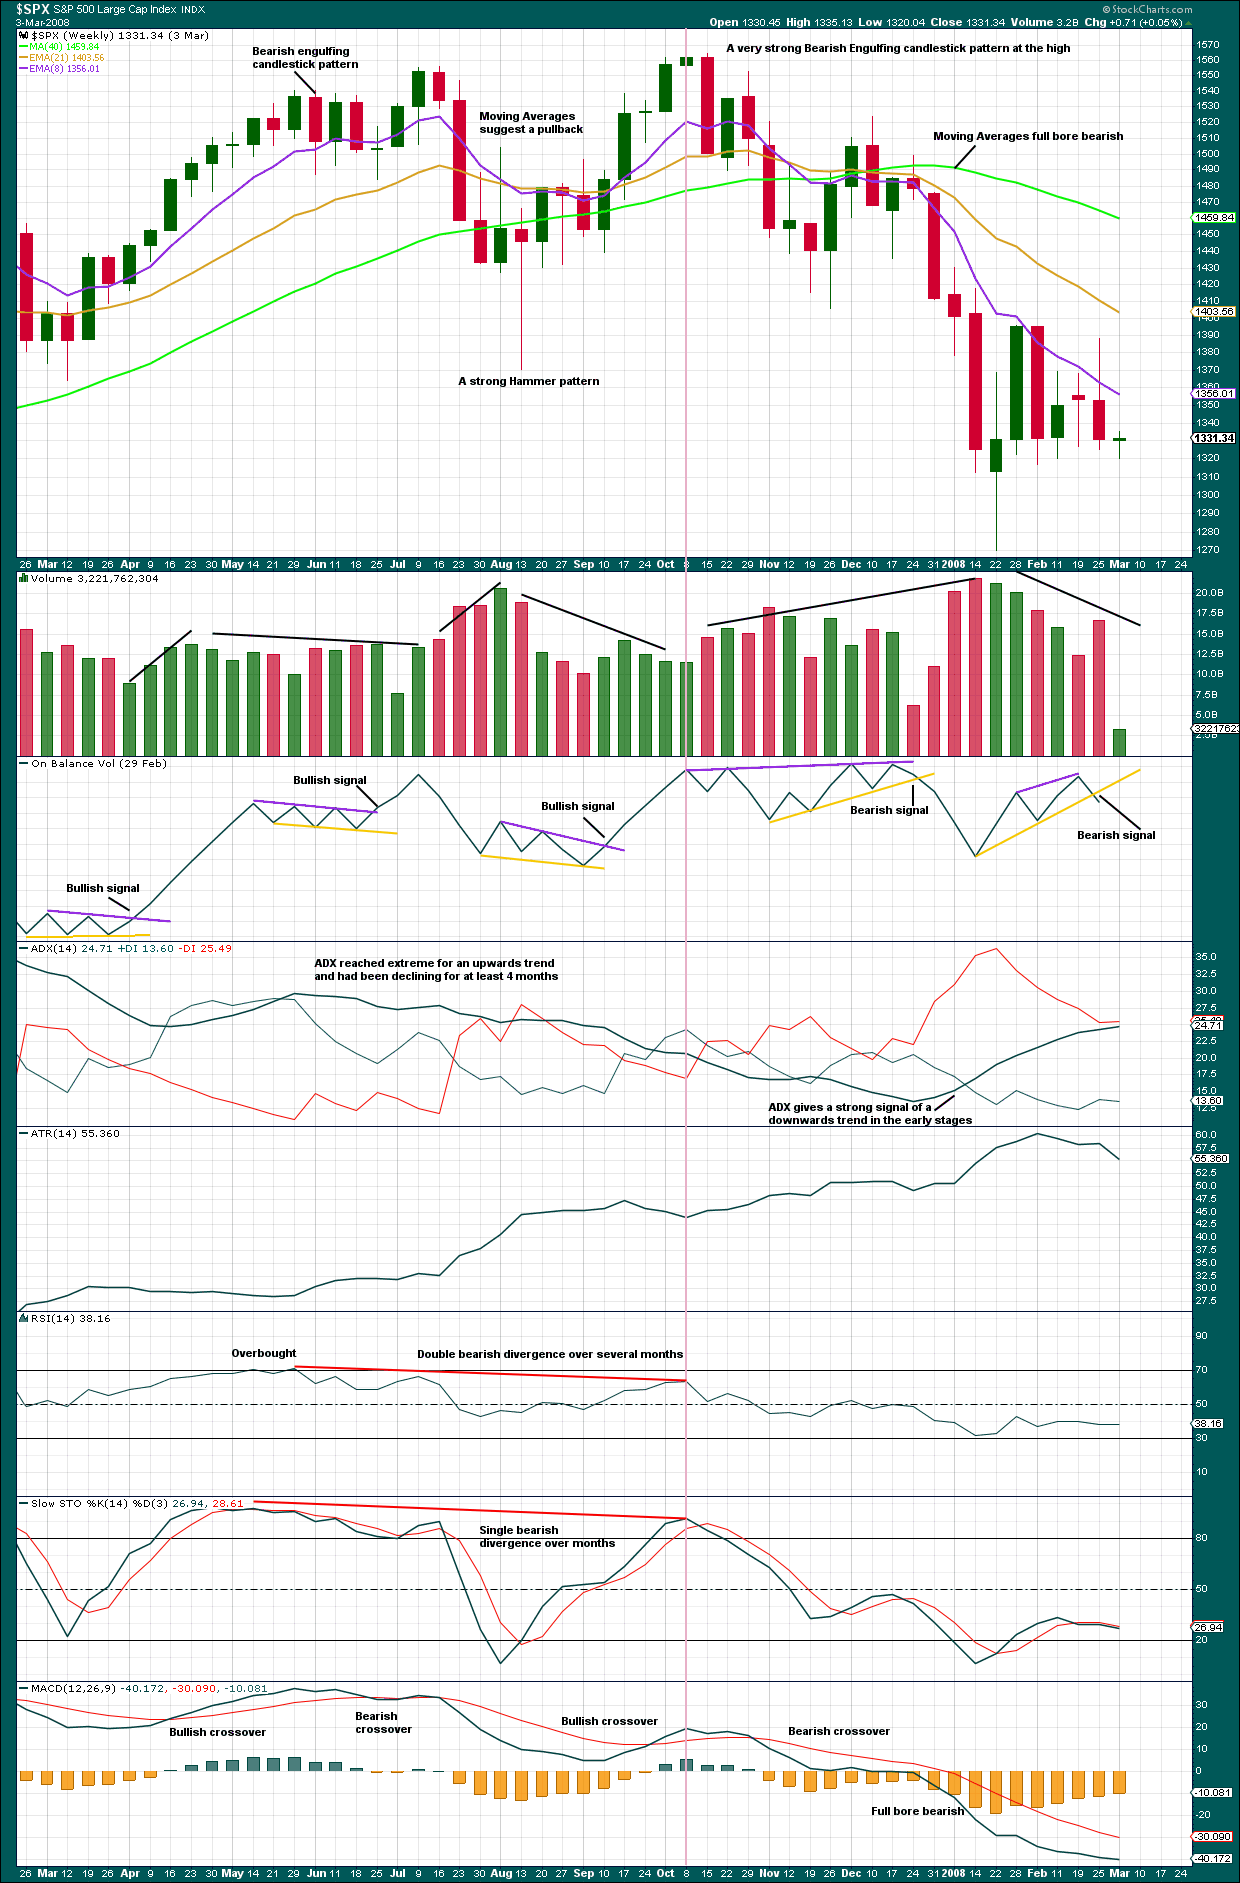
A very strong Bearish Engulfing pattern at the high offered some warning.
Volume offered a small warning as it declined up to the high in October 2007. On Balance Volume offered no warning; its first bearish signal came at the end of December 2007.
ADX offered some reasonable warning as it had been extreme for a long time prior to the high, and then had declined as price moved higher.
RSI offered a warning with long term bearish divergence.
Stochastics also offered a warning with single bearish divergence.
MACD was fully bullish at the high and only became fully bearish at the end of December 2007.
DAILY CHART
Click chart to enlarge.
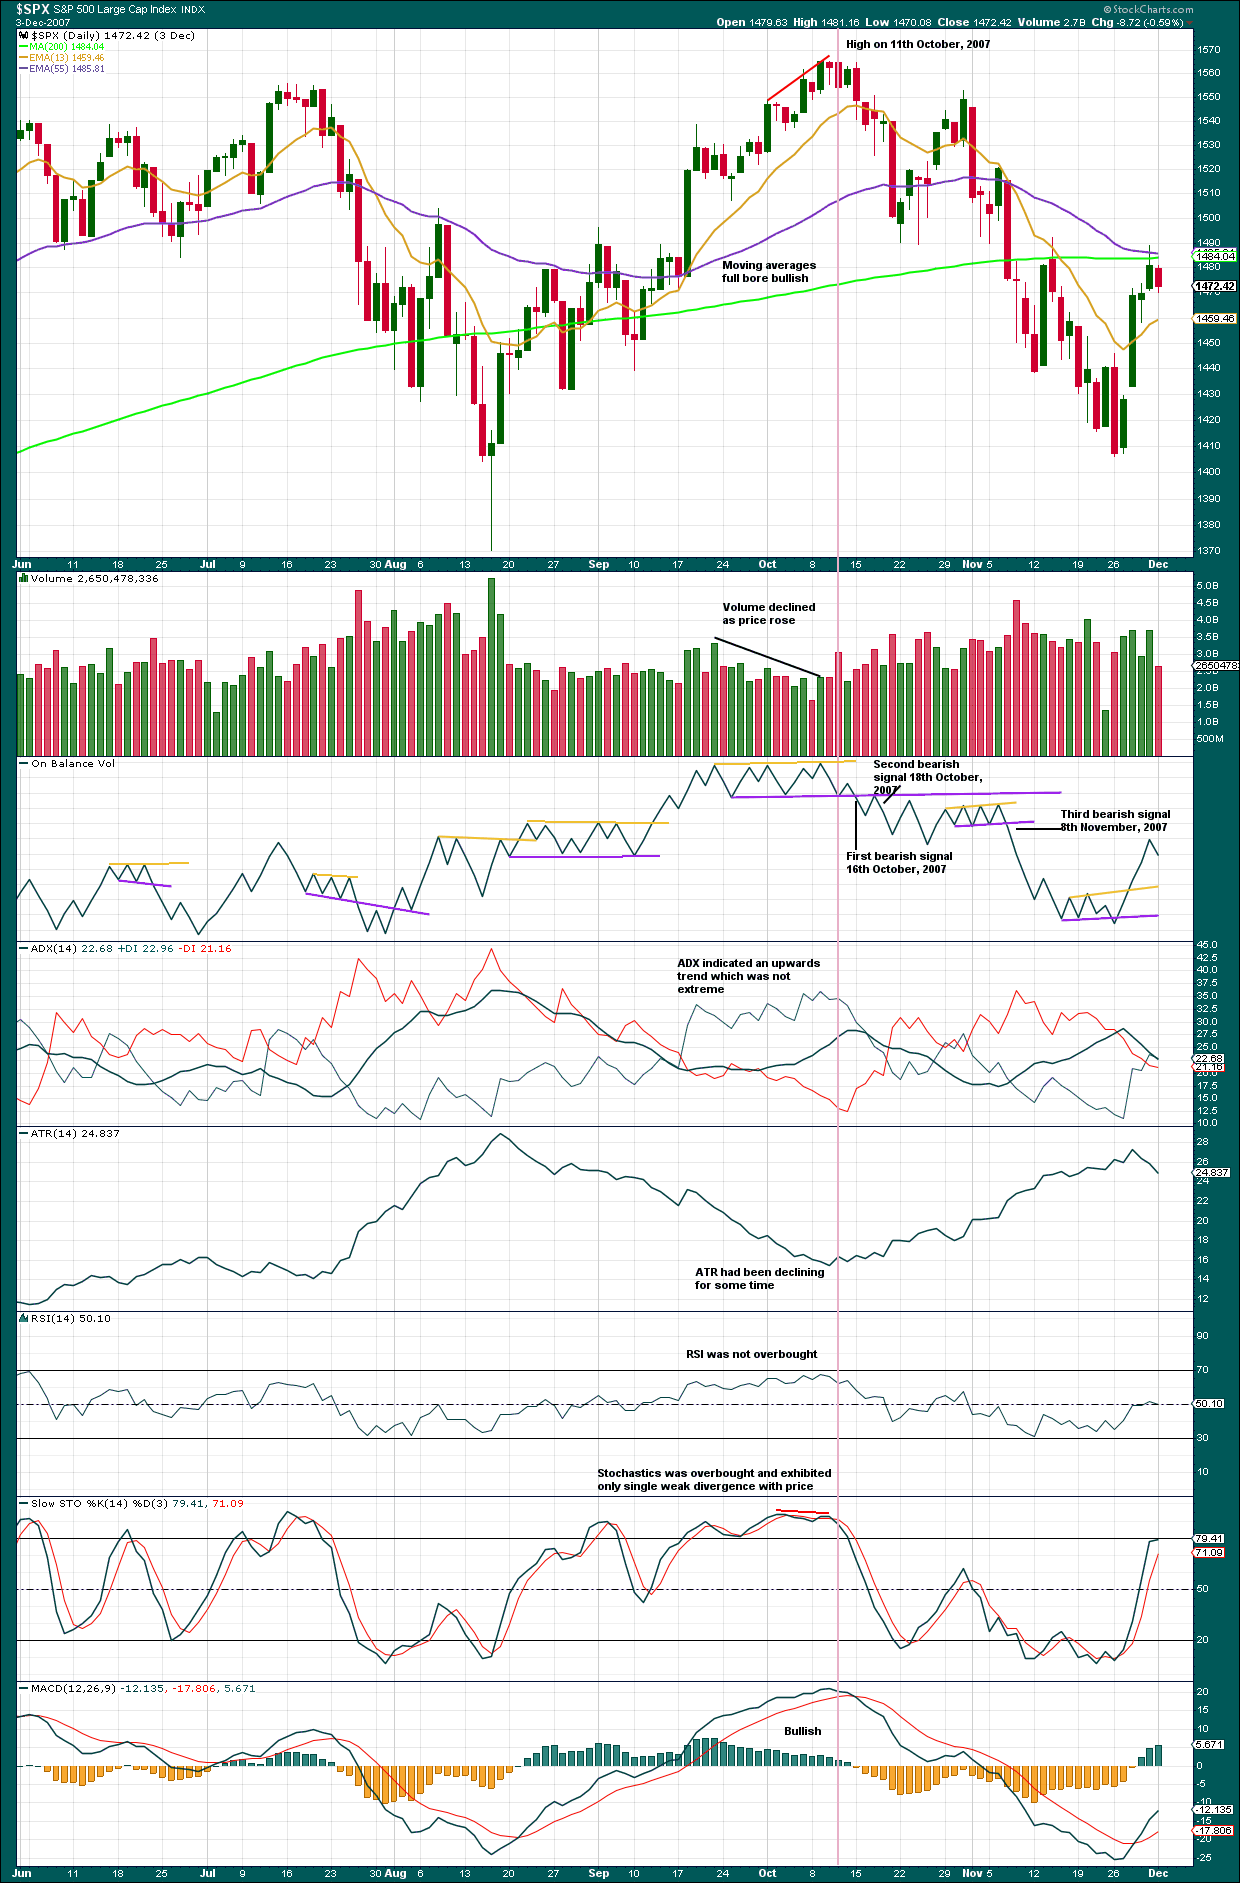
Moving averages offered no warning. Volume did offer some warning as it declined towards the final high.
On Balance Volume did not offer a warning prior to the high, but it did give a bearish signal very soon after on the 15th of October, 2007. This was followed by two more bearish signals shortly after, noted on the chart.
ADX offered no warning.
ATR offered some warning as it declined towards the final high.
RSI offered no warning. Stochastics offered only a weak bearish warning.
MACD was fully bullish.
AD LINE
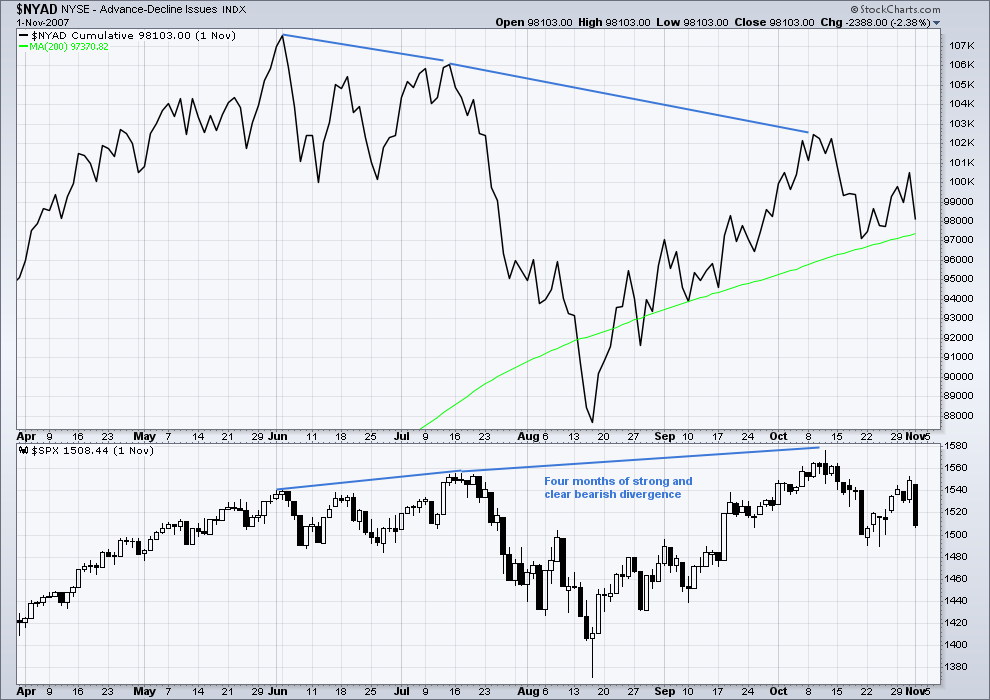
Click chart to enlarge.
The AD line again offered a very strong warning, with clear and strong divergence over 4 months.
CONCLUSION
Markets do not repeat, but they do rhyme.
In each of these examples of price approaching a final high prior to a large bear market, only the AD line was consistent in offering a warning each time. That does not mean it must do so prior to a future bear market, only that the probability of it doing so again for at least 4 months is high.
The other indicator which appears to more consistently offer a warning shortly after a high is On Balance Volume.
The current bull market today has no divergence with the AD line, and no bearish signals at all from any of the indicators studied here. That points to a very low probability of a bear market developing in the next few months.
Published @ 3:26 a.m. EST on 27th October, 2017.
Awesome analysis. Very timely, and very much needed! All these prognostications of immanent doom and “prepare now” were getting to me. Having clear and objective tools for assessing bear market initiation risk levels is incredibly valuable!
Hi Lara ,
Thanks for this – very interesting.
I could not see the March 2000 divergence in the AD line for the 2000 case as I think your chart finishes in Feb?
Does this lack of divergence in the current market suggest that this current correction is more likely to be a minor 4?
Oh goodness, you’re absolutely right Nick! Thank you so much for pointing it out, and my apologies for such an awful mistake.
Here’s an updated chart for the AD line divergence prior to the March 2000 high. There was actually ten months of divergence, not six.
So that’s interesting. It tells us that the 4-6 months advised by Lowry’s can actually be exceeded, and not by just a very little, buy a reasonable amount.