Another day of downwards movement was expected from the Elliott wave count and from classic technical analysis.
Summary: A deeper pullback may have arrived. It may last about one to three months and may end either 2,368 – 2,353 or 2,282 – 2,234. A new low below 2,277.53 would indicate the lower target range should be used.
New updates to this analysis are in bold.
Last monthly and weekly charts are here. Last historic analysis video is here.
MAIN ELLIOTT WAVE COUNT
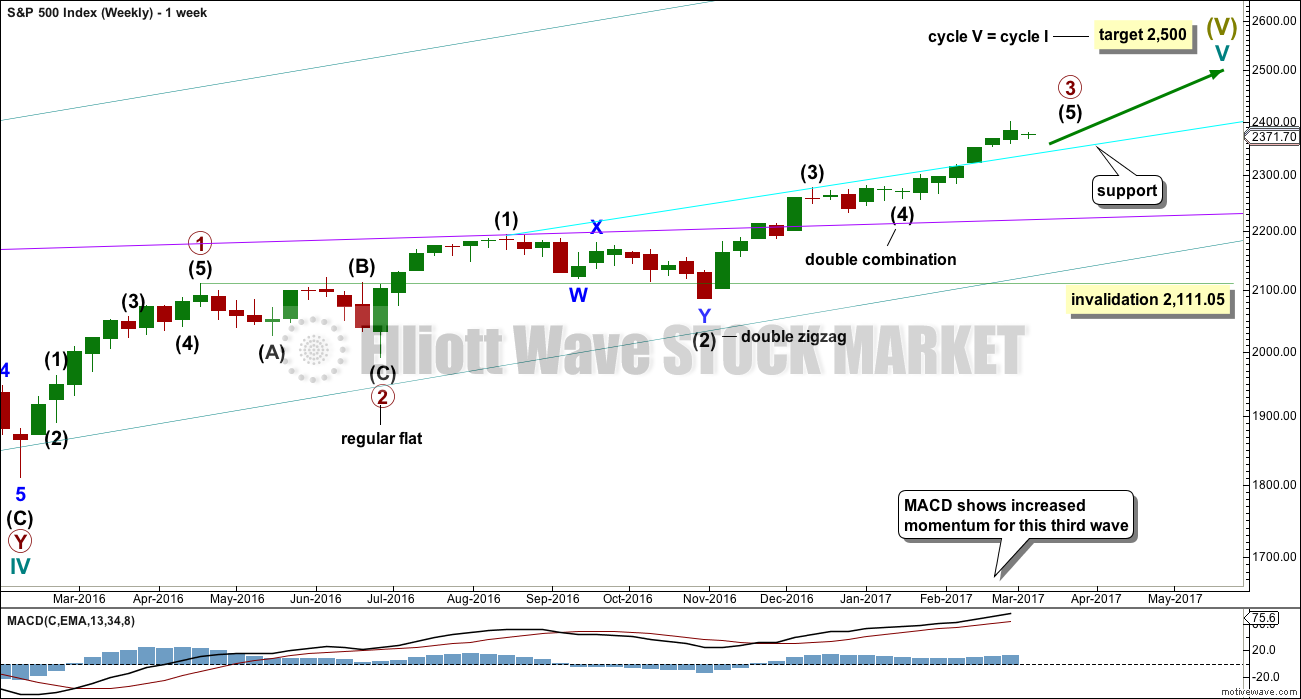
WEEKLY CHART
Cycle wave V is an incomplete structure. Within cycle wave V, primary wave 3 may now be complete.
Primary wave 4 may not move into primary wave 1 price territory below 2,111.05.
Primary wave 2 was a flat correction lasting 47 days (not a Fibonacci number). Primary wave 4 may be expected to most likely be a zigzag, but it may also be a triangle if its structure exhibits alternation. If it is a zigzag, it may be more brief than primary wave 2, so a Fibonacci 21 sessions may be the initial expectation. If it is a triangle, then it may be a Fibonacci 34 or 55 sessions.
A new low below 2,277.53 would invalidate the daily alternate wave count below and provide confidence that the pullback is at primary degree.
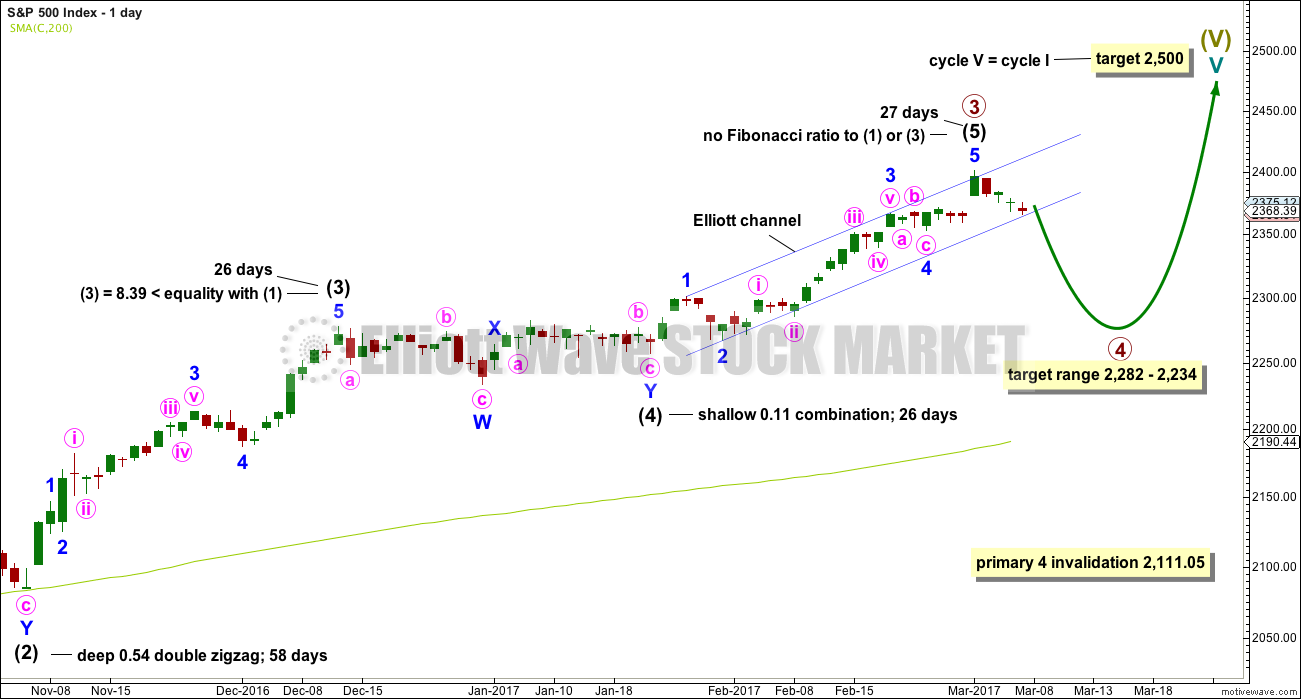
DAILY CHART
Intermediate wave (3) is shorter than intermediate wave (1). One of the core Elliott wave rules states a third wave may never be the shortest wave, so this limits intermediate wave (5) to no longer than equality in length with intermediate wave (3). If intermediate wave (5) is now over, then this rule is met.
Minor wave 3 has no Fibonacci ratio to minor wave 1. If minor wave 5 is now over, then it is 4.14 points longer than equality in length with minor wave 3. So far price remains within the blue Elliott channel. If price can break below support at the lower edge of this channel, then further confidence in a multi week pullback may be had.
Intermediate wave (5) may have ended in 27 days, just one longer than intermediate waves (3) and (4). This gives the wave count good proportions.
The proportion here between intermediate waves (2) and (4) is acceptable. There is alternation. Both are labelled W-X-Y, but double zigzags are quite different structures to double combinations.
The following correction for primary wave 4 should be a multi week pullback, and it may not move into primary wave 1 price territory below 2,111.05.
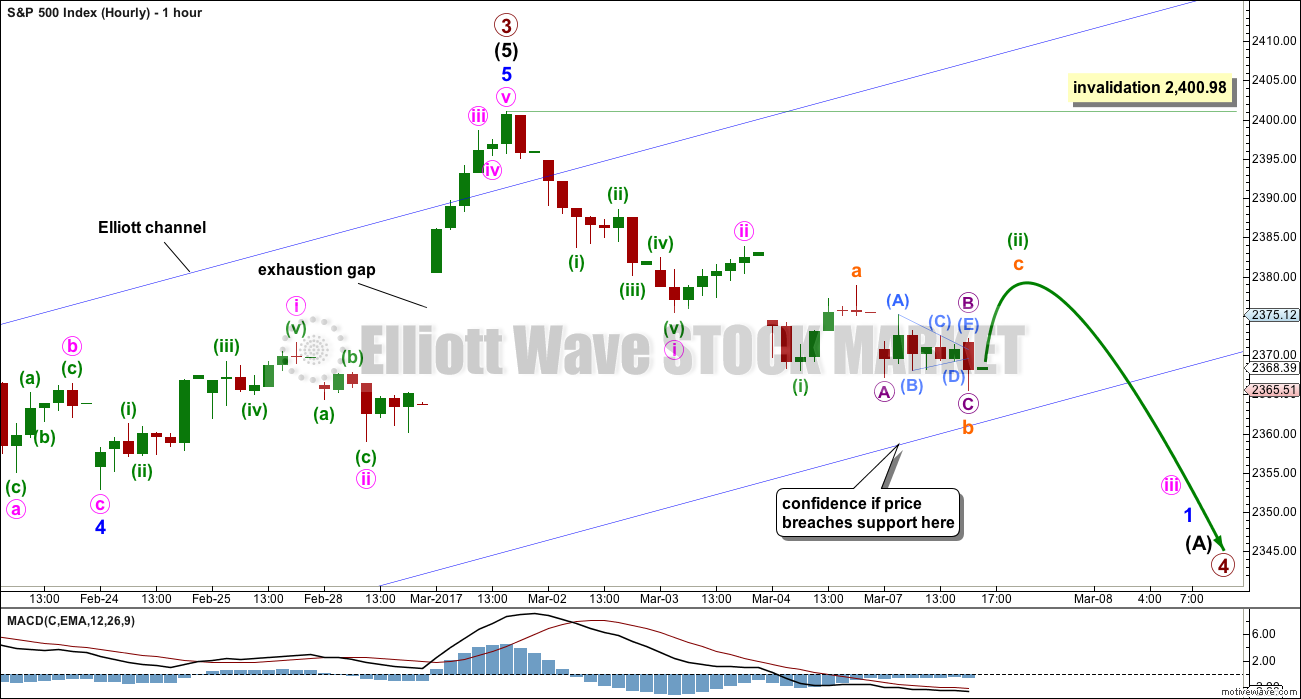
HOURLY CHART
The last gap is now closed, so it is correctly named an exhaustion gap.
A new wave down at primary degree should begin with a five down on the hourly and daily chart levels. This is incomplete. During the first five down, no second wave correction may move beyond the start of its first wave above 2,400.98.
Watch the lower edge of the blue Elliott channel carefully again tomorrow. It may offer some support. If price breaks below it, then look out for a throw back to find resistance at the lower edge of the channel. If price behaves like that, it would offer a good entry point to join a new short term downwards trend for aggressive traders.
Less aggressive traders may choose to patiently wait for this correction to end before entering long. The larger trend is still upwards and this is expected to be a counter trend movement.
Always remember my two Golden Rules:
1. Always use a stop.
2. Do not invest more than 1-5% of equity on any one trade.
There is more than one way now to label this downwards movement. Minute wave ii may be over as a brief shallow zigzag as labelled, or it may be continuing further as a deeper expanded flat. For this reason the invalidation point is left at the start of minute wave i today.
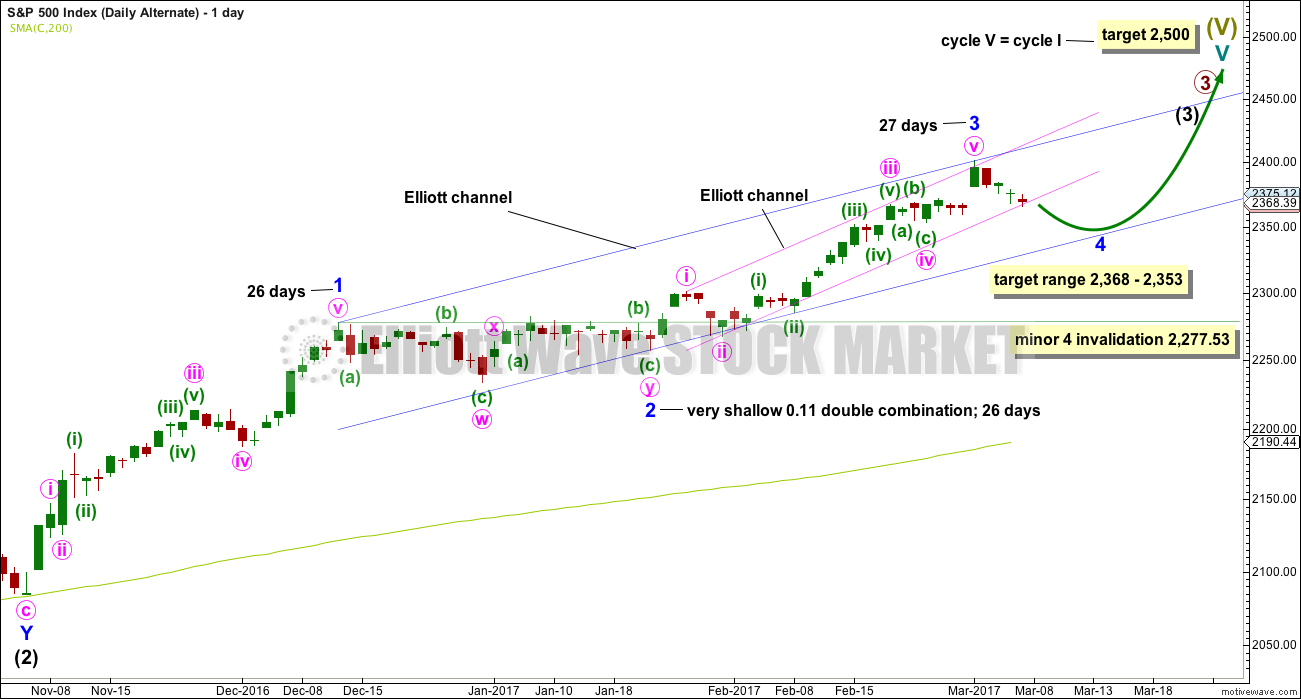
ALTERNATE DAILY CHART
What if recent strong upwards movement was the middle a third wave at three degrees? This is supported by a fairly bullish look for the classic technical analysis chart.
All subdivisions are seen in exactly the same way for both daily wave counts, only here the degree of labelling within intermediate wave (3) is moved down one degree.
This alternate also expects a correction, but for minor wave 4, that may not move into minor wave 1 price territory below 2,277.53. A new low below this point would confirm the correction could not be minor wave 4 and that would provide confidence it should be primary wave 4.
Minor wave 4 may last about 26 days if it is even in duration with minor waves 1, 2 and 3. That would give the wave count good proportions and the right look.
Minor wave 4 may end within the price territory of the fourth wave of one lesser degree about 2,368 to 2,353.
So far downwards movement remains within the smaller pink Elliott channel about minor wave 5. Price needs to break below the lower edge of this channel to add confidence that a multi week pullback has arrived. This wave count would then expect choppy overlapping movement to find support at the wider blue Elliott channel.
Both wave counts expect essentially the same direction next, so the hourly chart for this alternate would look the same with the exception of the degree of labelling.
TECHNICAL ANALYSIS
WEEKLY CHART
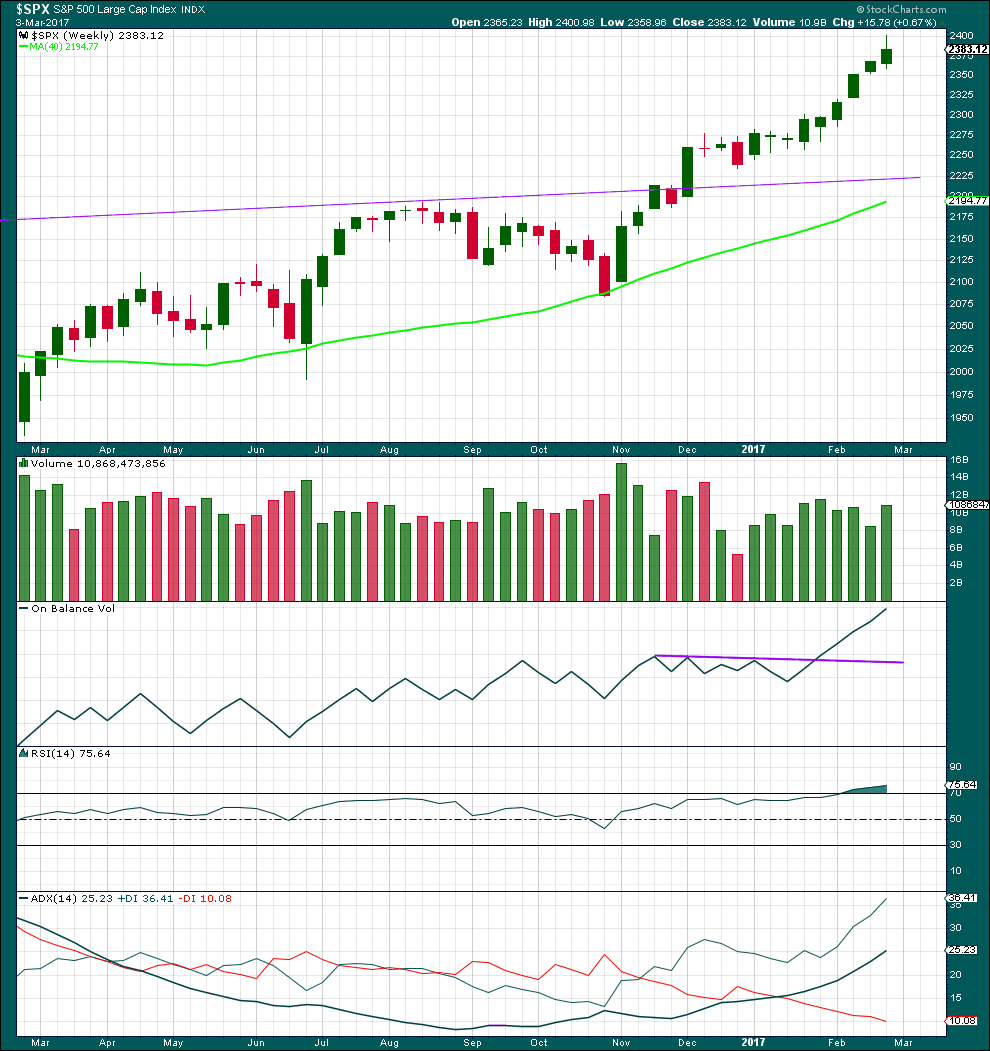
Click chart to enlarge. Chart courtesy of StockCharts.com.
There are now nine green weekly candlesticks in a row. A larger correction may be expected soon.
Volume last week is stronger than the three weeks prior. There was good support last week for upwards movement.
On Balance Volume remains very bullish.
RSI is overbought, but in a bull market this can remain extreme for a reasonable period of time. If it begins to exhibit divergence with price at the weekly chart level, then a larger correction may be expected to begin. There is no divergence at this time.
This trend is not yet extreme.
DAILY CHART
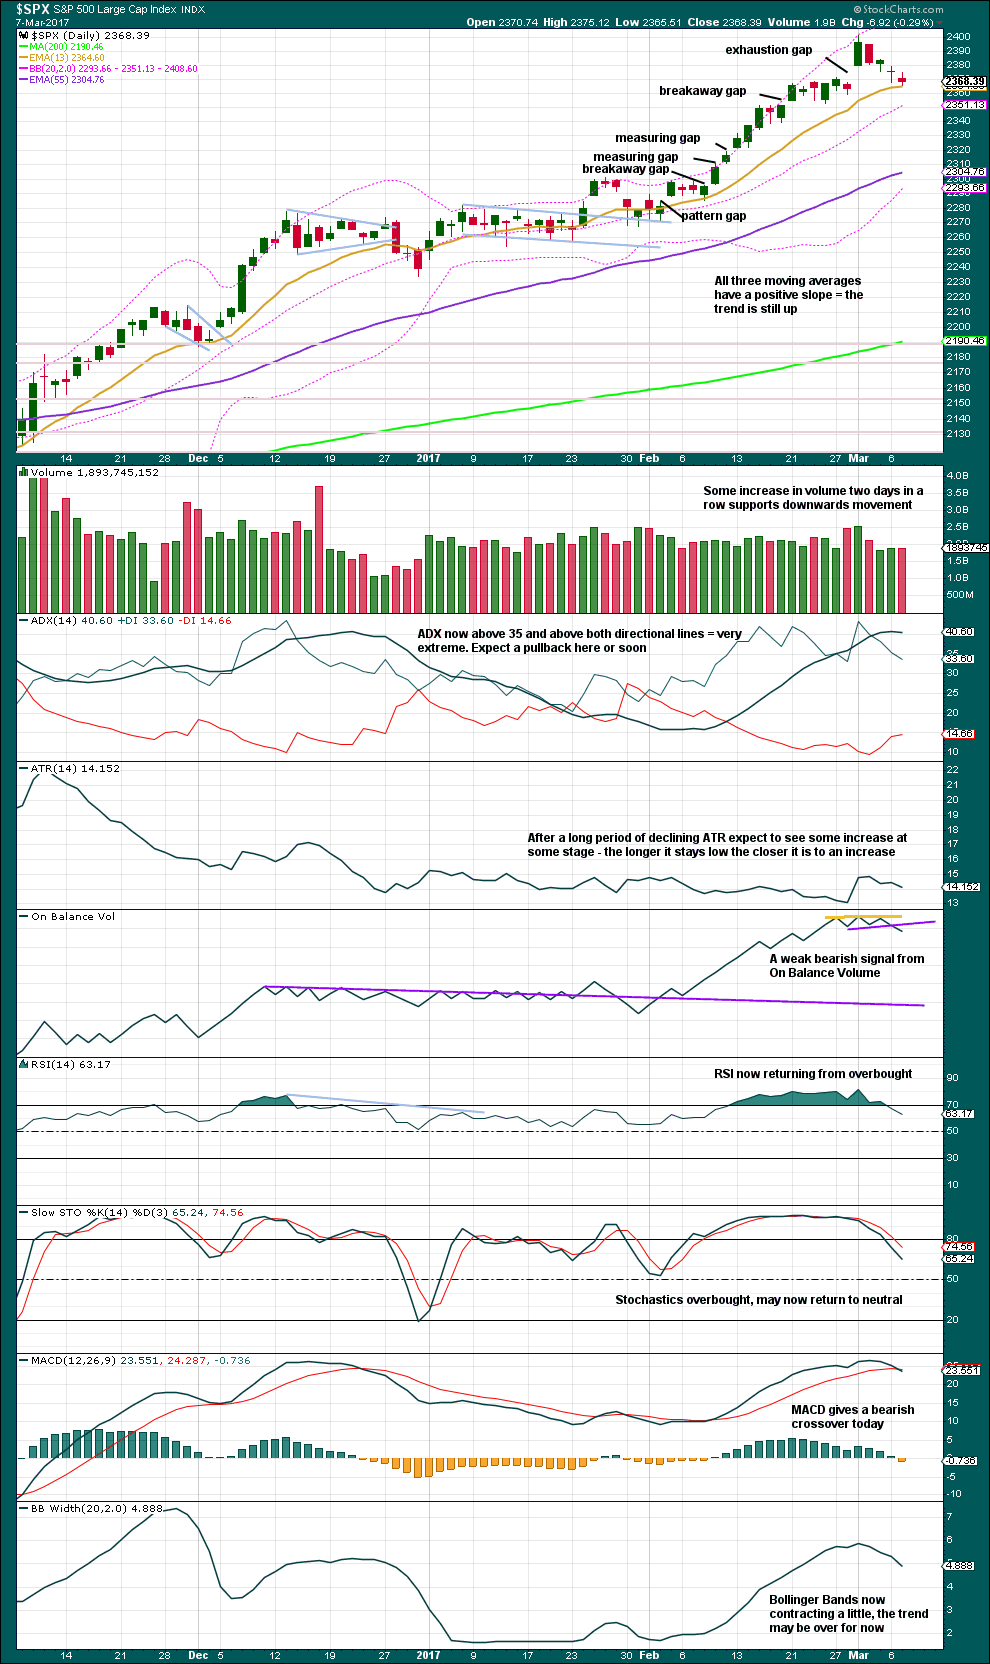
Click chart to enlarge. Chart courtesy of StockCharts.com.
Two days now of downwards movement show some increase in volume to support the fall in price. This in conjunction with On Balance Volume giving a weak bearish signal supports the Elliott wave count.
At this stage, price may find support about the 13 day moving average. If price breaks below that, then the 55 day MA may provide support.
A pullback is a reasonable expectation here because ADX was very extreme. The pullback should bring ADX back down below both directional lines, RSI may reach oversold, and Stochastics should reach oversold. There is room now for this pullback to continue further.
VOLATILITY – INVERTED VIX CHART
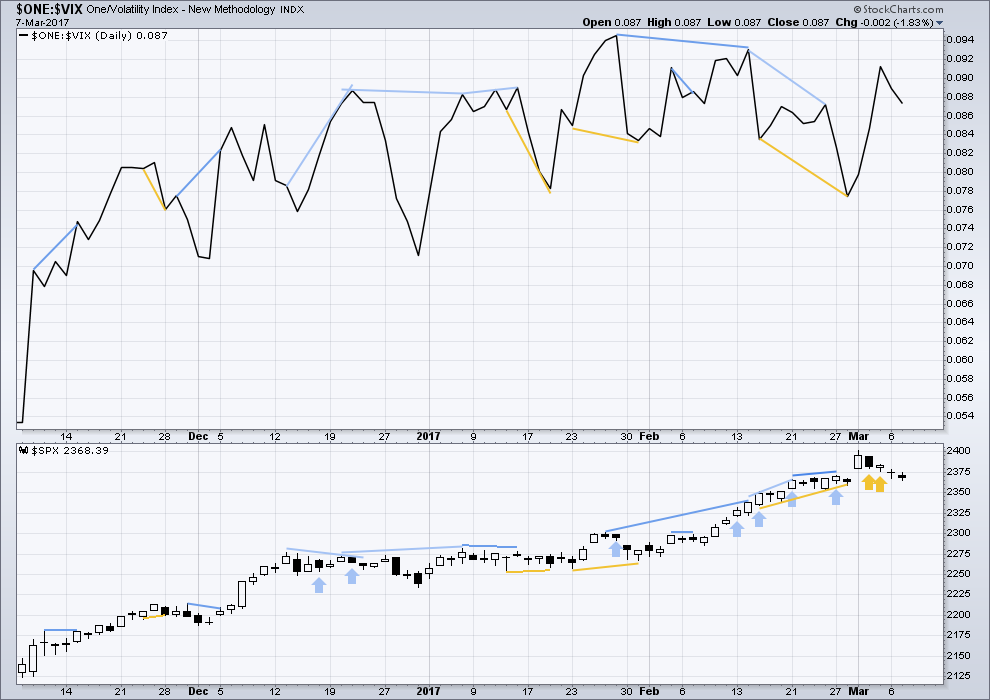
Click chart to enlarge. Chart courtesy of StockCharts.com.
Normally, volatility should decline as price moves higher and increase as price moves lower. This means that normally inverted VIX should move in the same direction as price.
Bearish divergence and bullish divergence spanning a few short days used to be a fairly reliable indicator of the next one or two days direction for price; normally, bearish divergence would be followed by one or two days of downwards movement and vice versa for bullish divergence.
However, what once worked does not necessarily have to continue to work. Markets and market conditions change. We have to be flexible and change with them.
Recent unusual, and sometimes very strong, single day divergence between price and inverted VIX is noted with arrows on the price chart. Members can see that this is not proving useful in predicting the next direction for price.
Divergence will be continued to be noted, particularly when it is strong, but at this time it will be given little weight in this analysis. If it proves to again begin to work fairly consistently, then it will again be given weight.
BREADTH – AD LINE
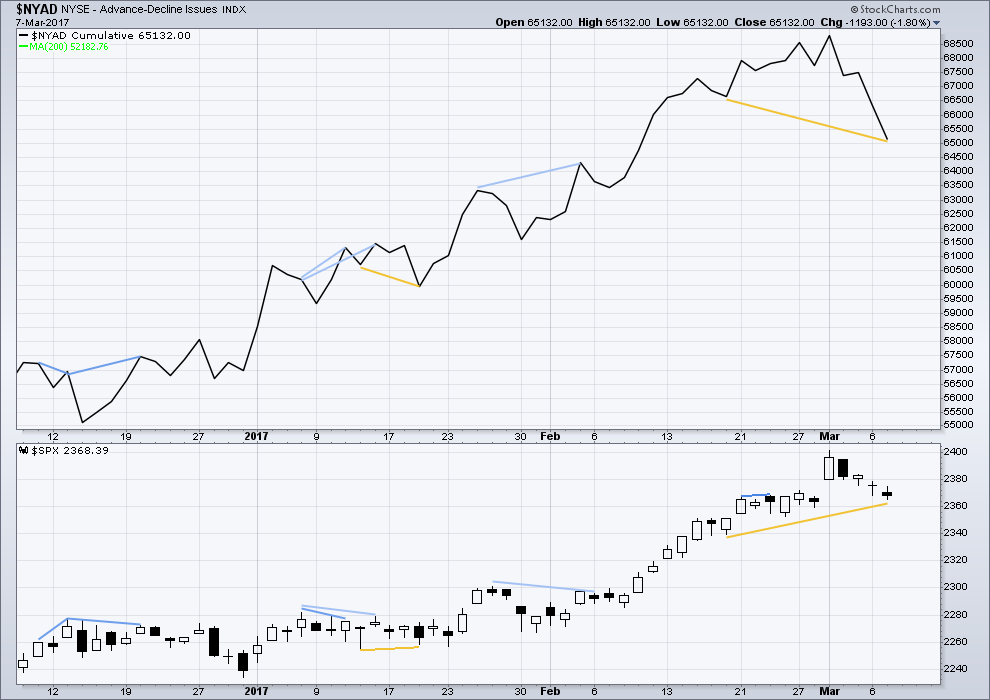
Click chart to enlarge. Chart courtesy of StockCharts.com.
The rise in price has support from a rise in market breadth. Lowry’s OCO AD line also shows new highs along with price. Normally, before the end of a bull market the OCO AD line and the regular AD line should show divergence with price for about 4-6 months. With no divergence, this market has support from breadth.
Short term bullish divergence noted in prior recent analysis has not been followed by upwards movement. There is still mid term bullish divergence between price and the AD line. Today the AD line made a new low beyond the prior low of the 17th of February, but price has not made a new low. This indicates weakness in price.
This divergence does not support the idea of a pullback right here and now. However, more weight will be given to the main technical analysis chart, which shows overbought and extreme conditions.
DOW THEORY
The DJIA, DJT, S&P500 and Nasdaq continue to make new all time highs. This confirms a bull market continues.
This analysis is published @ 05:50 p.m. EST.

Well well well! What have we here?! Is that the SPX I see trading below 2363.63???
Jiminy Cricket! It is!!
Well folk, looks like the banksters are finally getting a bit tired of propping things up. Nice pop on those SVXY puts. Anything above 130 is sceaming “Short Me!!”
Lara gave some great advice about Oil on the Gold site last night.
Take a look at what those USO March 17 12.00 puts did today.
Thank you Lara!!! You tha’ man! Er…I mean tha’ lady!! 🙂
2363.64 taken out
Good morning everybody.
There are a few ways to label the small chop of the last two sessions. Here’s another, and this is why I’m leaving the invalidation point at the last high.
Bottom line is I want to see price break out of the blue channel before I have a reasonable confidence in a trend change and a more time consuming pullback.
With so many stocks in the oil business you would have thought the oil drop of 6 percent would have a bigger effect on the stock market on the downside.
It will. Make no mistake about it. One strange effect of the long duration of these markets being interminably propped up is that lot of folk start thinking that economic fundamentals no longer matter, the markets will rise in perpetuity regardless of what is happening elsewhere in the cosmos. Those of you who have been reading the site for awhile know that I consider that bond market to be the ultimate arbiter of when the markets will face judgment day.
A very loud shot across the bow was fired today in the price action of JNK breaching a critical long term chart. Stay frosty!
Buying second half of SVXY March 17 130 strike puts for 2.80.
Now I am gone fishin’. Not much to see till we get done mucking around….
Verne
I still think we will see 2400 before 2350. Crazy huh. Sentiment is just driving the market
Interestingly enough, the indices have in the last few days opened a few gaps down and despite the mucking around have not filled any of them. In the recent uptrend gaps down were quickly filled intra-day during the march higher. Perhaps just another sign of a tiring trend. We continue to be stuck, with an apparent determination to keep the 2370 level in play. Until that gap at 2363.64 is decisively filled keeping some powder dry. It is enough to drive one batty! I’ll check in later to see if anything has changed…so far same old you-know-what…!
We should get some clarification on the wave counts today. The main should see us get an impulsive five wave up to complete sub-min c of minuette 2. If that wave count is correct, I would expect that move up to complete today and for us to end the day lower. If not, I would vote for a minor degree fourth wave underway….as if I had any other choice! 🙂
O.K folk. ES has finally taken out 2363.64. I am bewildered by why they kept buying that level during the session. I am a bit annoyed I did not trust the analysis and go ahead an load the rest of my positions during the day session. I am sure that was the intention. Oh well. Hopefully we get a good move down with plenty of opportunities to get positioned. I expect SVXY will take a dive at the open tomorrow. I could have picked up some more of those 130 strike puts for as little as 3.25 today! Rats! I am such a wuss! 🙁
Hi Lara:
I noticed in your summary the last few analyses you are saying the pullback may end in the 2368-2353 range. That is going to be one small pullback over a three month period!
But seriously. I assume that range is only for a possible minor four? 🙂
Yes, that is somewhat surprising since it is supposed to take two to four weeks. Oh well, where did you see 2363 taken out? Do futures count? Perhaps if it opens much lower we will have a move back up to the channel, to add to the short position.
Futures. It would have been far more preferable to see some clean impulsive waves to start this correction. What we are going to get is a slow and torturous bleed, and the death of a thousand cuts. If the banksters keep this up we are going to be correcting for a long time I am afraid. The one caveat is that if this is indeed a decline from a parabolic rise, nobody is really ready for what we are about to see- nobody. It does look as if we have broken the curve and unless the rules regarding parabolas have been abrogated by the banksters, we should rapidly give back all of the 2017 gains.
Well, it seems the rules regarding VIX and the S&P are currently broken by the banksters (no spell check, not bannisters!)
So… who knows what the immediate future has in store? In regards to previously reliable relationships that is.
I’ve said it before and I’ll say it again. This market at the end of a Grand Super Cycle trend, at the time of a Grand Super Cycle trend change, should appear broken. It should be very strange times indeed. We have to be super flexible.
On that note, I was so so close to my very first barrel yesterday…. the wave sucked me up and I was so surprised! A bit less wine the night before and I may have had it…
Gotta stay alert!
That’s for a very shallow minor 4. To last 2-4 weeks.
But that range comes from the fourth wave of one lesser degree, minute wave iv, for that wave count.
Yeah, I know it’s really shallow isn’t it. Sometimes the S&P does have really shallow corrections. Minor wave 2 (on the alternate chart) lasted 26 days and only effected a 0.11 retracement of minor wave 1.
This is one tendency that I have come to be comfortable with for this particular market. Gold and currencies rarely do it, but this market does it all the time.
There’s such a strong upwards bias to this market.
Indeed. I am starting to think that the absence of any downwards momentum could be signaling that the current move is corrective and that we have one more wave up to go. That has been the pattern the last several months. Sideways movement has always led to another leg up. There are many cycles that converge mid March so I think we should be prepared for a few more days of meandering before we get the final wave up. VIX for what it’s still worth, supports this view with continued slumber. Back to watching the paint dry… 🙂
First!! Its been a while 🙂
Second! 🙂
Hey Doc; I guess you’ll just have to settle for turd…!
yup,, turd I am