A new high above 2,367.79 confirmed the alternate hourly wave count, which expected more upwards movement with an increase in momentum to a target at 2,397. The high for the day was 2,400.98.
Summary: The picture is very bullish. Volume supports the strong upwards movement in price today. The breakaway gap may offer support. Move stops up to protect profits. The new target is at 2,424 and the limit is at 2,450.76.
New updates to this analysis are in bold.
Last monthly and weekly charts are here. Last historic analysis video is here.
MAIN ELLIOTT WAVE COUNT
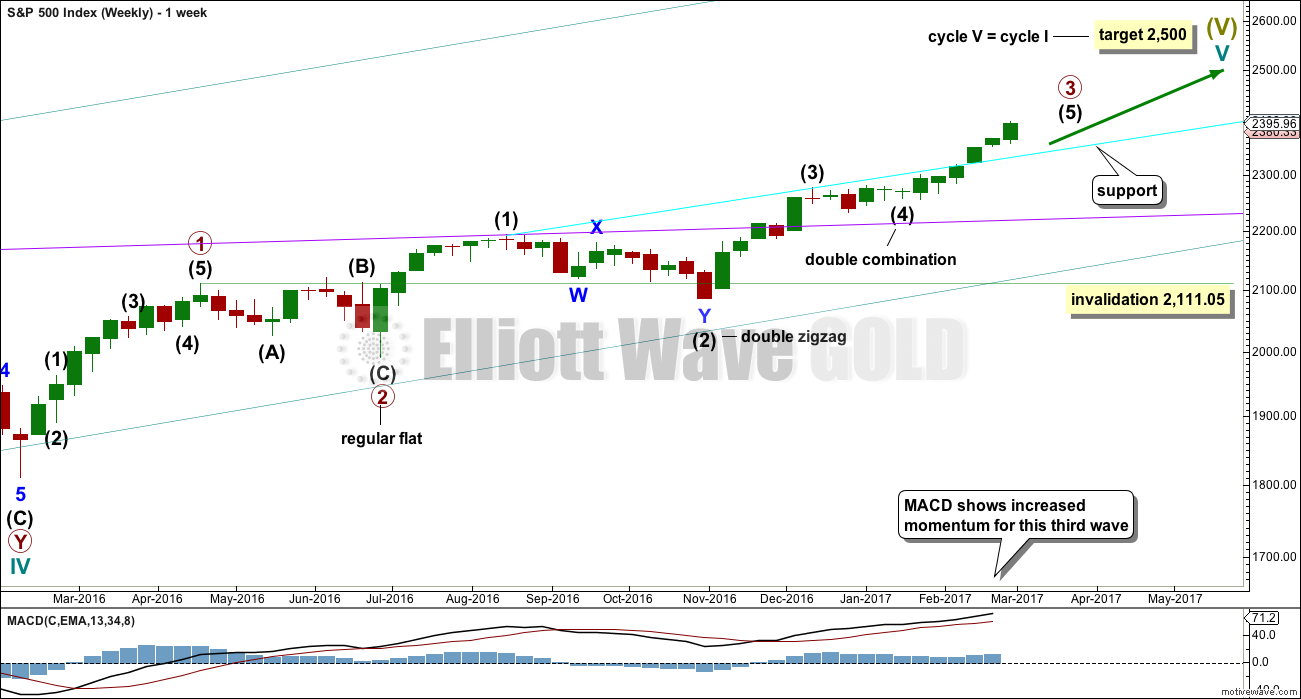
WEEKLY CHART
Cycle wave V is an incomplete structure. Within cycle wave V, primary wave 3 may be relatively close to completion.
When primary wave 3 is complete, then the following correction for primary wave 4 may not move into primary wave 1 price territory below 2,111.05.
Primary wave 2 was a flat correction lasting 47 days (not a Fibonacci number). Primary wave 4 may be expected to most likely be a zigzag, but it may also be a triangle if its structure exhibits alternation. If it is a zigzag, it may be more brief than primary wave 2, so a Fibonacci 21 sessions may be the initial expectation. If it is a triangle, then it may be a Fibonacci 34 or 55 sessions.
Primary wave 3 is now close to complete.
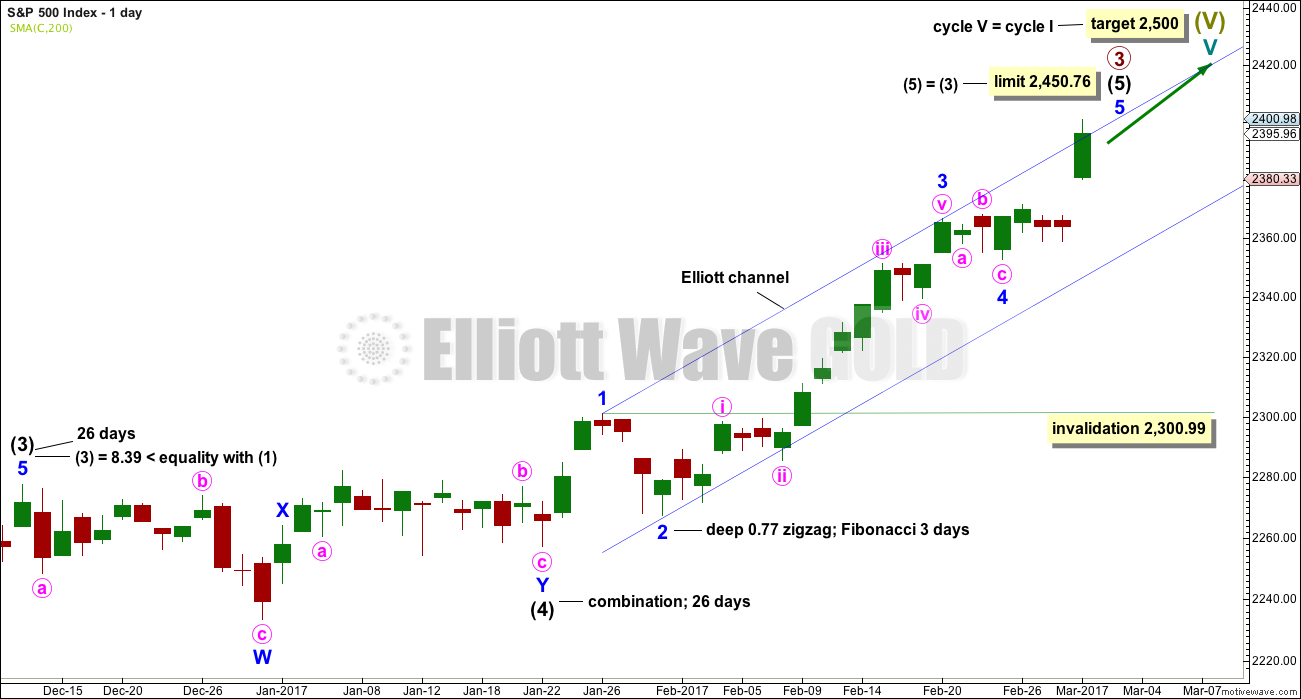
DAILY CHART
Intermediate wave (4) is a complete combination: zigzag – X – flat. It would have been even in duration with intermediate wave (3), both lasting 26 days.
Intermediate wave (3) is shorter than intermediate wave (1). One of the core Elliott wave rules states a third wave may never be the shortest wave, so this limits intermediate wave (5) to no longer than equality in length with intermediate wave (3) at 2,450.76.
Minor wave 3 has no Fibonacci ratio to minor wave 1. It is more likely that minor wave 5 will exhibit a Fibonacci ratio to either of minor waves 3 or 1.
Minor wave 2 was a deep 0.77 zigzag lasting three days. Minor wave 4 may be a complete single flat correction. There is perfect alternation between minor waves 2 and 4 and they have better proportion now on the daily chart.
Intermediate wave (5) has so far lasted 26 days. At this stage, an expectation of a Fibonacci 34 days total for intermediate wave (5) looks reasonable, so it may now continue for another 8 days or sessions.
The proportion here between intermediate waves (2) and (4) is acceptable. There is alternation. Both are labelled W-X-Y, but double zigzags are quite different structures to double combinations.
Minor wave 4 may be still incomplete. It may not move into minor wave 1 price territory below 2,300.99.
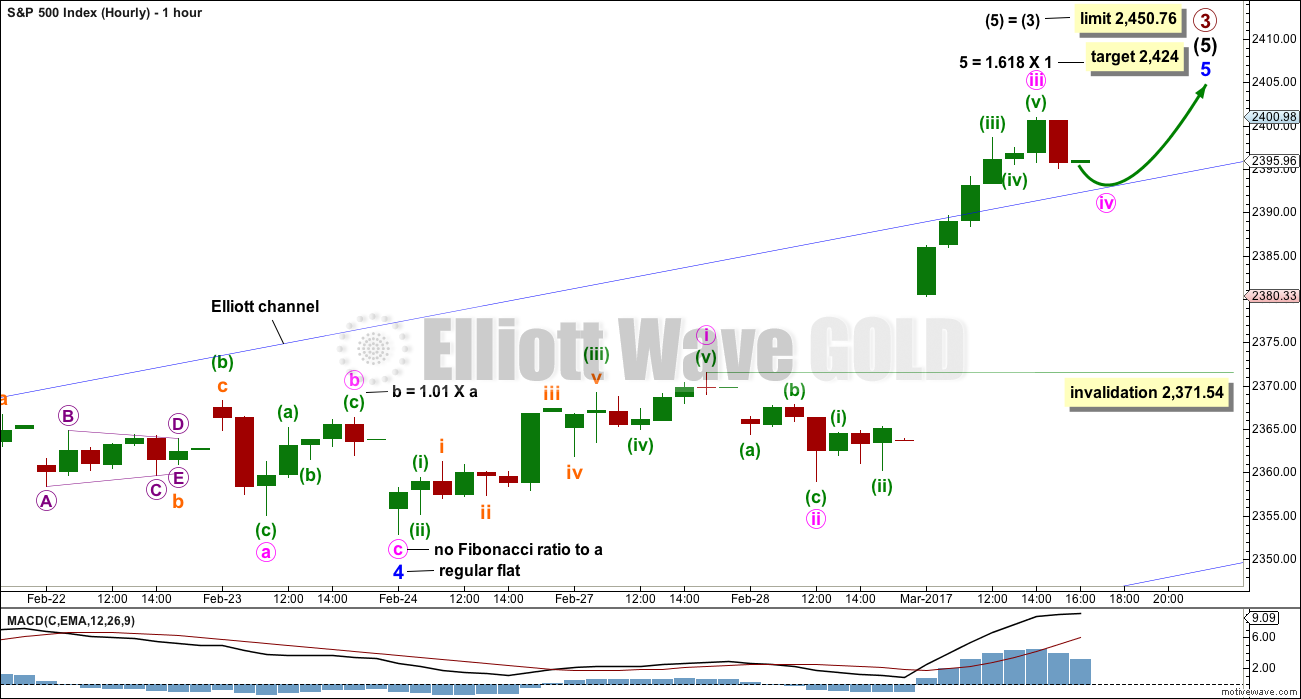
HOURLY CHART
Another breakaway gap should provide support while the trend continues.
There is no Fibonacci ratio between minute waves iii and i.
Minor wave 5 has passed equality with minor wave 1 and the structure is incomplete. A new target is calculated using the next likely Fibonacci ratio to minor wave 1.
Minute wave iv may not move into minute wave i price territory below 2,371.54.
TECHNICAL ANALYSIS
WEEKLY CHART
Click chart to enlarge. Chart courtesy of StockCharts.com.
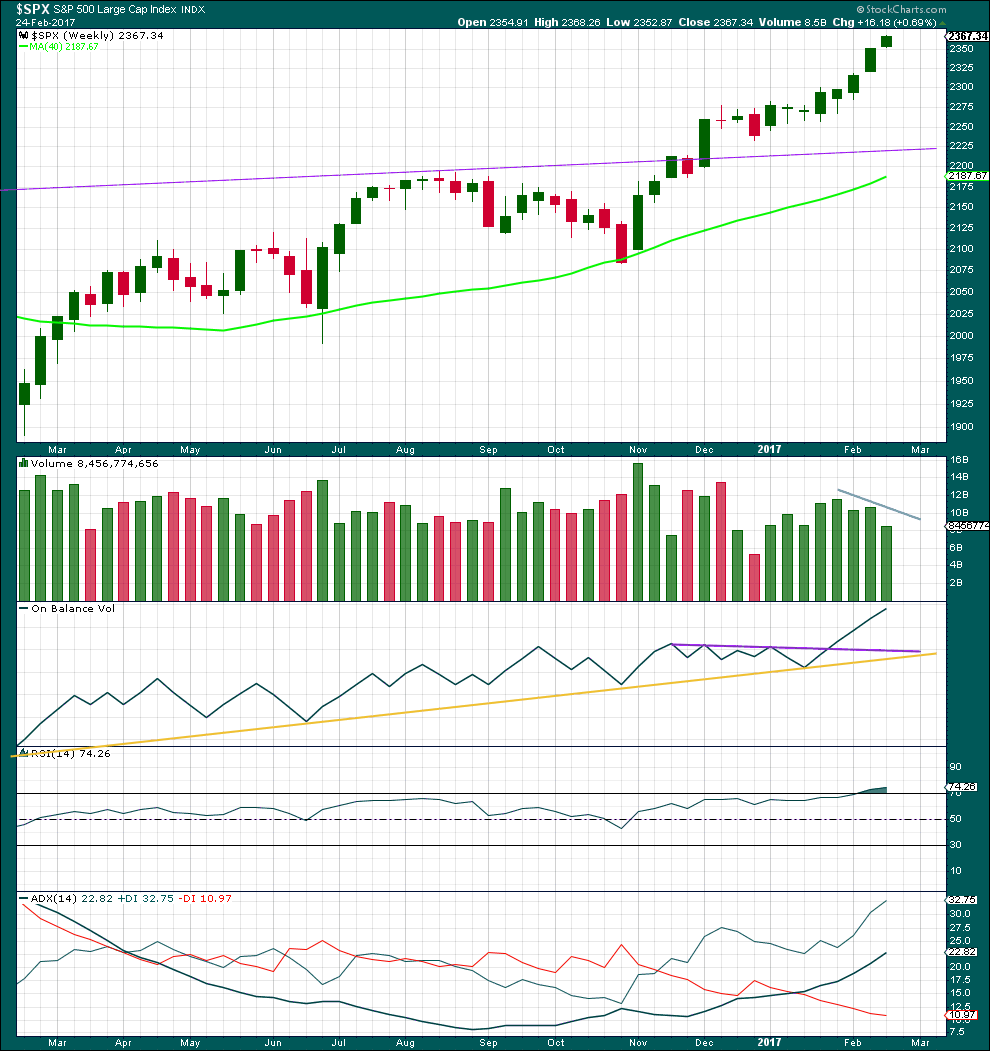
There are now eight green weekly candlesticks in a row. A larger correction may be expected soon, but not quite yet.
There has been some decline in volume over the last three weeks. This trend is showing early signs of weakening.
On Balance Volume remains very bullish.
RSI is overbought, but in a bull market this can remain extreme for a reasonable period of time. If it begins to exhibit divergence with price at the weekly chart level, then a larger correction may be expected to begin. There is no divergence at this time.
This trend is not yet extreme.
DAILY CHART
Click chart to enlarge. Chart courtesy of StockCharts.com.
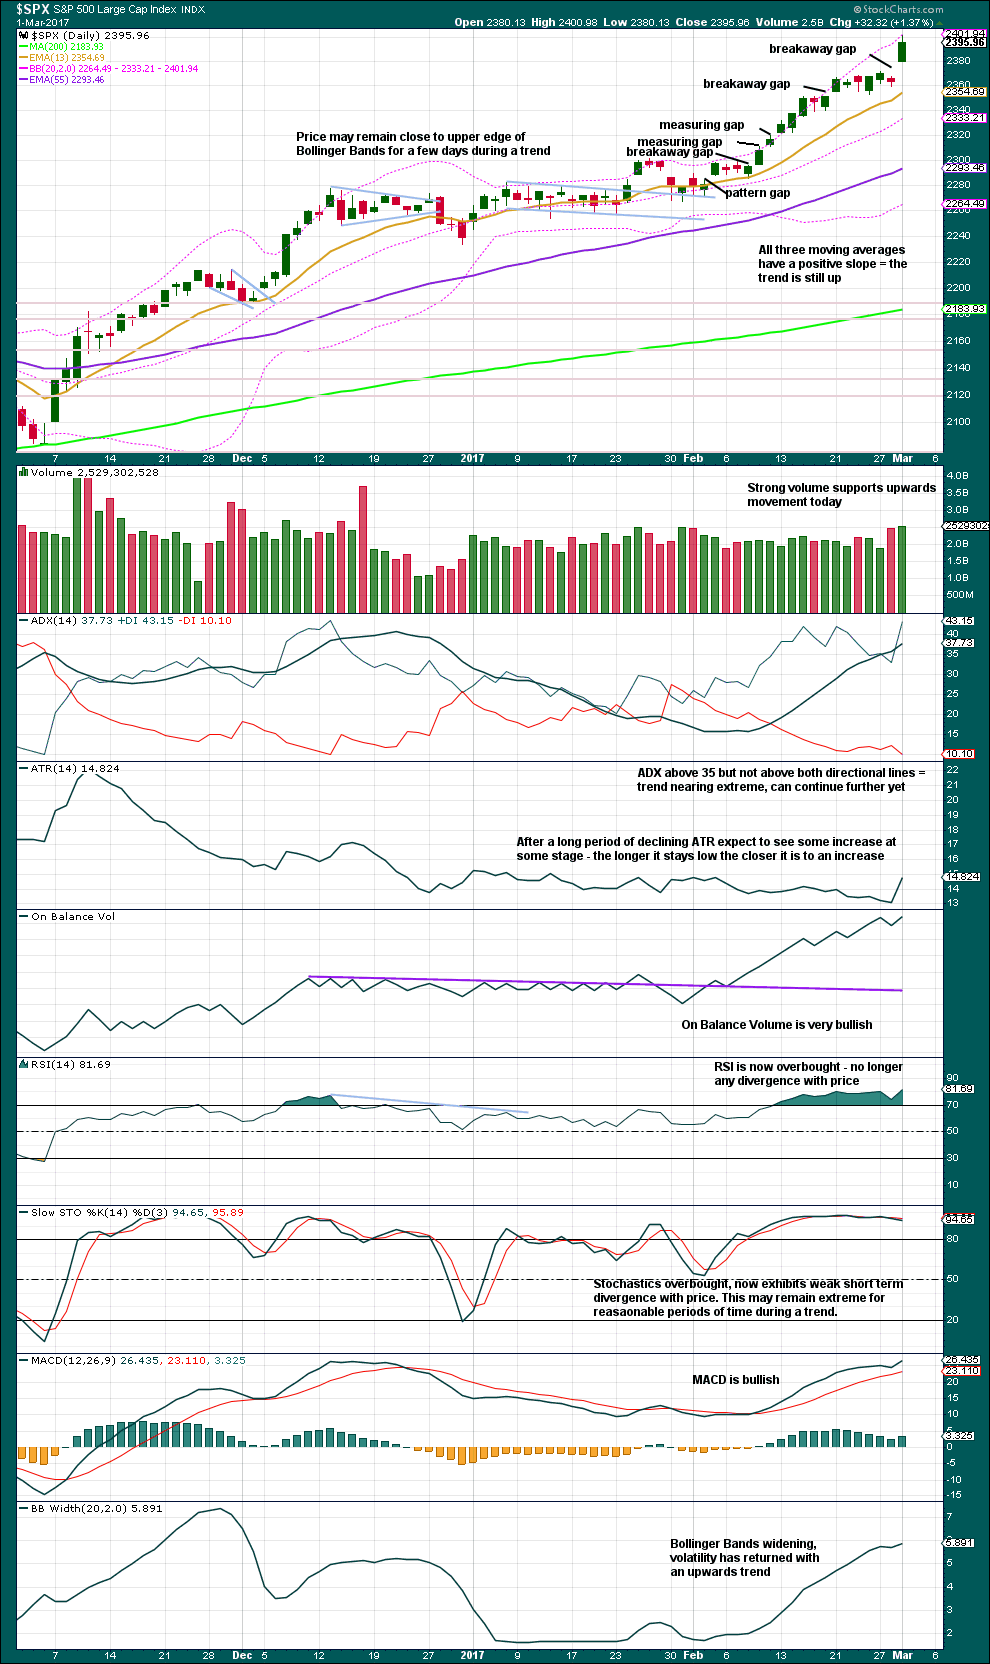
This chart looks very bullish: Divergence (which was only slight) between price and RSI has disappeared; ADX is no longer as extreme; ATR shows some increase today; On Balance Volume remains very bullish; Bollinger Bands are bullish.
A pullback may come soon, but not yet. There is still room for this trend to continue and at this stage there is no indication it has ended.
The only very slight bearishness today may be the slightly longer upper wick on the daily candlestick.
VOLATILITY – INVERTED VIX CHART
Click chart to enlarge. Chart courtesy of StockCharts.com.
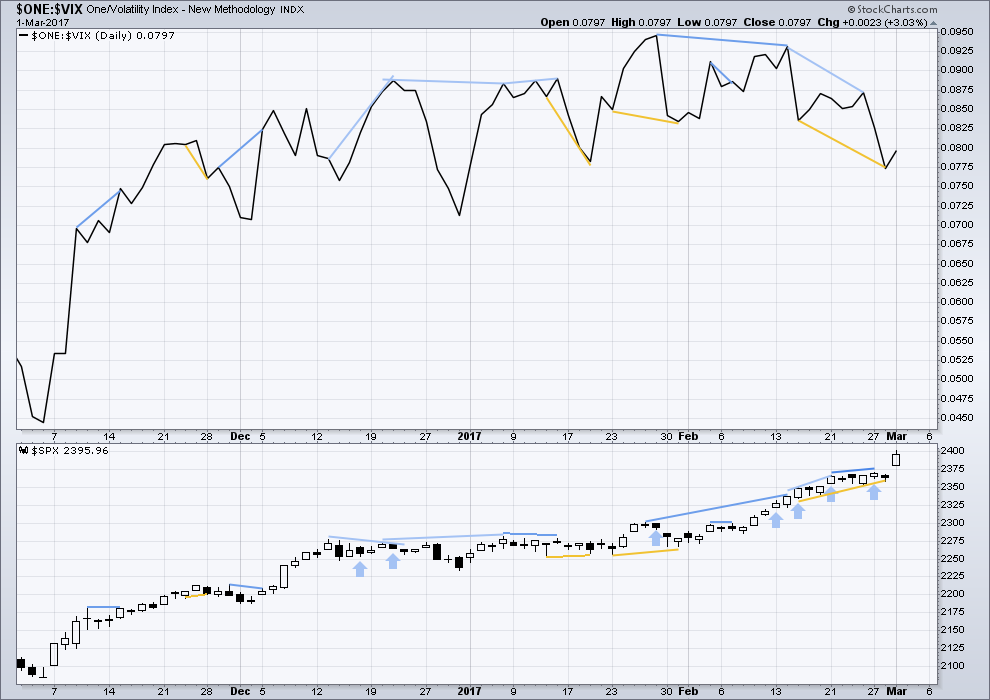
Normally, volatility should decline on rising price. There is double multi day divergence now between price and inverted VIX. This is bearish.
Either VIX is now decoupled from this market, or this persistent divergence will be resolved by primary wave 3 ending sooner than expected and primary wave 4 beginning very strongly. This divergence signals traders to be very cautious; assume the trend remains the same, but if entering the trend be aware for the potential here of a swift drop in price and use stops accordingly. Risk no more than 1-3% of equity.
Bullish divergence between price and inverted VIX yesterday has been followed by a strong upwards day. It may be followed by one more before it is resolved, or it may be resolved here.
Recent strong bearish divergence between price and VIX has absolutely not been followed by any reasonable downwards movement. It is considered to have failed, for the short term.
BREADTH – AD LINE
Click chart to enlarge. Chart courtesy of StockCharts.com.
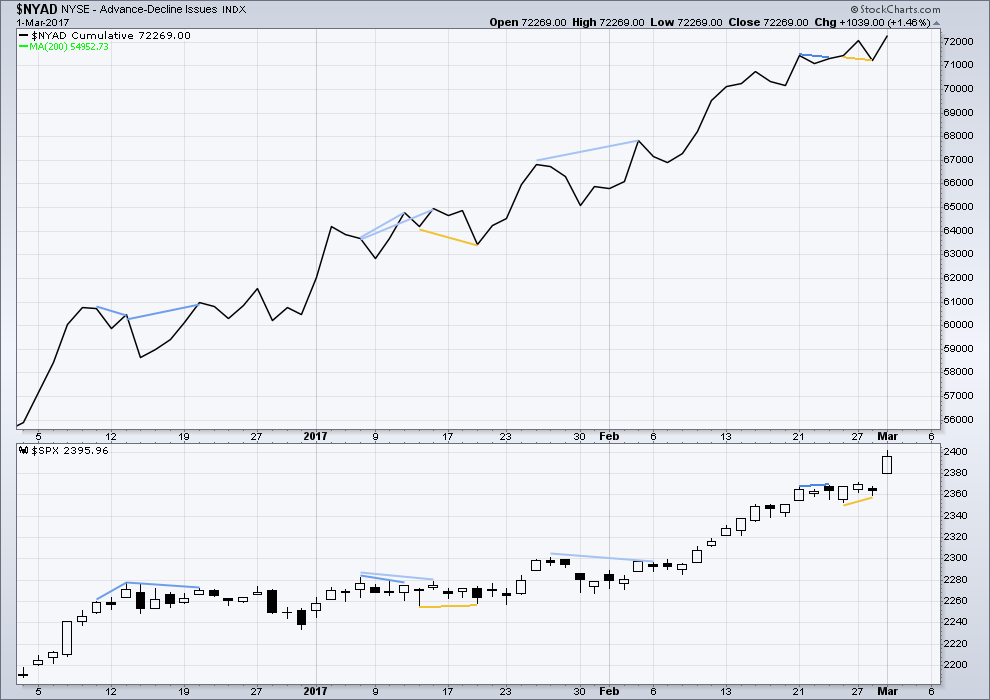
The rise in price has support from a rise in market breadth. Lowry’s OCO AD line also shows new highs along with price. Normally, before the end of a bull market the OCO AD line and the regular AD line should show divergence with price for about 4-6 months. With no divergence, this market has support from breadth.
Bullish divergence noted yesterday has been followed by a strong upwards day. This may be resolved here, or it may yet be followed by at least one more upwards day before it is resolved.
No new divergence is noted today. The new high in price was matched by a new high for the AD line. The rise in price has support from increasing market breadth.
DOW THEORY
The DJIA, DJT, S&P500 and Nasdaq have made new all time highs in December of 2016. This confirms a bull market continues.
This analysis is published @ 07:33 p.m. EST.

Lara,
When SPX > 2,397, Int 5 > Int 1. Yesterday, SPX reached 2400.98. Is it possible that Int 5 has already completed at 2400.98?
Thanks.
Well, it is possible (in that many things are possible) but the structure of minor 5 just doesn’t look complete. It really needs a final fifth wave up to complete it.
The alternate idea I’m considering and one Peter Rosenthal alluded to yesterday, is that intermediate (3) isn’t over. Considering the strength of this upwards movement and the extreme readings for RSI and ADX it does look like this may be the end of a third wave at intermediate degree within a third wave at primary degree.
So I’m going to chart that today and see how that fits. And looks. I may publish it if it looks good enough.
The final target would still be the same, and expected direction the same.
If that is correct the gap from Wednesday will be filled tomorrow. I still think you are right in that we need one more move up to complete the current impulse…
Well…looks like we have support at the top of yesterday’s gap. Did I exit that spread too soon?? 😀
G’nite all!
Wow!
Everybody is already bullish!
Who in the thunderclap is buying this decline so agressively as to result in a VIX red print?! Could it be……BANKSTERS???!!!!! 🙂
Curioser and Curioser….!!!!
CNN’s Fear & Greed Index at extreme greed, but only 75%. Not really enormously extreme… could go higher yet.
This is nuts! DJI down triple digits and VIX in the red!!??? What the….!!!!!????
IKR
It’s just totally weird. This really makes using VIX as an indicator of the next direction pretty hard. It’s just not working.
Mr Market broke his back 🙁
Just when I think I have seen every weird and never before seen anomaly with VIX yet another one presents itself. Strange times indeed. I am tracking the move inside the parabola and a bit further upwards flight would be ideal…
I’m taking the money and running on those bearish call credit spreads. A quick 20% pop is nothing to sneeze at! Will reload on upcoming bounce. 🙂
SVXY is going to offer another (rare these days!) 10X opportunity on the fifth wave up in SPX. If it pokes its head anywhere near 130 go ahead and whack-a-mole! 🙂 🙂 🙂
Oops! Posted before I saw Lara’s comment. Never mind! 🙂
Move down today starting to look to me a bit out- of- proportion to be a fourth wave- possibly a second?!
So far only 0.382 so it looks all good to me.
Hourly chart updated:
Minute iv must remain above first wave price territory so that means the EW invalidation point is within the breakaway gap.
The structure of minor 5 is incomplete. It needs a fifth wave up to complete it. If minute v is = in length to minute i it would be 18.67 points. So that would be a minimum expectation.
Interestingly, minor 3 was extended and now minor 5 is also extended. Minor 1 was quick and short.
The ? on minute iv is to question whether or not it’s complete. It may yet continue sideways for another day or so as a flat, combination or triangle. All of those should be mostly sideways movements, so it looks like the low right now today is nearly as low as minute iv should go. In other words, this may be a nice entry point for a punt on the final fifth wave up at three degrees. A short term trade.
If entering long here then remember my two Golden Rules. Manage your risk and take responsibility for your account.
Thanks Lara. I just asked about S&P fifth wave extensions. I am beginning to think we may see more to come. I’ll leave the last 20 points or so to those who are much more flexible and quick than me. What is really perplexing is that SPX is down relatively strongly yet VIX is down as well, 6%. Hmmm?
This is a very rare event- a display of irrational exuberance imo…so what’s new, why not keep on BTFD? It has been a marvellous strategy to date….! 🙂
Early afternoon in the North Carolina mountains and minute-iv seems to have settled at the 38.2 retracement of minute-iii. Do you think that’s the end of minute-iv or is that just (a) of minute-iv?
Good day Rodney 🙂
The long lower wicks on the last two hourly candlesticks, and they’re both hammers, does look like we have a low for today.
This could be just wave A or W of minute iv, or it could be minute iv.
But either way, the low right now is probably either the low extreme for minute iv or close to it.
The sun has just risen here in Mangawhai NZ and there are small waves for me to play on 🙂 May you have a lovely day in your mountains too
VIX in bullish falling wedge. First break above upper trend line should fall back to to it find initial support. A solid bounce there and it should be off to the races…
Gaps in indices from yesterday must absolutely remain open or they will have to be considered exhaustion gaps. I am hoping they stay open for one more push higher followed by a decent correction and the final move up. VIX showing remarkable complacency. If those gaps are filled today, the banksters are done, and it’s “Farewell and Adieu…”
🙂
Looks like small degree fourth wave underway.
“Once more unto the breach, dear friends, once more…”
The hardest thing to do as traders is enter on a counter trend movement, in the direction of the larger trend.
Today this correction for minute iv may be offering an opportunity to join the upwards trend. Jumping in long here may feel wrong though while price is falling.
But yeah, once more into the breach Verne!
So true! I am selling a boatload of SPY 240/245 bearish call spreads going into April 5 for credit of 1.35. Will add second half with a new high after fifth wave up.
Pay attention to Lara’s targets people!! 😀
Let’s hope we put the finishing touches on the parabola over the next few sessions. Looking for VIX futures to continue divergence. The kind of divergence we are seeing I don’t think is speaking so much to the immediate price action as much as it is telling us that the current move up is terminal. Have a great day everyone…stay frosty! 🙂
It looks like wave iii up was about 40 points. If we use a .382 or .618 we go back in the channel. (Correct to 2385 or 2375 respectively). Your wave 4 is much shorter…..if it breaks below the channel would you expect one of these to be met?
A good point. I’d expect the upper edge of the channel to provide support in the first instance.
If it does not then the .236 Fibonacci ratio would be the next target.
Either this is the middle of a third wave as Peter opines below, or the S&P is behaving line a commodity and minor 5 may end with a blowoff top.
When commodities do that they breach their channels, then price remains outside of them, finding resistance or support at the prior extreme of the channel.
So how price behaves with that trend line tomorrow may add a clue as to which idea is more likely.
Lara,
Any chance we could still be in intermediate 3 of Primary 3 given how bullish price action and volume seem right now?
Thanks,
Peter
Yes, and I did consider that today.
If we don’t have a good sized pullback before the limit at 2,450.76 then that would be the only explanation I can see at this time which would meet all EW rules.
The final target at 2,500 would be the same though.
two in a row,, woo hoo