
An analysis of monthly charts of the Dow, Transportations and the S&P500 may be helpful in identifying whether or not the current bull market is healthy and likely to continue or shows signs of weakness.
Bull markets end and eventually turn into bear markets for a time. Often this change comes with technical weakness some months prior to a trend change. Technical weakness cannot be used as a signal nor as a timing device to exit a bull market, but it can be used to provide advance warning of an impending bear market which investors should use to watch markets carefully and increase levels of caution.
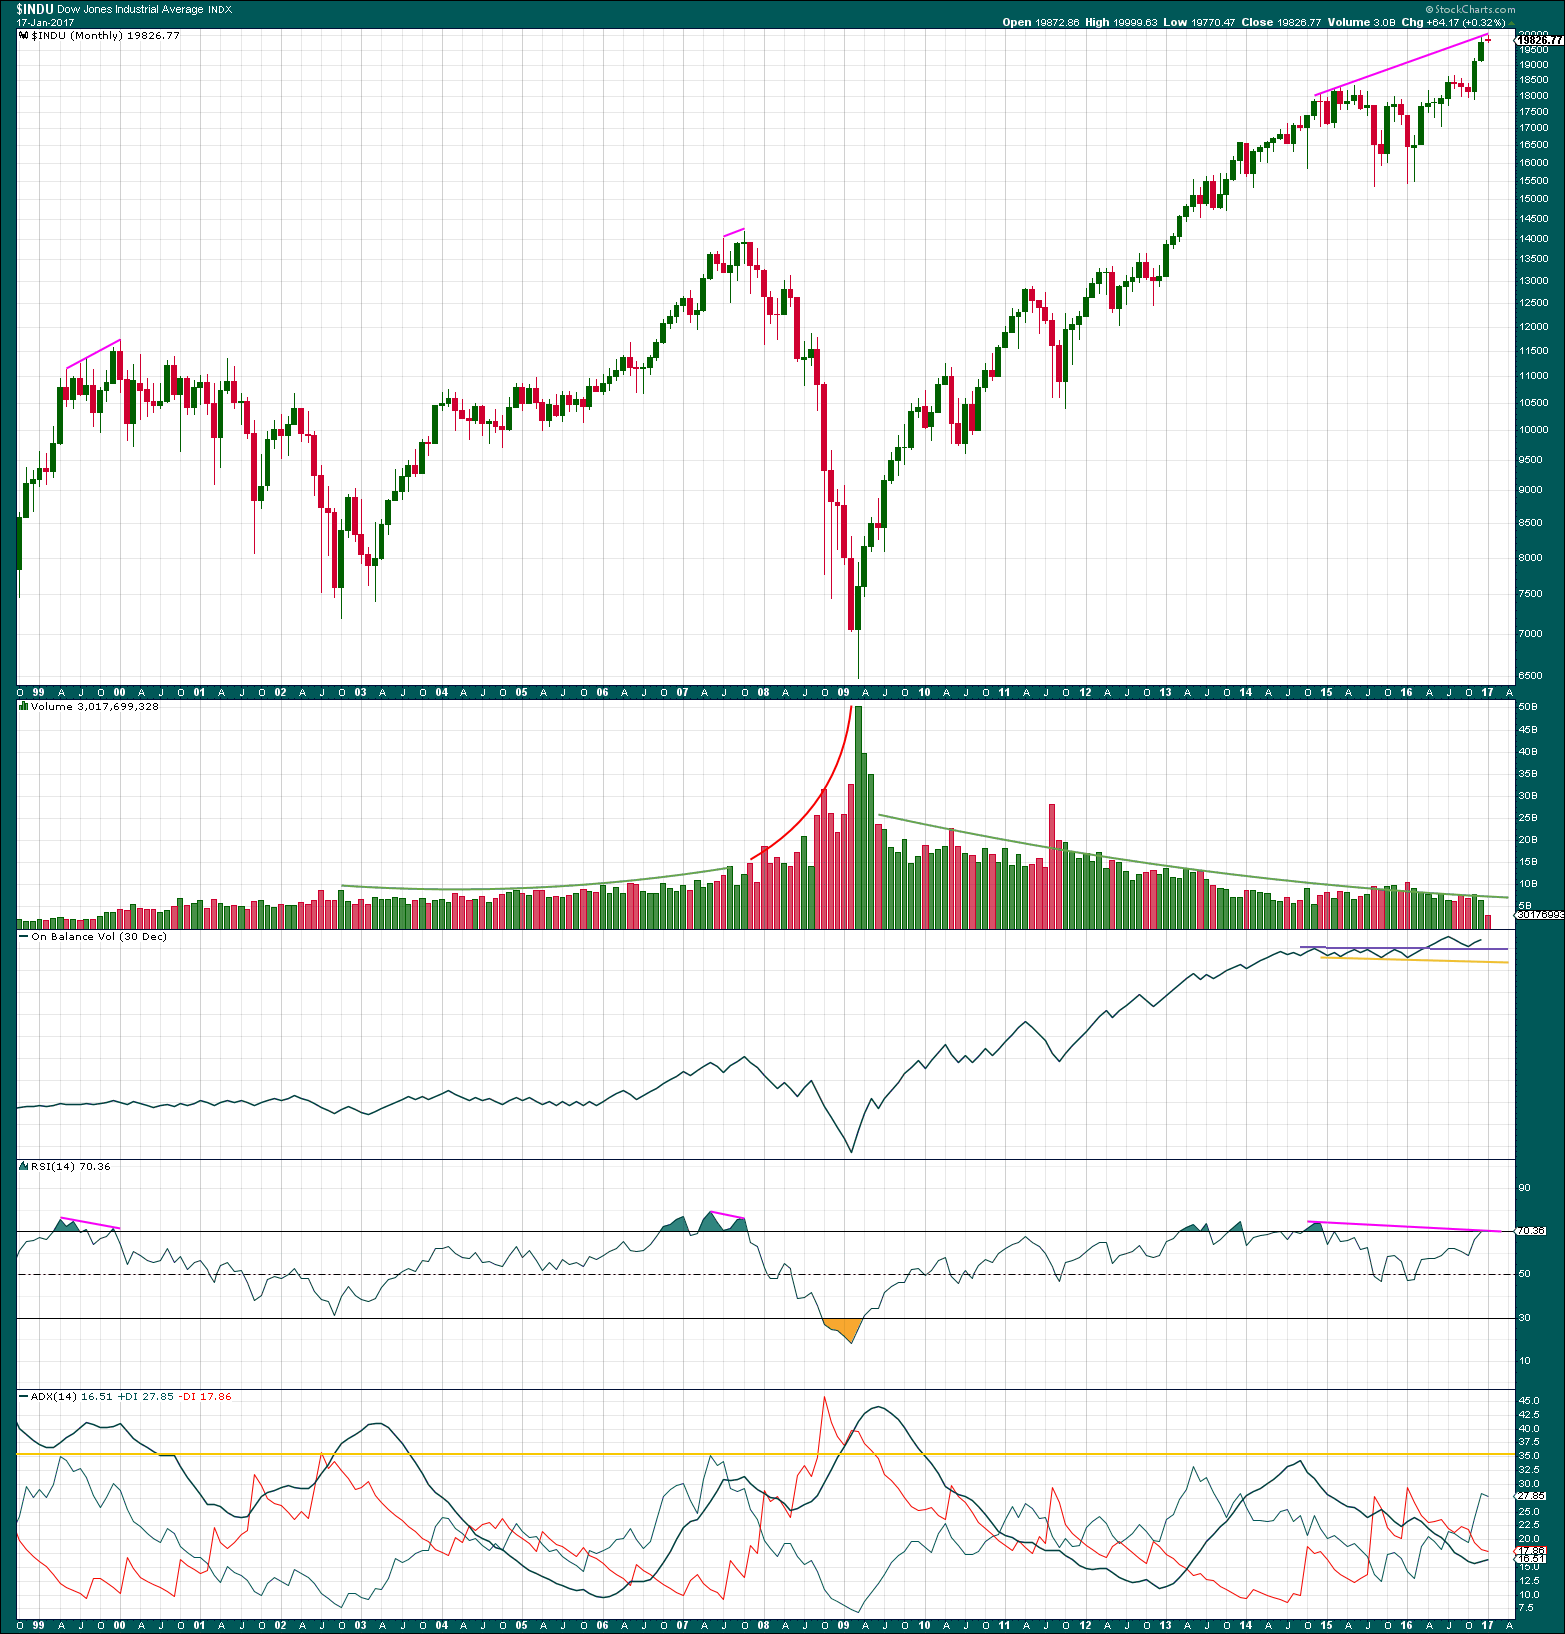
DOW JONES INDUSTRIAL AVERAGE
MONTHLY CHART
Click chart to enlarge. Chart courtesy of StockCharts.com.
I will not use the purple Magee trend lines on this monthly chart for the DJIA. I have concluded that after analysis of that method it does not work sufficiently well to be of any reasonable use for this market at this time frame.
A bull market should be accompanied by a corresponding rise in volume for it to be healthy and sustainable. Price requires the active participation of buyers for it to continue to move higher. The bull market of October 2002 to October 2007 was accompanied by a rise in volume to support price.
For a bear market, a rise in volume is not necessary for price to fall. Price may fall of its own weight; an absence of buyers can force price lower just as increased activity of sellers can achieve the same thing.
The bear market of October 2007 to March 2009 did see some reasonable increase in volume to assist the fall in price.
The first three months of the current bull market (for March, April, and May 2009) saw very heavy volume, the balance of all which was upwards. However, through each month volume declined and has continued to be lower since. Overall, this current bull market is accompanied by a decline in volume. This is somewhat unsteady, but it does continue. This indicates weakness in the bull market but cannot assist in identifying when it may end. The decline is clear enough and has persisted now for years, so investors should be cautious in this market.
On Balance Volume often works well with trend lines to indicate a following direction from price. OBV gives a bullish signal in May 2016 with a break above the purple resistance line, and again in November 2016 with a bounce up from a back test of that same line.
RSI often provides a warning of an impending trend change. Again, this cannot be used to pinpoint a turn for price; it is a warning of weakness only. This works for both bull and bear markets. For bull markets the warning can span years and for bear markets it more often is short lived spanning only months.
RSI exhibited divergence with price at the end of the bull market ending in January 2000 going back to July 1997 (not shown on this chart). The warning given spanned 30 months and developed onto triple bearish divergence before price turned.
At the end of the DotCom crash in October 2002, there was no warning of an end to the bear market from RSI. There was no divergence and RSI did not reach oversold. This indicator does not always work to warn of the end to a bear market.
At the end of the bull market in October 2007, RSI exhibited single bearish divergence with price spanning only three months. The message here is that this warning cannot be used for market timing.
At the end of the Global Financial Crisis in March 2009, there was only single month divergence with price and RSI, with RSI oversold.
Currently, there is single bearish divergence with price and RSI spanning 26 months. This could certainly continue for longer before price turns, but it cannot be useful in timing. However, it should warn investors to be cautious in this current bull market.
ADX can be useful to tell if a trend is extreme or young. An ADX reading above 35 (yellow line) is considered extreme. When the black ADX line is above both directional lines the trend is extreme. If this occurs with ADX also above 35, then extreme caution is warranted because the trend is likely to end very soon. This was the case in October 2002 and March 2009. In both instances that was the month a bear market ended.
In October 2007, at the end of the last bull market, ADX was below 35 but did manage to rise above both of its directional lines in August 2007, two months before the bull market ended.
Currently, ADX is not extreme. It is quite the opposite. It is rising and only just above 15. The ADX line is below both directional lines. This indicates a young bull market after the large correction that ended in January 2016.
If ADX reaches extreme, either above both the directional lines or above 35, then investors would be warned to cull underperforming stocks and be alert for a potential bear market. That is not the case today.
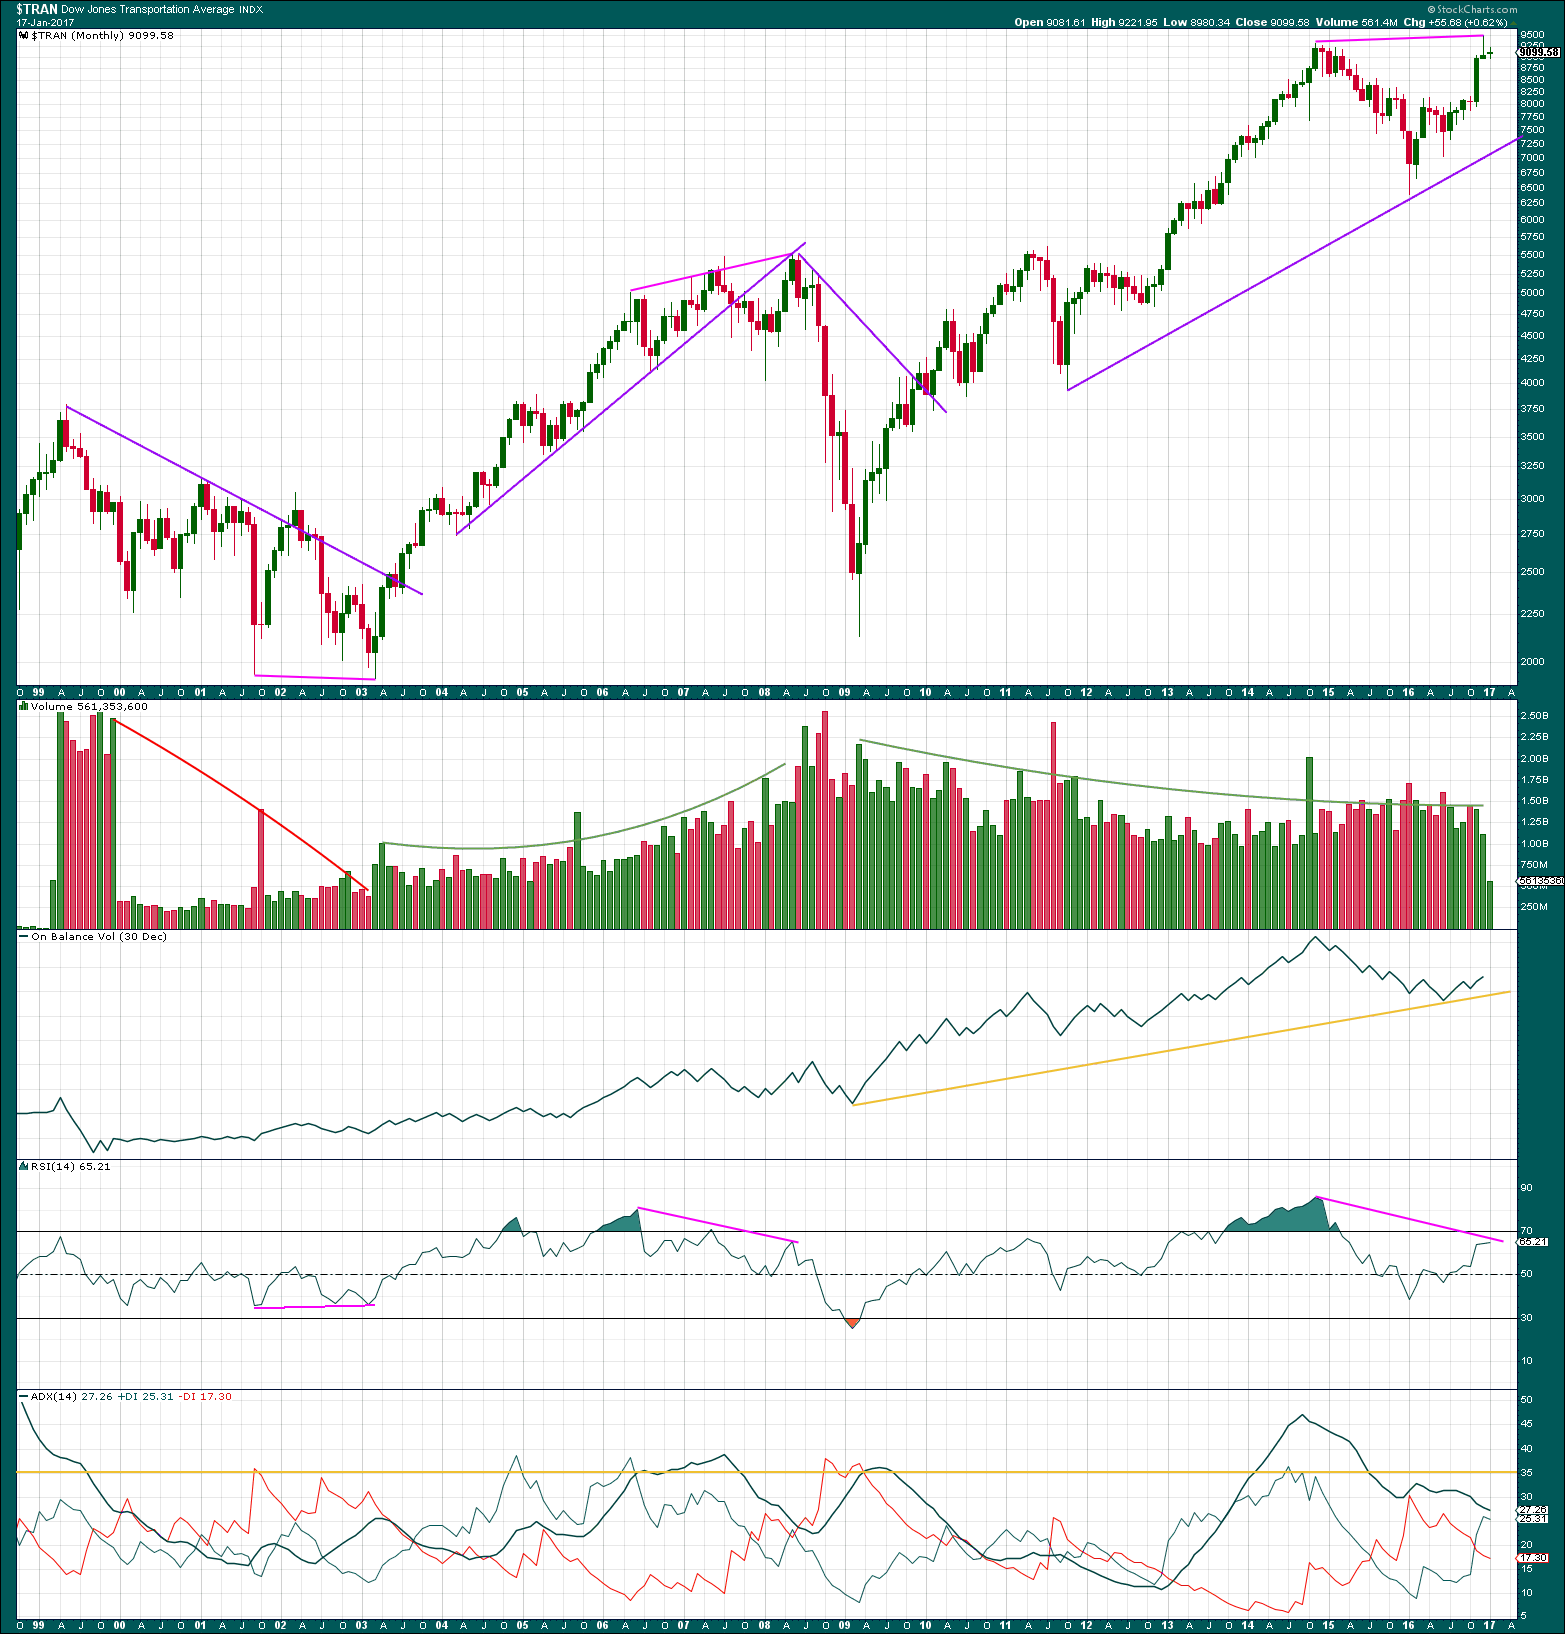
DOW JONES TRANSPORTATION AVERAGE
MONTHLY CHART
Click chart to enlarge. Chart courtesy of StockCharts.com.
The purple lines are trend lines drawn using the technique outlined by Magee in the classic “Technical Analysis of Stock Trends”.
This simple method would have worked well for DJT to confirm an end to a bull or bear market. For a bull market, the trend line is drawn across the first two major lows within the market. For a bear market, the trend line is drawn from the start of the bear to the first major high within it.
The current bull market has price comfortably well above the trend line. If this line is breached, it would serve to provide strong confidence that a bear market would be underway and likely in the early stages for DJT.
Volume shows the same weakness here as it does for the industrials. The decline is less steady for DJT, but volume is still overall declining as price continues higher.
A long term support line can be drawn for DJT on On Balance Volume. If OBV comes down to this line, it should initially be expected to offer support and assist to halt a fall in price there. If the line is breached, then it would provide a bearish signal (but not a strong one as the line has been tested only twice).
Prior to the end of the bull market in April 1998 for DJT, there was only single month divergence with price and RSI for the month of April 1998: RSI declined as price made the final high. This would not have been very useful at all in timing, but it did offer a small warning of weakness.
At the end of the DotCom crash in March 2003, there was substantial single bullish divergence between price and RSI at the last two major lows. This would have been a strong warning that the bear market was coming to an end.
At the end of the bull market in May 2008, there was double bearish divergence between price and RSI. The message here is that this divergence can be longer held at the end of bull markets than it normally is in bear markets, a tendency that I have long noticed.
At the end of the Global Financial Crisis in March 2009, there was only single month divergence between price and RSI for DJIA and RSI was oversold.
Currently, there is very strong divergence between price and RSI back to November 2014. This is a warning again of some weakness in this bull market, so investors would be wise to be alert and cautious.
ADX indicates no clear trend yet for DJT as the black ADX line is declining. It remains above both the directional lines.
The situation at this time for DJT is more bearish than DJIA or the S&P500.
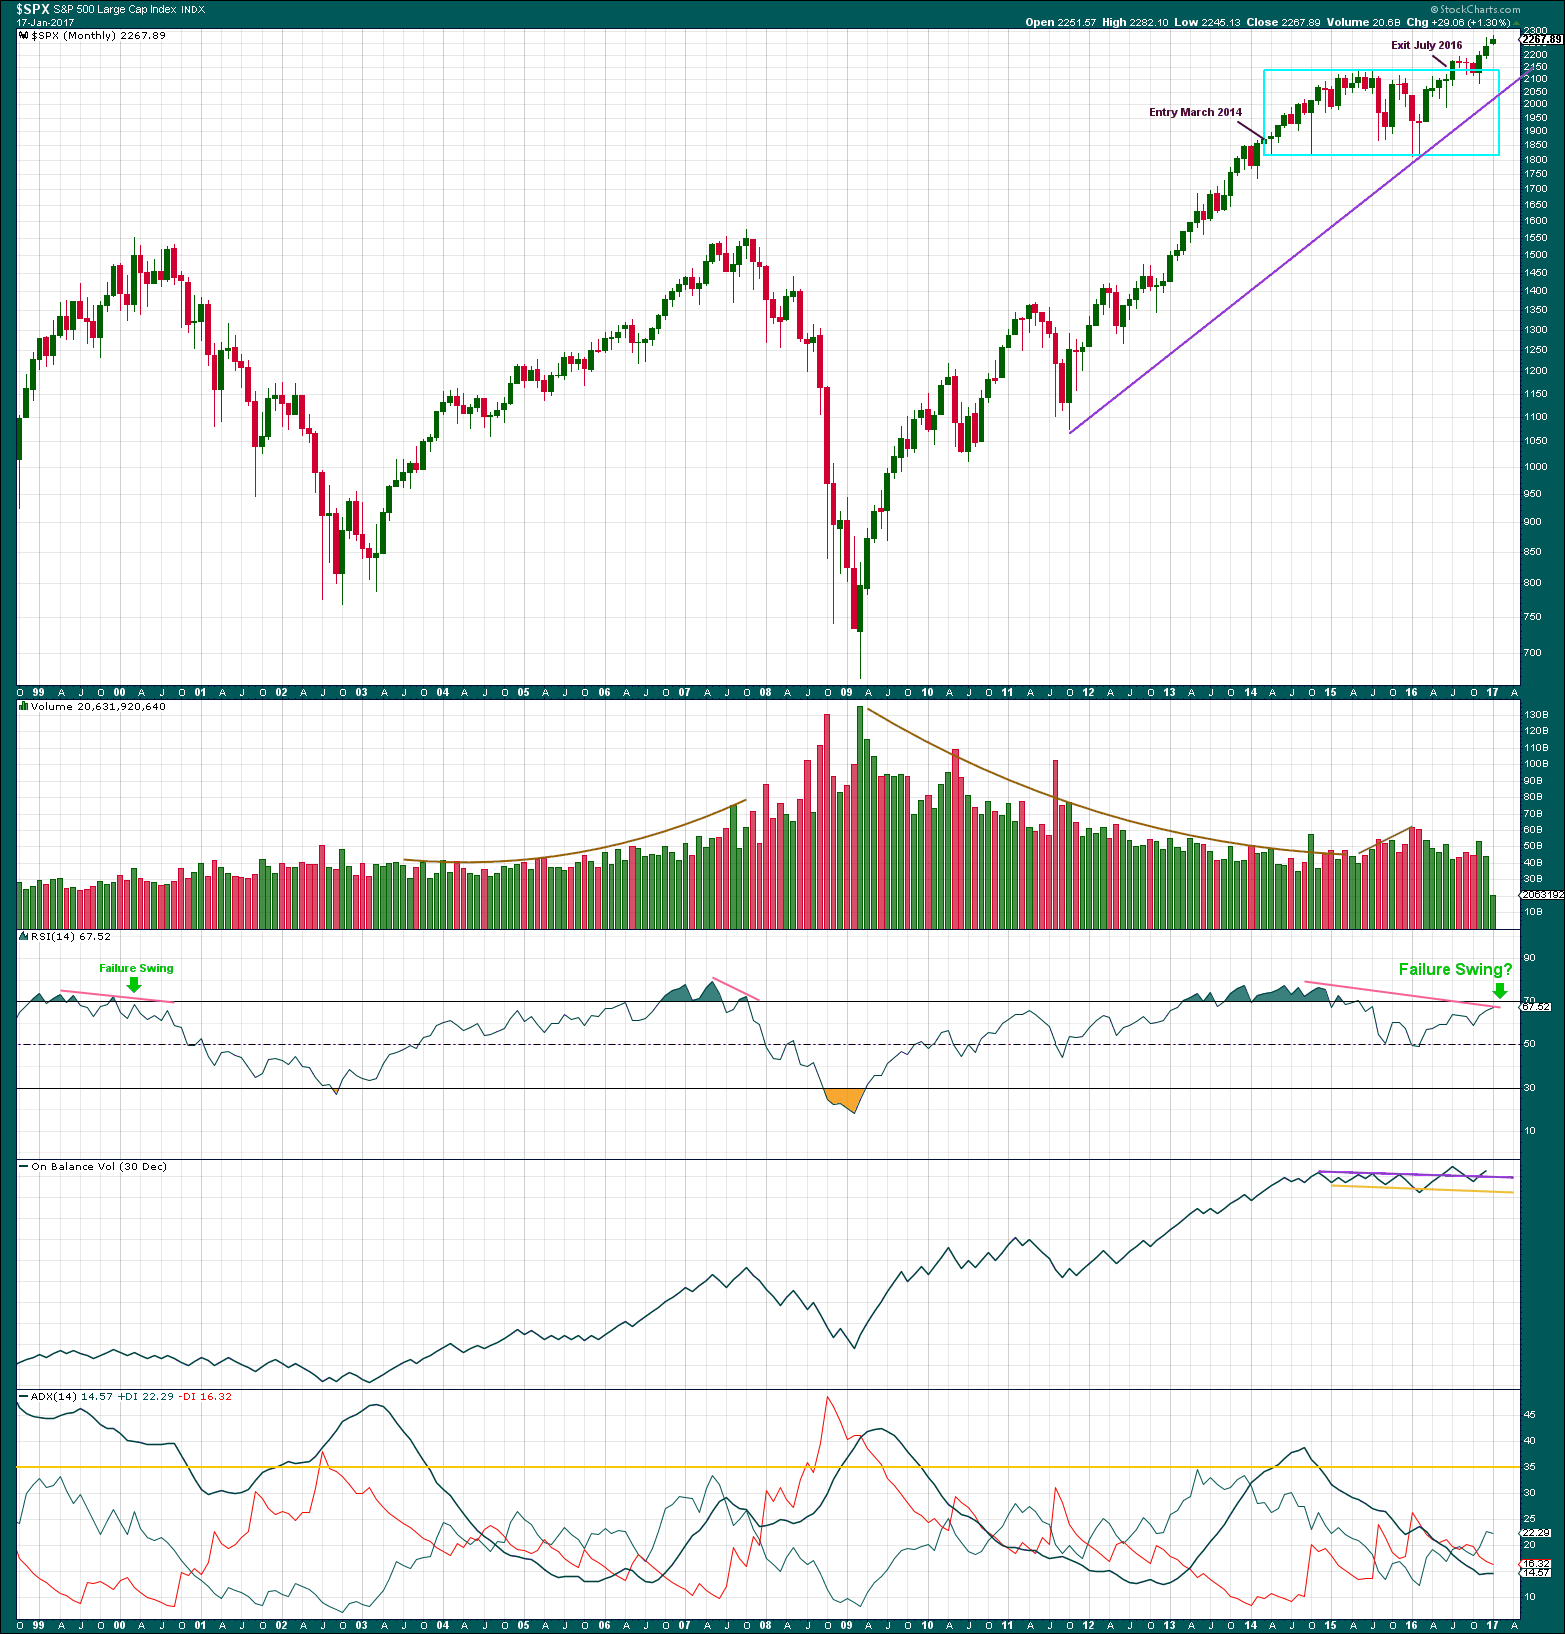
S&P500
MONTHLY CHART
Click chart to enlarge. Chart courtesy of StockCharts.com.
Magee trend lines do not work well for this market, so only one is drawn for the current bull market. This line will not be given much weight in future analysis, but it will be watched.
The last bull market exhibited support from rising volume, but this current bull market does not. Price is rising overall on declining volume, a situation which indicates a lack of participation of bulls. This has been sustained now though for some years, so it may continue for some time. What it does possibly signal is that when this market turns from bear to bull the decline may be strong and very fast.
Price exited a box which spanned 27 months (cyan box). The duration of this box suggests the following trend should also be of long duration. So far it has only lasted for a total of six months.
At the beginning of the two bear markets, shown on this chart, price and RSI exhibited multi month divergence. A failure swing was also seen prior to the DotCom crash. This may happen again, or RSI may move back into overbought. Current divergence goes back to November 2014, and it may continue for longer. This only indicates weakness in this market and cannot be useful for timing.
On Balance Volume has given two bullish signals recently with a breach of the purple trend line and a retest.
ADX was extreme at the beginning of the last two bear markets. That is not the case at this time. ADX is rising and below 15. If it rises above 15, it would indicate a long term bull trend. It remains below both directional lines, so the trend would be young.
Summary: The current bull market may continue for several months. There are signs of weakness, particularly declining volume and long term divergence between price and RSI. Investors would be wise to be cautious in this bull market.
If price breaks below long term monthly support lines and / or if ADX moves to extreme, then investors would be wise to cull underperforming stocks and tighten stops on long positions.
This analysis is published @ 04:50 p.m. EST.
Thanks for the new updates Lara. Some very profound reflections raised regarding your comments on the utility of technical weakness in chart analysis as being predictive of future market direction. We do know from experience that technical weakness and divergences can persist for quite a long time before a market actually turns, years even. We certainly saw dramatic examples of this last year when the markets, against all expectations roared to new highs, and that despite persistent low volume, lagging breadth. and a host of other technical divergences, not the least of which was a Dow theory non-confirmation that went back to 2014! I remember one analyst in particular completely dismissing the possibility of new ATHs as he maintained confidently that transports would have to reverse such a large decline to join the fray as to make that virtually impossible, which of course is exactly what they did- against all (reasonable?) expectations.
This brings me to the million dollar question, namely, does an absence of technical weakness therefore necessarily mean that a market turn is in the distant future? It would be really interesting to see if the data shows that EVERY previous market turn has always been preceded by technical weakness.
Kimble posted a quite interesting chart regarding the transports particularly, which you cite as currently showing the most bearishness. He notes the remarkable similar behaviour in the transports during the two previous topping processes in 1999 and 2008, when they came back from fairly steep declines and appeared on the verge of breaking out of double tops. As the saying goes, while history does not always repeat, it frequently rhymes. Maybe this chart is telling us something important.
“does an absence of technical weakness therefore necessarily mean that a market turn is in the distant future?”
I don’t think so.
Just as divergence can persist for very long periods of time, occasionally it can exist for relatively short periods of time before a turn from bull to bear.
Example: At the start of the bear market from 2007 to 2009, at the point of October 2007 at the market peak, there was increasing volume to support the rise in price (bullish), On Balance Volume was bullish, ADX had not reached extreme levels of 35 but was declining and above both directional indicators (somewhat bearish) and price was above a support trend line. Overall the only real bearishness came from a single divergence with price and RSI spanning only 3 months.
It would have been remarkably hard to pick that high. Really, only the month of January 2008 would have provided reasonable indication of a larger turn.
Dow Theory would have seen a turn in the S&P in the month of January 2008, in that month DJIA and DJT would also have made major new lows providing Dow Theory confirmation .
But this would have been followed by a non confirmation from DJT as it then went on to make it’s last final high in May 2008.
Final Dow Theory confirmation of the bear market of the GFC would only have come in October 2008 as DJT finally made a new low below it’s prior major low.
And that would have been very late within the bear market, only five months before the end of it.
I really wish I could go back to the year of 1929 and look at price and volume data with these indicators and see what happened there. I think there would be very valuable lessons in that data.
I have taken some time to look at what happened just before the October 1897 crash. I’ll do my next in-depth analysis of that data.