
Summary: The USD index is in a bull market. A short term correction looks like it may have just ended. The target for the next wave up to end is about 105.98. If the correction deepens, it should not move below 97.56.
ELLIOTT WAVE ANALYSIS
MONTHLY CHART
Click chart to enlarge.
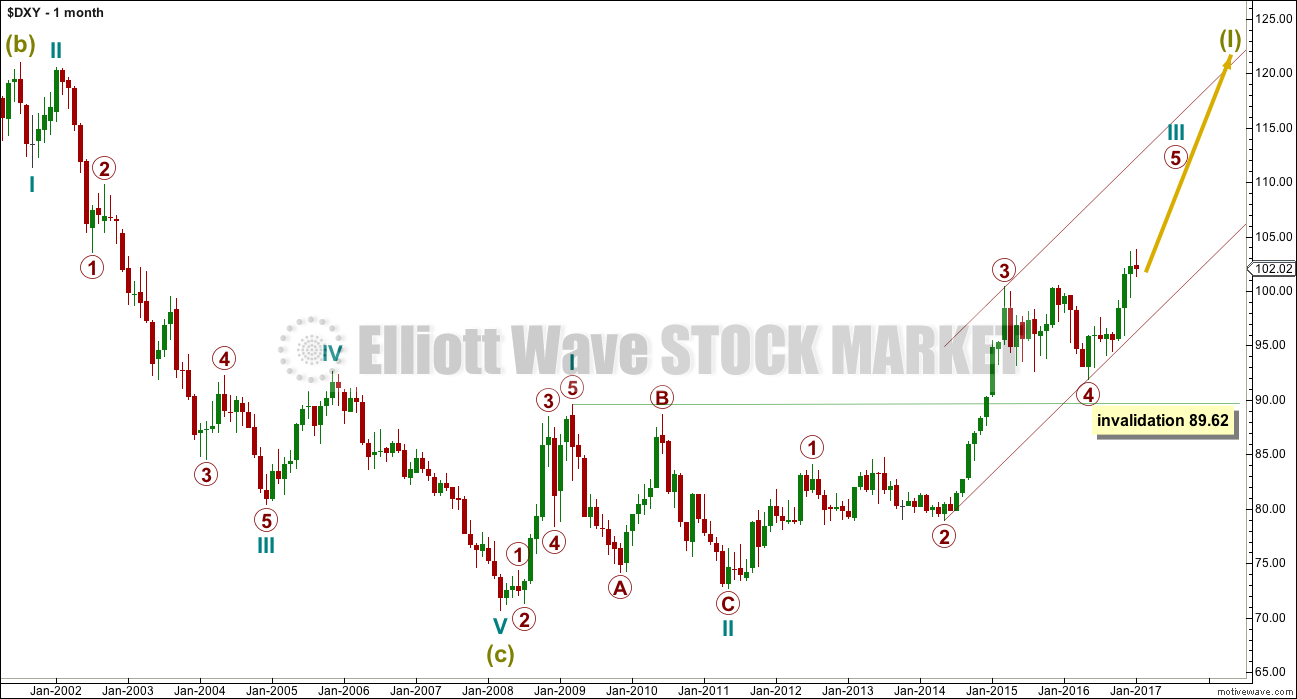
This Elliott wave count sees the USD index in a new bull market to last generations.
The bull market began with two overlapping first and second waves labelled cycle waves I and II, and primary waves 1 and 2.
Within cycle wave III, the final fifth wave up is underway for primary wave 5. When cycle wave III is complete, the following correction for cycle wave IV may not move back into cycle wave I price territory below 89.62.
WEEKLY CHART
Click chart to enlarge.
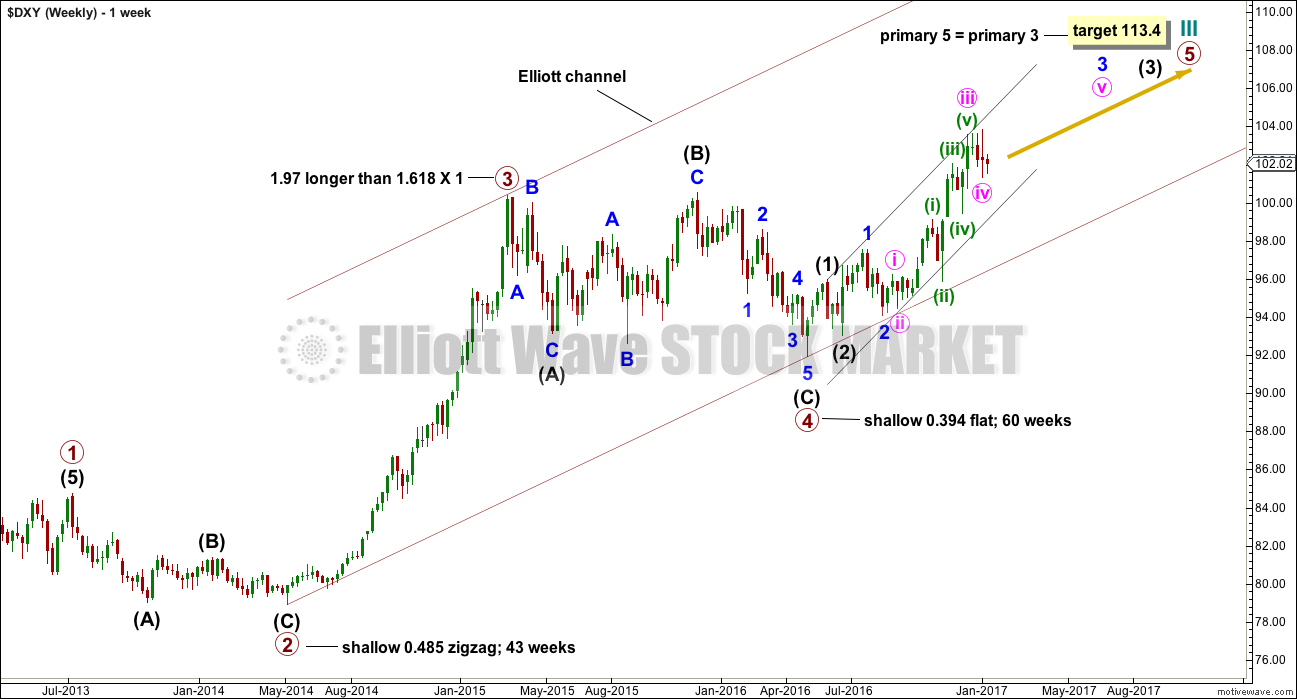
The Elliott channel is drawn using Elliott’s second technique. Primary wave 5 may end either about the mid line or about the upper edge.
Primary wave 5 is very close to equality in length with primary wave 1. The structure is not close to completion though, so the Fibonacci ratio applied to the target is equality with primary wave 3 for this reason.
DAILY CHART
Click chart to enlarge.
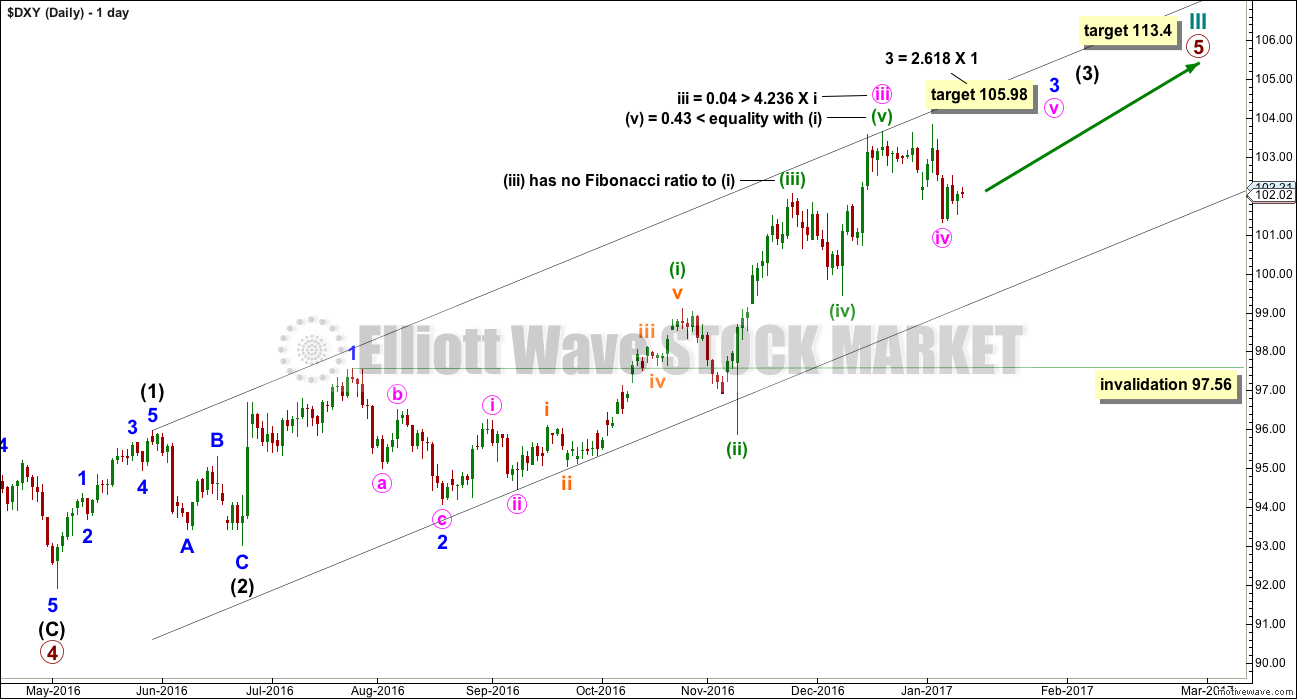
The daily chart shows the detail of the final fifth wave of primary wave 5. When this is complete, then the larger impulse for cycle wave III would be complete.
Upwards movement is expected from here to complete minor wave 3 at the target calculated.
When minor wave 3 is complete, then another correction for minor wave 4 would be expected. It may not move into minor wave 1 price territory below 97.56.
The black channel is an acceleration channel drawn as a best fit. Deeper corrections along the way up may find support about the lower edge.
TECHNICAL ANALYSIS
MONTHLY CHART
Click chart to enlarge. Chart courtesy of StockCharts.com.
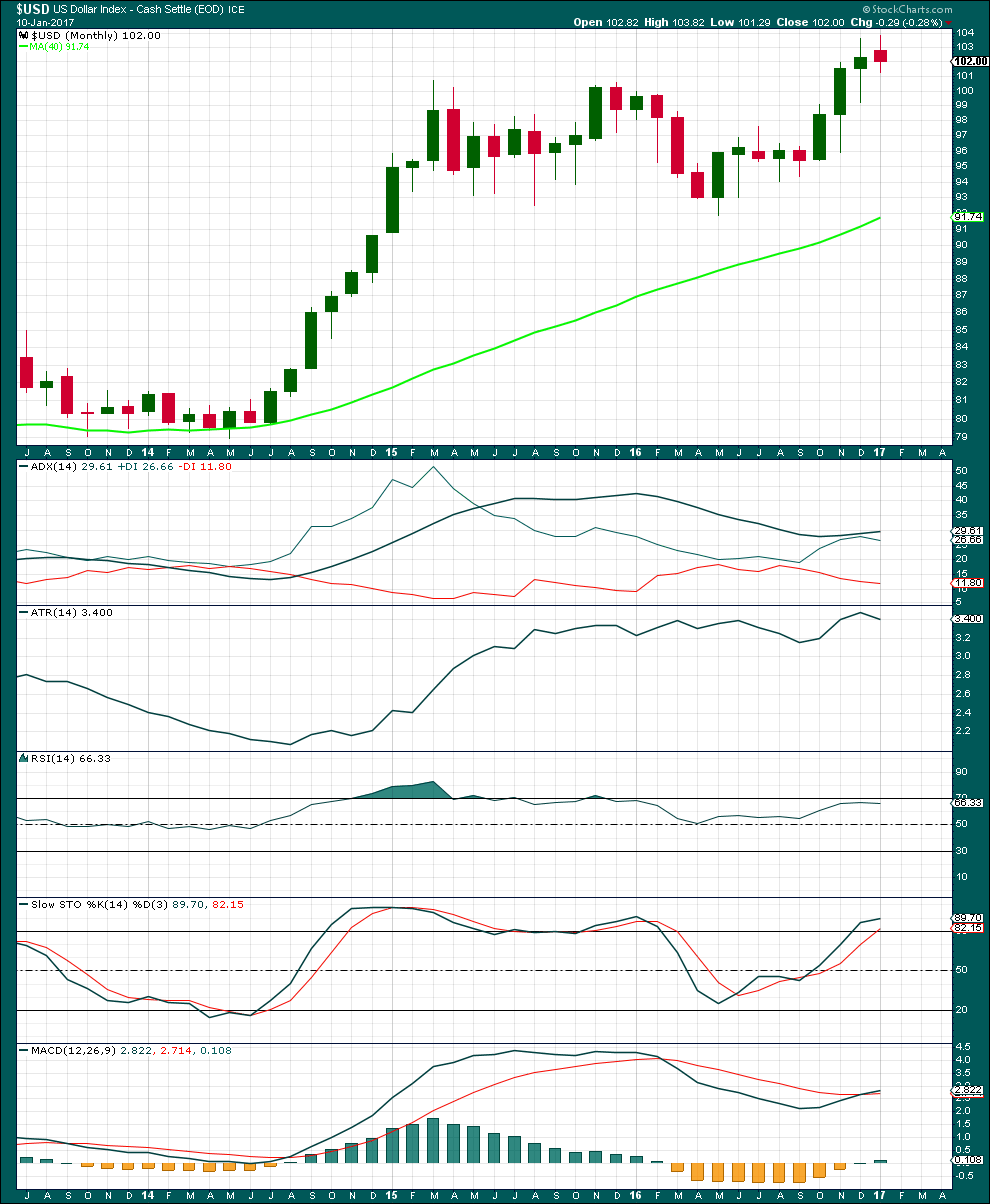
The longer term picture sees USD index still within an upwards trend.
ADX is still rising and the +DX line is above the -DX line. An upwards trend is indicated. ADX is not yet at 35, so there is room for the trend to continue. The black ADX line is above both +DX and -DX lines though, so this trend is entering extreme territory.
ATR is overall slowly rising, indicating some health still within this trend.
RSI exhibits long term divergence with price at the last high. This trend is extreme.
Stochastics is overbought and also exhibits divergence with price.
MACD is bullish at the monthly chart level. It also exhibits strong divergence with price.
The trend is entering extreme territory, so look out for signals for it to end. But there is still room for price to continue higher.
DAILY CHART
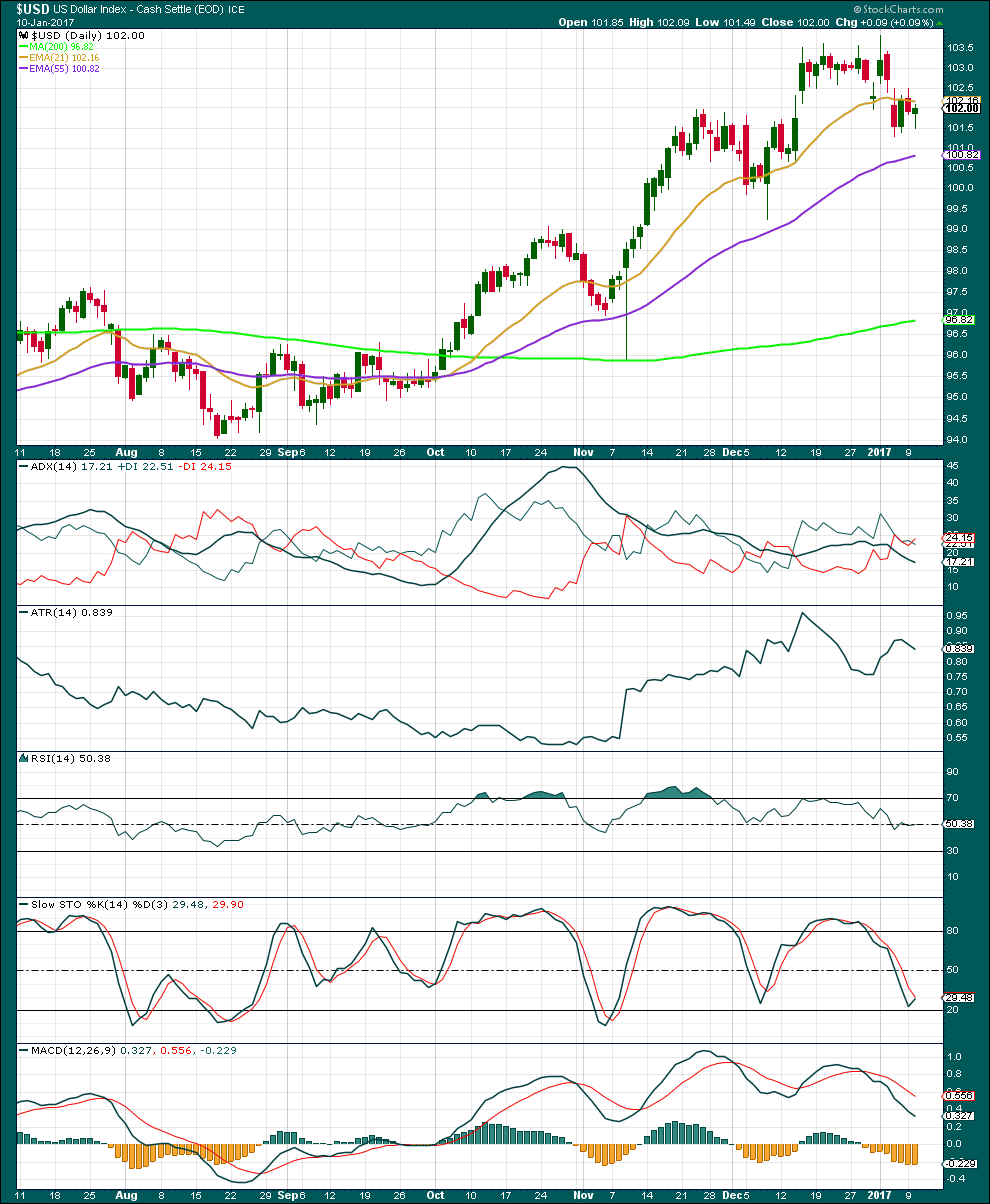
Click chart to enlarge. Chart courtesy of StockCharts.com.
Price has been finding support for deeper corrections close to the mid term Fibonacci 55 day moving average since the trend resumed in August 2016.
The mid term Fibonacci 55 day moving average is pointing up, as is the long term 200 day moving average. The trend is still indicated as upwards.
The short term average is above both mid and long term averages. The short term average has turned downwards indicating a short term consolidation within the trend.
ADX is declining and is below 20. The black ADX line is below both the +DX and -DX lines. A consolidation is indicated. If the black ADX line turns upwards from here, then a new upwards wave would be indicated.
ATR has been showing some increase in recent days. A new wave up may be beginning.
RSI is neutral. There is plenty of room for price to rise or fall.
Stochastics is close to oversold but not extreme. This may offer support for price; the last time this happened price turned upwards. Look out for that to possibly happen again here.
For the short term MACD is bearish. It also exhibits divergence with price at the last highs indicating some weakness to the last wave up.
Overall, this analysis fits the Elliott wave count. As price moves past the middle of a third wave and into a series of fourth wave corrections and final fifth waves up, some weakness and divergence would be expected. In the short term, it looks like Stochastics may be a useful guide to signal when price may turn within a few days. It looks like price may be expected to turn up about here.
This analysis is published @ 01:35 a.m. EST.
thanks Lara. I have been a dollar bull for 2 years. Scaled some recently. Should it be assumed that gold will go lower than(in dollar terms)?
No. Don’t assume a relationship between the two.
Here’s a chart of USD overlaid with Gold, flipped vertically. Going back to 1982.
If they are inversely correlated both sets of bars should rise and fall together. But as you can see there are periods of time when they just don’t behave like that, and those periods can span months or years.
Look also at major highs and lows for each market. They don’t turn together. In fact, they usually turn months apart even when the inverse correlation is relatively strong.
So my conclusion would be that decisions on wave counts or trading should not be made for one market with any analysis of the other market a deciding factor.
The date marks are for major highs / lows from one market to the other, so that you can quickly visually see that they don’t usually turn together.
Sometimes they do, like December 1987, but more often they don’t.
thanks