Downwards movement was expected for Thursday’s session.
The target at 2,190 was met and exceeded so far by 2.56 points.
Summary: The main wave count now expects upwards movement here for a fifth wave to end a third wave. The target is at 2,226 – 2,227.
Last monthly chart for the main wave count is here.
Last weekly chart is here.
New updates to this analysis are in bold.
MAIN WAVE COUNT
DAILY CHART
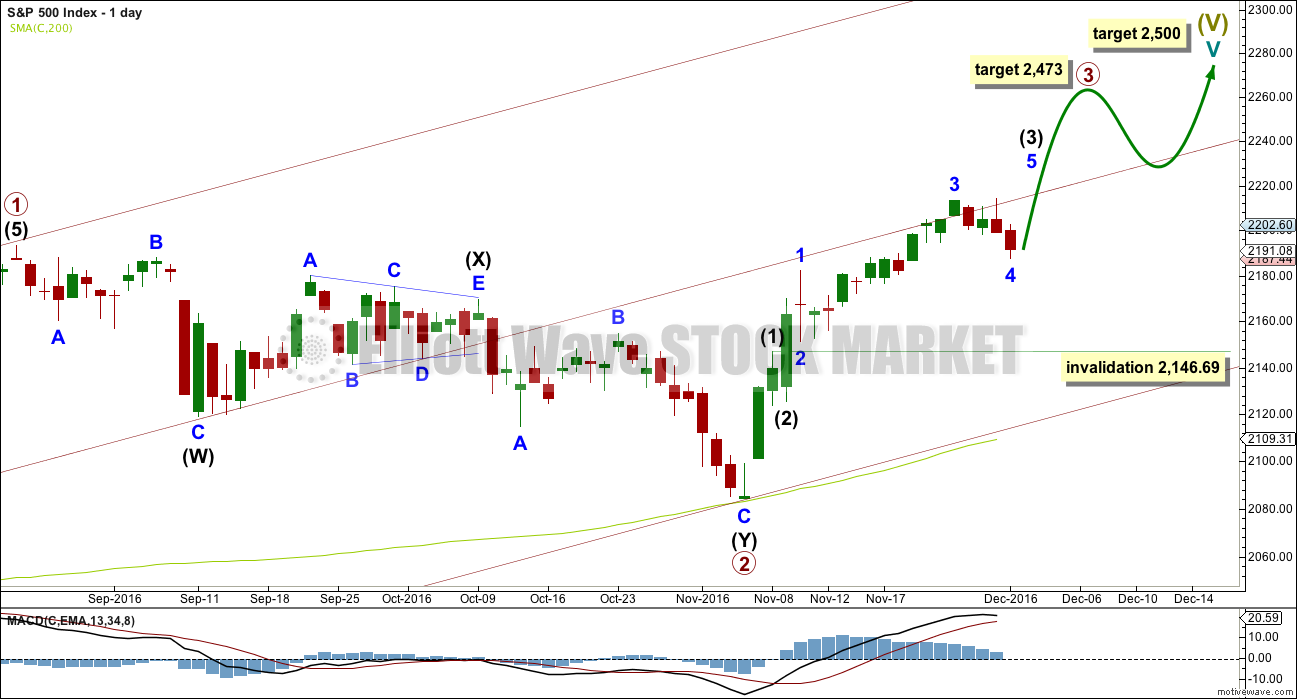
Cycle wave V must subdivide as a five wave structure. At 2,500 it would reach equality in length with cycle wave I. This is the most common Fibonacci ratio for a fifth wave for this market, so this target should have a reasonable probability.
Cycle wave V within Super Cycle wave (V) should exhibit internal weakness. At its end, it should exhibit strong multiple divergence at highs.
Within cycle wave V, primary waves 1 and 2 may be complete. Primary wave 3 may be over halfway through and is so far exhibiting weaker momentum than primary wave 1, which fits with the larger picture of expected weakness for this fifth wave at cycle degree. It is possible primary wave 3 may fall short of the target and not reach equality in length with primary wave 1.
Within primary wave 3, the upcoming correction for intermediate wave (4) should be relatively brief and shallow. Intermediate wave (1) was over very quickly within one day. Intermediate wave (4) may last a little longer, perhaps two or three days, and may not move into intermediate wave (1) price territory below 2,146.69.
At 2,473 primary wave 3 would reach equality in length with primary wave 1. This Fibonacci ratio is chosen for this target calculation because it fits with the higher target at 2,500.
When primary wave 3 is complete, then the following correction for primary wave 4 may last about one to three months and should be a very shallow correction remaining above primary wave 1 price territory.
The maroon channel is redrawn as a base channel about primary waves 1 and 2. Draw the first trend line from the start of primary wave 1 at the low of 1,810.10 on the 11th of February, 2016, then place a parallel copy on the high of primary wave 1. Add a mid line, which has shown about where price has been finding support and resistance.
HOURLY CHART
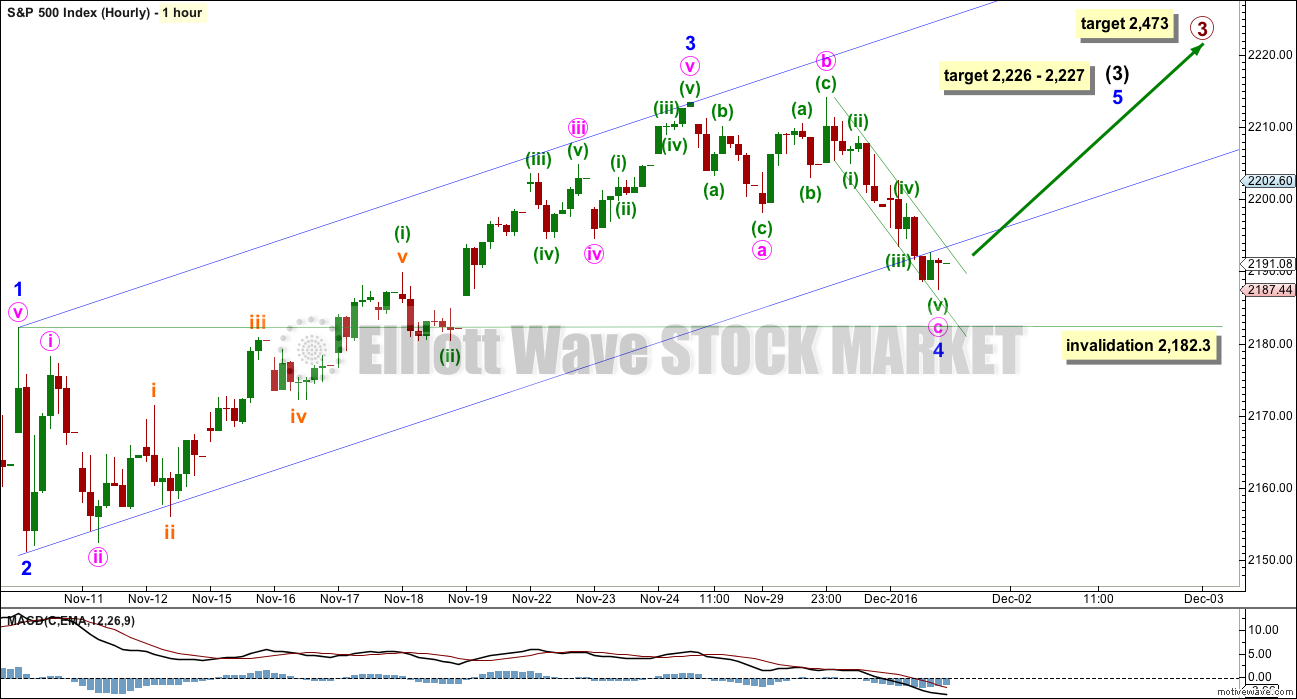
At 2,227 intermediate wave (3) would reach 1.618 the length of intermediate wave (1).
Now within intermediate wave (3), at 2,226 minor wave 5 would reach 0.618 the length of minor wave 3. This gives a 1 point target zone calculated at two degrees.
This wave count sees the middle of a third wave particularly weak; this is not common. The larger context of a fifth wave at cycle and Super Cycle degrees may see persistent unusual weakness though, so this wave count is possible.
At this stage, it looks like minor wave 4 has completed as a very common expanded flat correction. Minute wave c is 2.07 points longer than 1.618 the length of minute wave a.
Expanded flats do not fit into trend channels. Use a smaller channel about minute wave c. When price breaks above the upper edge of this small green channel, then it should be indicating minute wave c is complete.
At that stage, it would be most likely that minor wave 4 should be complete. It would be possible that minor wave 4 could continue further sideways as a double flat or double combination, but that would see it grossly disproportionate to minor wave 2 and the rest of intermediate wave (3), so this possibility has a very low probability.
While price remains within the narrow green channel, it must be accepted that there is no indication of a low in place for minor wave 4. Minor wave 4 may continue lower.
Minor wave 4 may not move into minor wave 1 price territory below 2,182.30.
The wider blue channel is drawn using Elliott’s technique. Draw the first trend line from the ends of minor waves 1 to 3, then place a parallel copy on the end of minor wave 2. Minor wave 4 has slightly breached the channel; sometimes fourth waves behave like this. If the breach develops further, then the channel should be redrawn.
The S&P often forms slow rounded tops. When it does this the many subdivisions make analysis difficult. Only when support is breached by movement that is clearly downwards and not sideways would it be an indication of a deeper pullback.
ALTERNATE WAVE COUNT
DAILY CHART
There is a wave count that fits for the Dow Industrials that sees an imminent trend change. It relies upon an ending diagonal, but that idea will not fit well for the S&P.
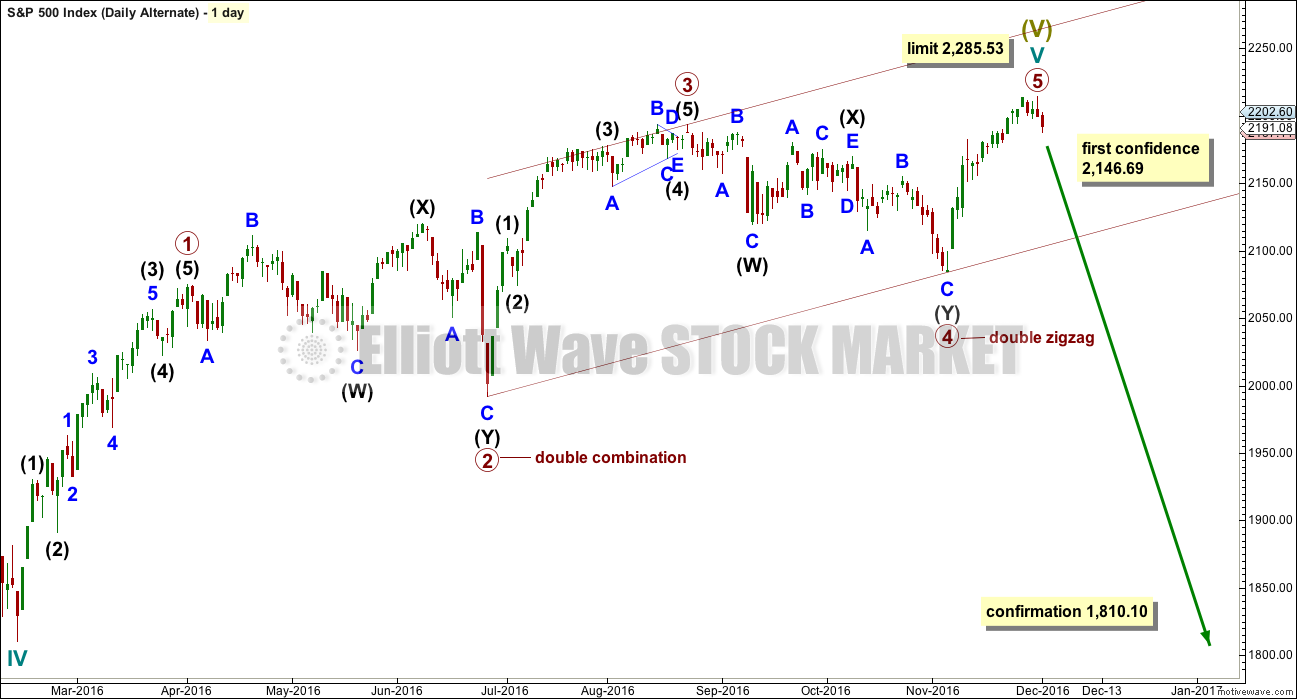
What if an impulse upwards is now complete? The large corrections labelled primary waves 2 and 4 do look like they should be labelled at the same degree as each other, so that gives this wave count the right look.
Primary wave 4 ends within primary wave 2 price territory, but it does not overlap primary wave 1. Primary wave 1 has its high at 2,057 and primary wave 4 has its low at 2,083.79. The rule is met.
There is alternation between the double combination of primary wave 2 and the double zigzag of primary wave 4. Even though both are labelled as multiples W-X-Y, these are different structures belonging to different groups of corrective structures.
Primary wave 3 is shorter than primary wave 1. This limits primary wave 5 to no longer than equality with primary wave 3 at 2,285.53.
The equivalent wave count for DJIA expects an end now to upwards movement and the start of a large bear market. Only for that reason will this alternate for the S&P also expect a reversal here.
This wave count has good proportions. Primary wave 1 lasted a Fibonacci 34 days, primary wave 2 lasted 60 days, primary wave 3 lasted 40 days, and primary wave 4 lasted 52 days. Primary wave 5 may be more brief than primary wave 3. If it exhibits a Fibonacci duration, it may total a Fibonacci 34 days and that would see it end on the 22nd of December. If it is only a Fibonacci 21 days in duration, it may end more quickly on the 2nd of December.
DOW JONES INDUSTRIALS
DAILY CHART
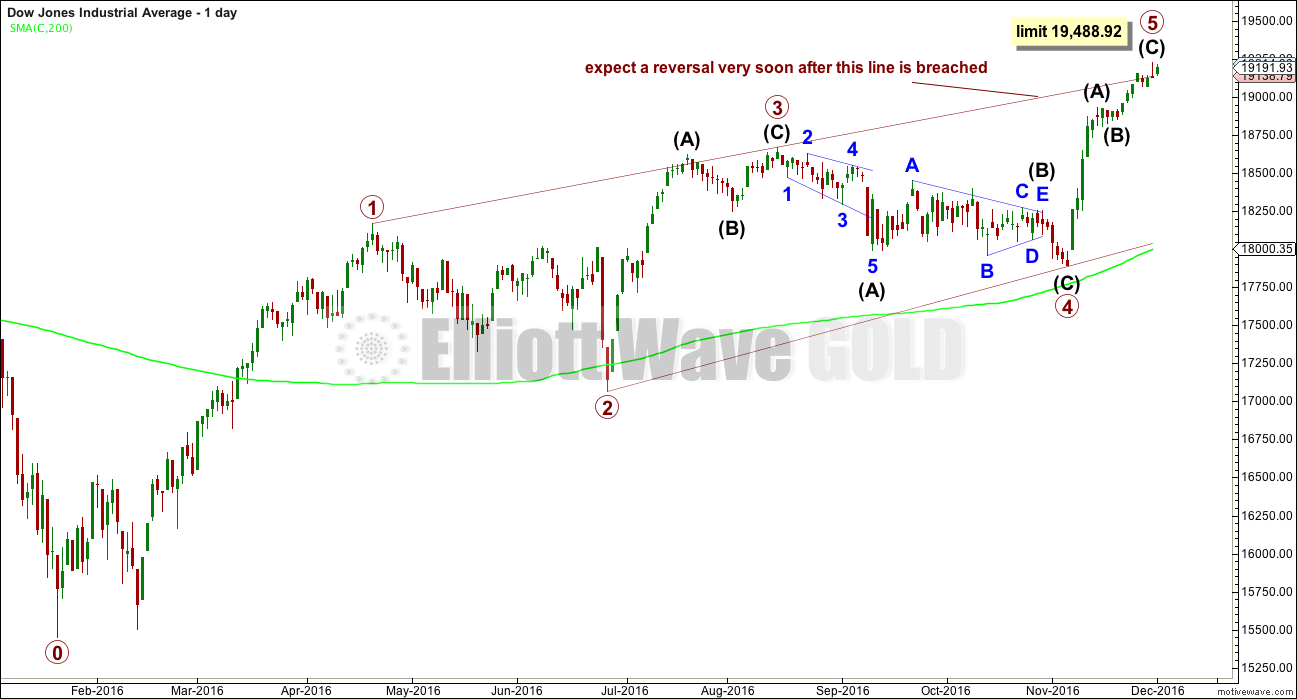
An ending contracting diagonal may be complete for the DJIA. This fits into the same picture as the alternate wave count for the S&P; both see a final fifth wave coming to an end very soon.
The 1-3 trend line is now overshot. Contracting diagonals normally end very quickly after this line is overshot, and it can be surprising how small the overshoot is. This wave count expects a very strong reversal.
Yesterday completed a gravestone doji, which is a reversal pattern. However, today completes a green daily candlestick and this may be considered to have negated the doji.
If a new high is made, then the signal from the doji has not worked. If price moves strongly lower tomorrow, then it may have.
The reversal is usually swift and strong when ending diagonals are complete. Today’s green daily candlestick does not fit this definition, so price is not behaving as expected.
The diagonal is contracting, so the final fifth wave is limited to no longer than equality in length with primary wave 3 at 19,488.92.
TECHNICAL ANALYSIS
WEEKLY CHART
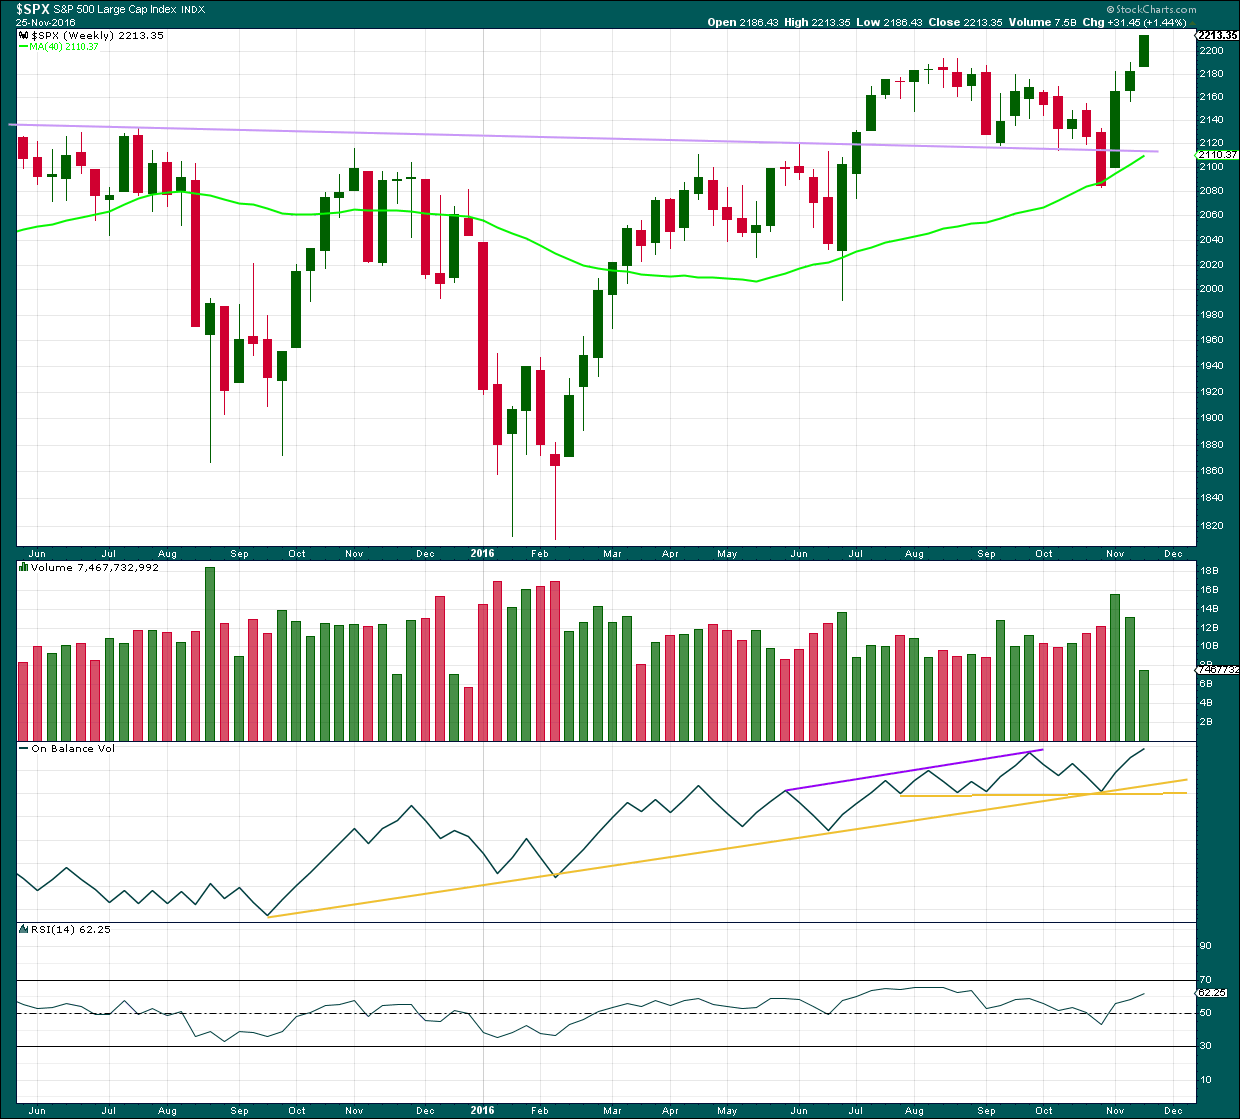
Click chart to enlarge. Chart courtesy of StockCharts.com.
Another upwards week comes with an increase in range but a strong decline in volume. This is partly due to the Thanksgiving Day holiday making this week short of one day, so not too much will be read into it.
On Balance Volume is bullish.
There is some mid term divergence between price and RSI: price is making new all time highs, but RSI is not following. This indicates weakness in price. It is not a signal of a trend change, only indication of weakness.
DAILY CHART
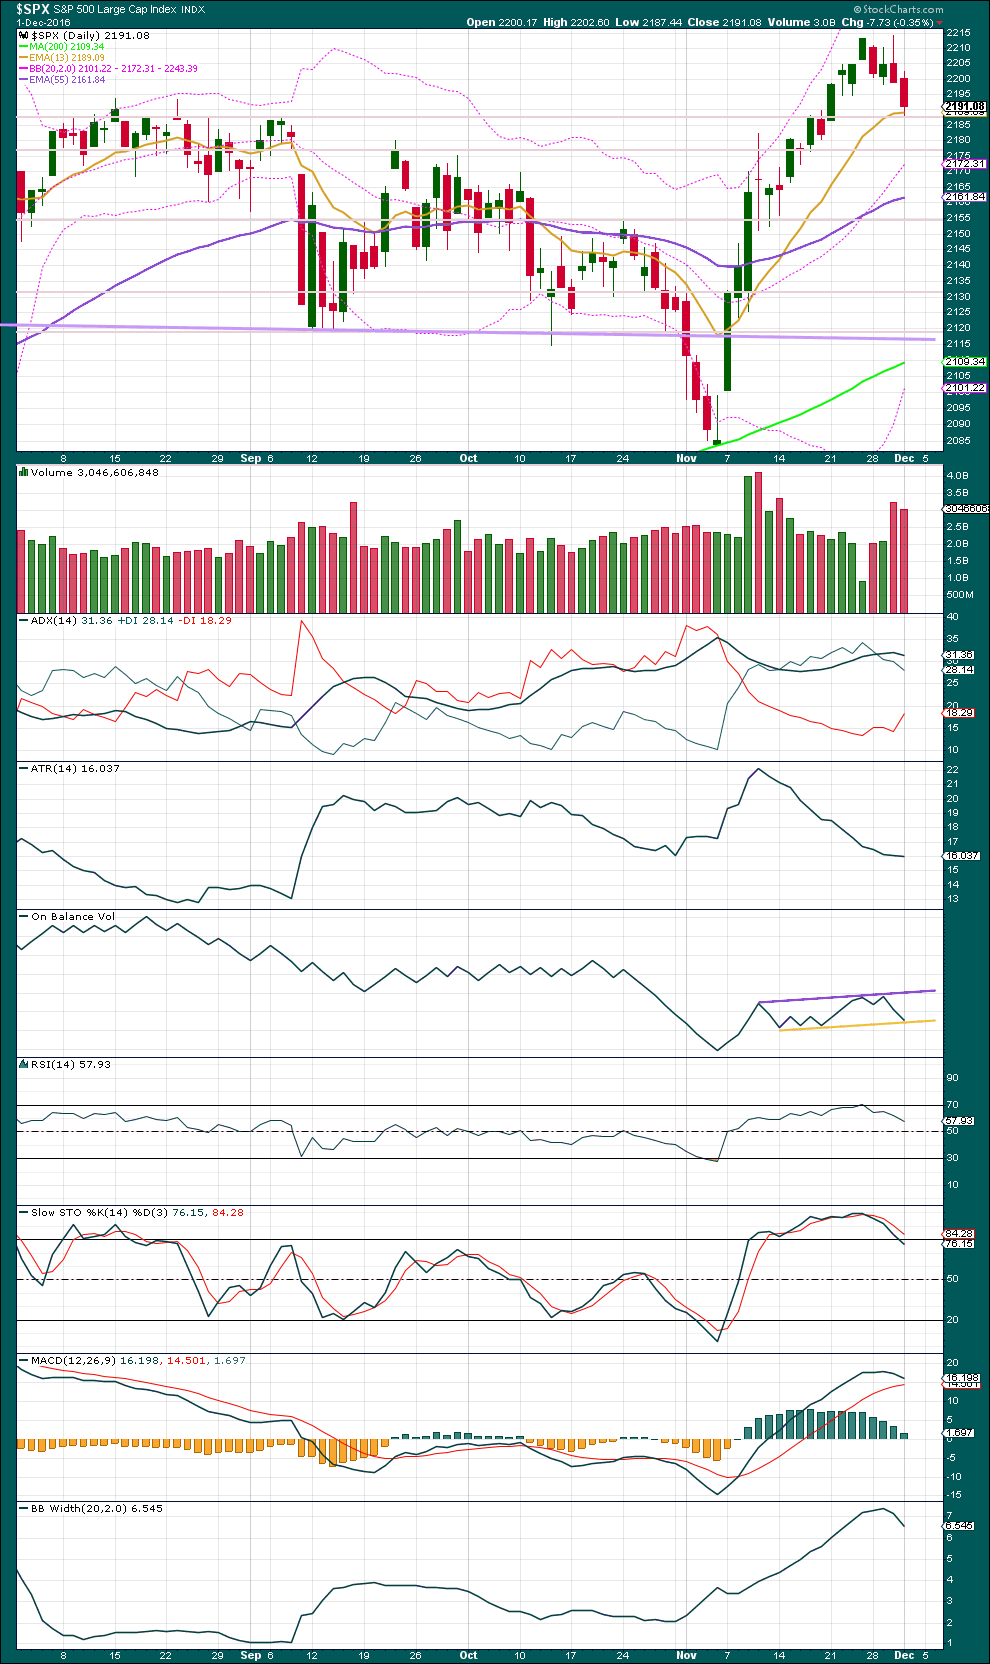
Click chart to enlarge. Chart courtesy of StockCharts.com.
Today’s red daily candlestick comes with some small decline in volume, but volume is still relatively heavy. Still, more often than not a decline in downwards volume from one day to the next has recently been followed by an upwards day. This is what should be expected as fairly likely tomorrow if the pattern persists.
ADX is now declining, indicating no clear trend. ATR is flat to declining and Bollinger Bands are contracting. All three indictors agree that the market is not currently trending. The Elliott wave count sees the last four sessions as a correction within the trend, so this agrees.
On Balance Volume is today finding support at the yellow trend line. This may assist to halt the fall in price. Price is also at support at 2,187, a prior area of resistance and support. It is also at support from the 13 day moving average.
If OBV breaks below the yellow line tomorrow, that would be a weak bearish signal. Weak only because this line has been tested only three times and is not long held.
RSI is back within neutral territory and there is plenty of room for price to rise again.
Stochastics is still not back in neutral territory though, but this oscillator may remain extreme for reasonable periods of time during a trending market.
MACD may be rolling over, but it has not turned bearish yet.
The short term average is flat today, but up to today has been rising. It remains above the mid term average, which is still rising, and both are above the long term average, which is also still rising. The trend still looks to be up, so corrections should be used as an opportunity to join the trend.
VOLATILITY – INVERTED VIX CHART
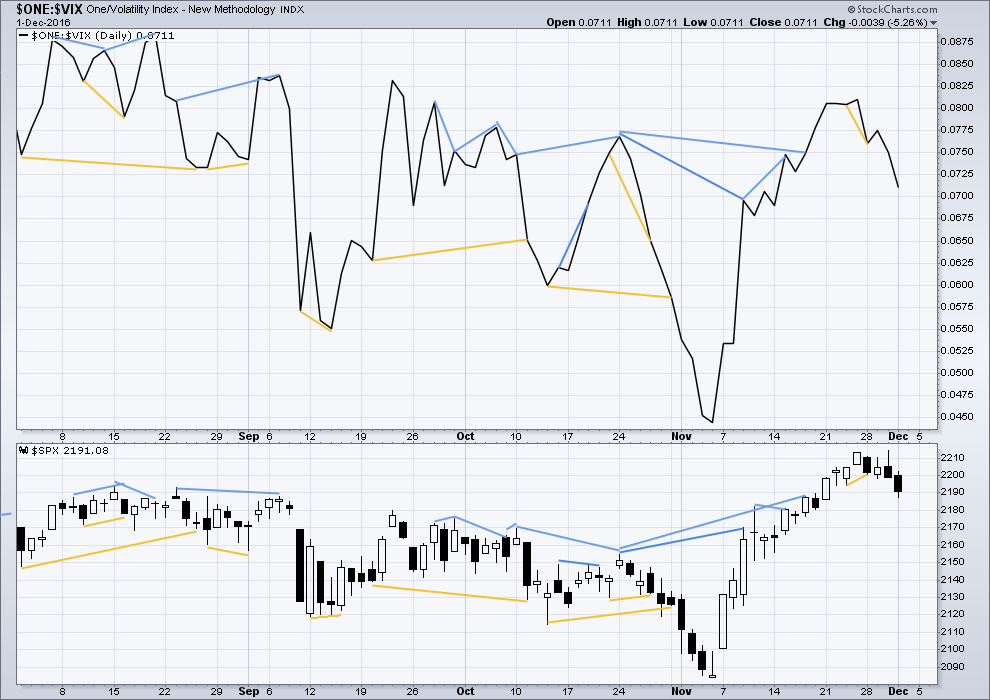
Click chart to enlarge. Chart courtesy of StockCharts.com.
There are a few instances of multi day divergence between price and inverted VIX noted here. Bearish divergence is blue. Bullish divergence is yellow. It appears so far that divergence between inverted VIX and price is again working to indicate short term movements spanning one or two days. While this seems to be working more often than not, it is not always working. As with everything in technical analysis, there is nothing that is certain. This is an exercise in probability.
There is mid term divergence between price and VIX, but no weight will be given to it because it has recently proven unreliable. There is no new short term divergence noted today between price and inverted VIX as both have moved lower.
BREADTH – AD LINE
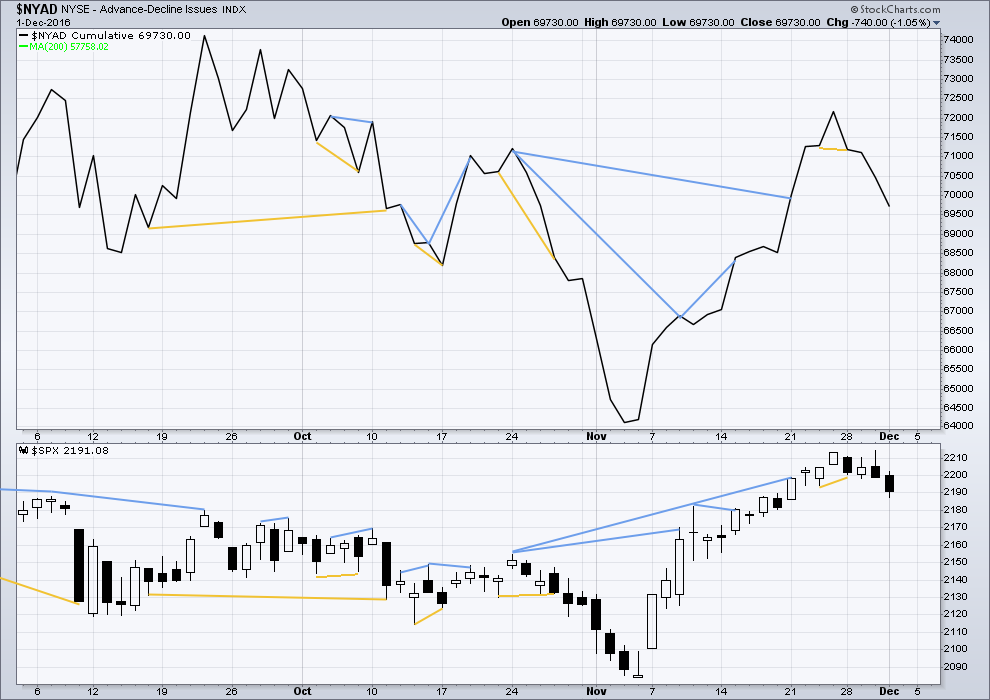
Click chart to enlarge. Chart courtesy of StockCharts.com.
Short term bullish and bearish divergence is again working between price and the AD line to show the direction for the following one or two days.
There is longer term divergence between price and the AD line, but like inverted VIX this has proven reasonably recently to be unreliable. It will be given no weight here.
Yesterday’s single day bearish divergence between price and the AD line may now be resolved by a reasonable downwards day.
While there is mid term divergence between price and the AD line, it will be given no weight in this analysis as it has proven to be recently unreliable. No new short term divergence is noted today.
DOW THEORY
Major lows within the old bull market:
DJIA: 15,855.12 (15th October, 2014) – closed below on 25th August, 2015.
DJT: 7,700.49 (12th October, 2014) – closed below on 24th August, 2015.
S&P500: 1,821.61 (15th October, 2014) – has not closed below this point yet.
Nasdaq: 4,117.84 (15th October, 2014) – has not closed below this point yet.
Major highs within the bear market from November 2014:
DJIA: 17,977.85 (4th November, 2015) – closed above on 18th April, 2016.
DJT: 8,358.20 (20th November, 2015) – closed above this point on the 9th of November, 2016.
S&P500: 2,116.48 (3rd November, 2015) – closed above this point on 8th June, 2016.
Nasdaq: 5,176.77 (2nd December, 2015) – closed above this point on 1st August, 2016.
Dow Theory Conclusion: The transportations indicate an end to the prior bear market. The transportation index confirms a bull market.
This analysis is published @ 09:15 p.m. EST.

Just talking outloud and could be totally wrong, but I’m looking for the bottom of wave 4 to end around the 2155-2170 area, which is where the hourly 200sma should coincide.
The problem with that idea is that wave four would intrude into wave one territory as currently labeled and invalidate the wave count. EWI made the very interesting point that the move up off the November lows in the Nasdaq 100 is in three waves and was therefore corrective. They expect the next move down to take out the November lows. Unless the markets are incredibly fractured this would have some big implications for the counts in the other indices if they also took out their November 4 lows on the next move down.
Good point Vern. I will definitely look back at my charts tomorrow and see what I come up with. Always good to have different set of eyes.
Continuing the discussion over the decision of India to ban its largest denominated notes that Sundeep and I have been having, I was a bit puzzled as to the reason for the widely reported shortage of cash in the country. After all most of us in the US don’t run around with lots of 100 dollar bills in our wallets. Well, as it turns out, the notes that were banned amounted to over 80% of the cash circulating in the country! No wonder there was an incredible cash crunch!
Sundeep did point out some reasons for why they did what they did that are certainly understandable. I have to say that this new bit of info seems to me to make the decision even more arbitrary and reckless. Granted all the reasons Modi had for out-lawing the old notes, the decision should have been taken gradually so as to avoid the incredible chaos poor Indians scrambling to raise cash are now facing. I still think it was a poorly thought out, and even more poorly executed scheme. I am trying to imagine what would happen in the US if 80% of the cash in circulation were removed over a few weeks. It would probably crash the economy, the widespread use of credit cards notwithstanding. Just my two rupees! 🙂
I don’t know, the long wicks on the candles are very bearish for a fourth wave. Perhaps this is the beginning of a trend change with a leading diagonal?
I would think that the long upper wicks of 29th and 30th of November may now be resolved with a good red candlestick for the 1st of December.
With the 2nd of December a small green doji it seems the bears have stalled here.
So far every time I revert to a leading diagonal for a new wave down (for a possible big bear market) it’s wrong. I’m so wary of them now.
I think when the bear arrives he shall make his presence known quickly, and we won’t have doubts.
It does look today like minor 4 has ended and minor 5 up has begun.
Redraw the channel now using Elliott’s second technique. Shown here. The lower edge should provide support, but just remember that the S&P doesn’t always play nicely with it’s trend channels.
Opened STC order on another ten contracts at limit of 1.50….
If VIX moves above 14.72 before the close we have the potential for a bullish engulfing candlestick. Volume needs to pick up a bit to fill out the body of the candle.
I don’t get the complacency. It is truly insane! 🙂
If today prints another green VIX daily candlestick then it would make a three white soldiers pattern with the two candlesticks prior.
Yep! A marching we will go…a marching…well, you know! 🙂
Verne, you never fail to make me laugh 🙂
I’m off to catch a quick wave in the large watery wobbly thing. Back at market close 🙂 🙂
Wave’s up!! Go get ’em! 🙂
I got ’em. Nearly got a barrel today, but on pathetic 1ft waves that’s a big ask 🙂
Still, desperate east coast surfers gotta take what the surf gods send us.
It was super glassy, nice peeling little waves with a nice shape. Practicing my bottom turns, crouching down and assuming the stance to catch a barrel. If I keep doing that Cesar says one day I’ll get one 🙂
Whoa!! That’s a new one. The bid is only 0.85 (ask 1.20) and I got filled immediately.
Clearly they think it’s going higher….
Opened order to sell another 10 contracts at limit of 1.20 per contract….
Filled at 1.00 even. Is this legal??!! 🙂 🙂 🙂
Opening sell to close order on 50 contracts at limit of 1.00.
Will hold remaining calls until the close.
Adding another 50 contracts to my VIX 13.50 calls….new cost basis 0.75 per contract.
This is absolutely nuts!
What are they trying to prove??
That risk has completely disappeared from the markets??!!!
Widened my TQ stop to just above today’s high at 116.20…..
There is a monster candle on the VIX 5 min chart that took it all the way down to 12.43.
Exactly who or what is screwing around with the index I wonder?
And even more importantly why??!!
Recognizing severe market distortions can sometimes offer great trading opportunities and I keep a bit of trading capital for such occasions. For VIX to be plunging ahead of next week’s market is a classic example of how ridiculous the thesis of “efficient markets” is.
Buying next week’s expiration VIX 13.50 calls for under a buck. Hard to believe!
Talk about grossly mis-pricing risk.
I have never seen anything like this!
NDX behaving more like a wave two or four instead of the start of a new impulse up. I think the decline here at least is not quite done. Reloading triple Q shorts.
Buying next week’s expiration 155.50 puts for 0.95 per contract. Opened STC GTC order at 2.00 per contract.
Stop at 0.75
Oops! That should be 115.5 puts.
Stop at 0.75 or if price goes above 116.00
The political circus in Zimbabwe is back in full swing with new paper from the Reserve Bank of Zimbabwe. Let’s hope the citizens of the country ensure a short-lived circulation of the new garbage.
Well, the jobs report was not as dire as I anticipated and for all intents and purposes we are now at “full employment”. It would seem as if the FED has no choice but to hike now doesn’t it?
After all they are “data dependent” and the data does not get any better than “full employment”
We will probably see the “inflate the market” game for most of the trading session with a steep sell-of into the close as traders head for the hills ahead of this week end’s vote in Italy. Of course a rush for the exits could get going early…despite the futures misdirection. 🙂
The FED is in serious trouble. If they do not raise rates in December (and I am arguing that despite all the talking heads that they won’t) they will finally be unmasked as the clowns they are for all the world to see. There may be an initial fall in rates but after the extremity of the recent rate run-up is relieved the march higher will continue and the blow-up of the FED balance sheet will resume and accelerate, as well as the implosion of the global bond market. Initially, the markets will be really rattled and who knows how they will react.’
If they do raise rates, the blow-up of the FED balance sheet will continue, as well as the global bond market in a march toward exposure of the fact that the FED is actually insolvent. So what are they going to do? We may be able to get a startling example of how government fabricates statistics for its own nefarious purposes. The very best short term solution for the FED is for BLS to report a dismal jobs number this morning in an attempt to provide some cover for FED announcement of inaction. If there is an awful jobs number, we of course know that FED decision is “data dependent” and how could they possibly raise rates in the face of a weak or weakening jobs market?
As one clueless president use to say – “Wouldn’t be PRUDENT”‘
If Europe is any indication we are going lower. Who in their right mind will be long this marke over the weekend??!!
I am concerned about Obama leaving a mess for the next pres. think what happened to him in 2008. I’m thinking with all the love the dems have for the republicans a poison pill is being prepared. Caution going in to this new year.
You are definitely onto something there Dermot. Very little has been said in the press about the man’s vindictiveness, which, despite is misleading apparent amiable demeanor, is an outstanding component of his true temperament. God only knows what these folk are hatching behind the scenes but it will be apparent soon enough. Just watch!
http://pro.rickards-strategic-intelligence.com/AWN_dollarreset_0716/PAWNSB11/Full?gclid=CNOE3MmD1tACFQcmhgodIMsP_Q&h=true
Don’t know I’df this has any validity, but might have some substance