Price remains above the invalidation point on the hourly Elliott wave count.
The small downwards movement for today still fits with overall expectations.
Summary: An upwards trend is in place. Corrections are an opportunity to join the trend. A sideways correction is expected to continue for another one to two sessions; tomorrow may move price overall higher. The small correction for a fourth wave should end within 2,204.80 to 2,194.51 and may not move below 2,182.30.
Last monthly chart for the main wave count is here.
Last weekly chart is here.
New updates to this analysis are in bold.
MAIN WAVE COUNT
DAILY CHART
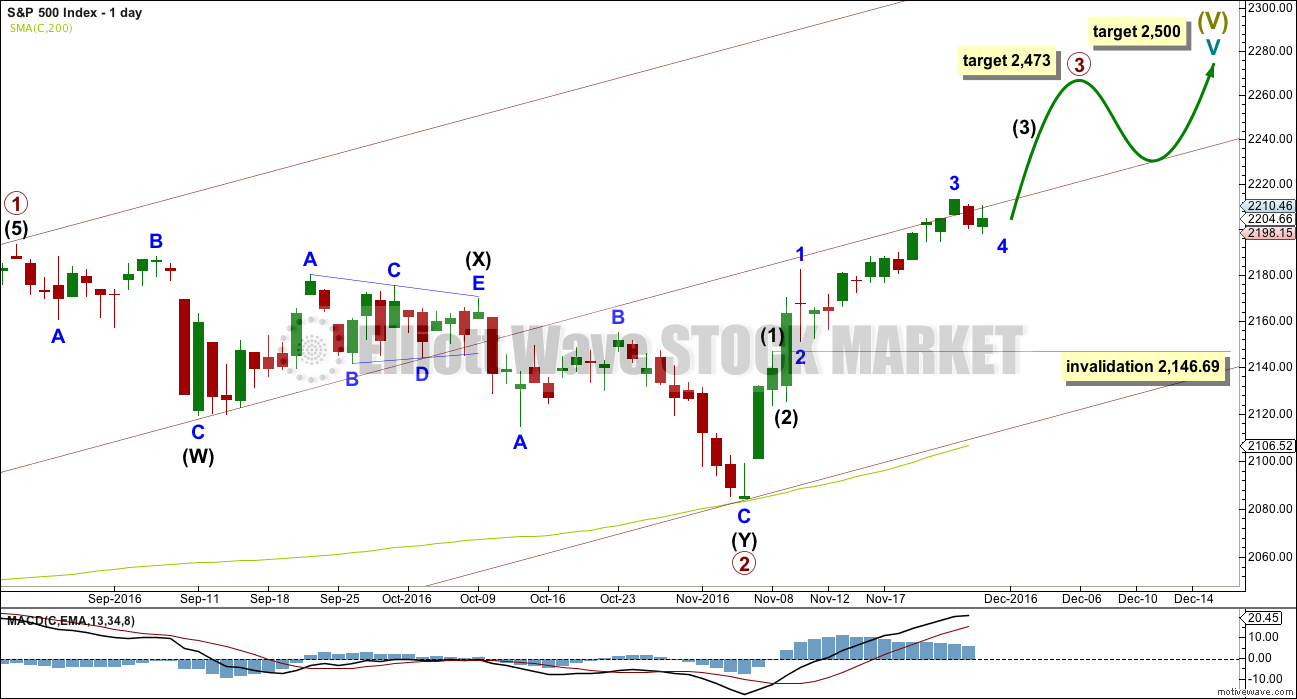
Cycle wave V must subdivide as a five wave structure. At 2,500 it would reach equality in length with cycle wave I. This is the most common Fibonacci ratio for a fifth wave for this market, so this target should have a reasonable probability.
Cycle wave V within Super Cycle wave (V) should exhibit internal weakness. At its end, it should exhibit strong multiple divergence at highs.
Within cycle wave V, primary waves 1 and 2 may be complete. Primary wave 3 may be over halfway through and is so far exhibiting weaker momentum than primary wave 1, which fits with the larger picture of expected weakness for this fifth wave at cycle degree. It is possible primary wave 3 may fall short of the target and not reach equality in length with primary wave 1.
Within primary wave 3, the upcoming correction for intermediate wave (4) should be relatively brief and shallow. Intermediate wave (1) was over very quickly within one day. Intermediate wave (4) may last a little longer, perhaps two or three days, and may not move into intermediate wave (1) price territory below 2,146.69.
At 2,473 primary wave 3 would reach equality in length with primary wave 1. This Fibonacci ratio is chosen for this target calculation because it fits with the higher target at 2,500.
When primary wave 3 is complete, then the following correction for primary wave 4 may last about one to three months and should be a very shallow correction remaining above primary wave 1 price territory.
The maroon channel is redrawn as a base channel about primary waves 1 and 2. Draw the first trend line from the start of primary wave 1 at the low of 1,810.10 on the 11th of February, 2016, then place a parallel copy on the high of primary wave 1. Add a mid line, which has shown about where price has been finding support and resistance.
HOURLY CHART
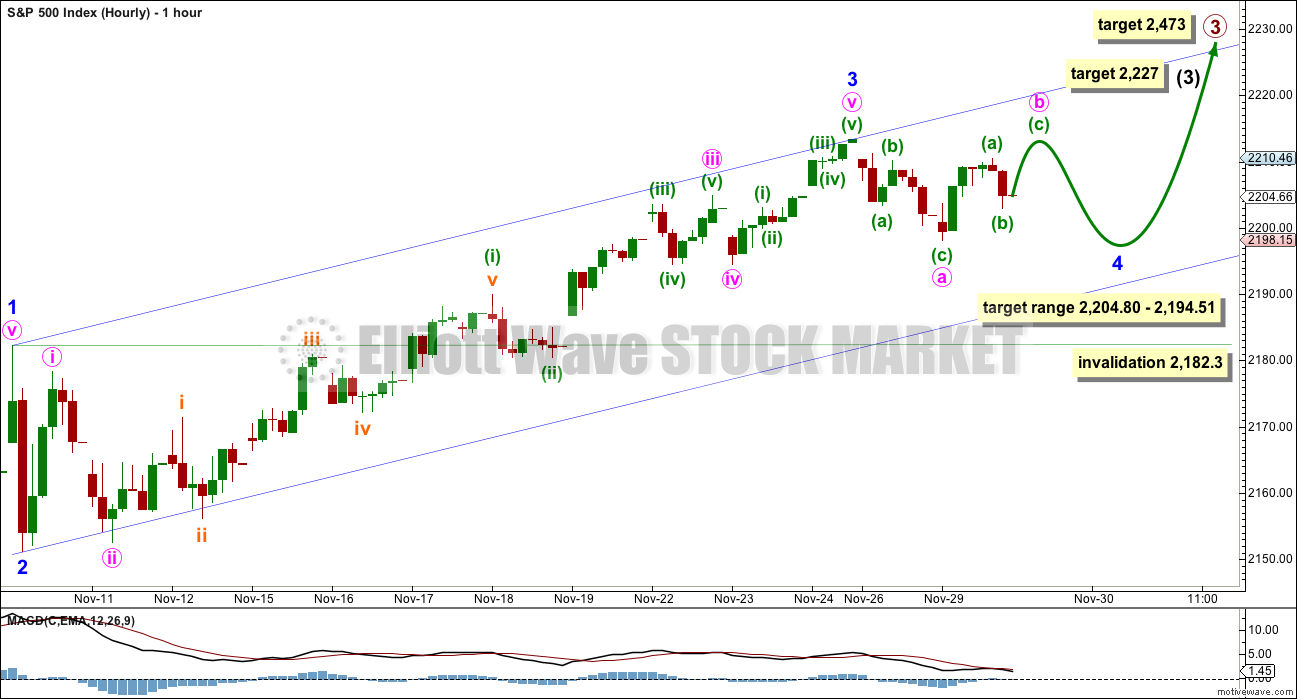
At 2,227 intermediate wave (3) would reach 1.618 the length of intermediate wave (1).
This wave count sees the middle of a third wave particularly weak; this is not common. The larger context of a fifth wave at cycle and Super Cycle degrees may see persistent unusual weakness though, so this wave count is possible.
While it is possible that minor wave 4 is over as a zigzag at the low labelled minute wave a, that would offer no alternation with the zigzag of minor wave 2. It is more likely that minor wave 4 will continue further sideways and possibly lower as a flat, combination or triangle.
If minor wave 4 is unfolding as a flat correction, then within it minute wave b must retrace a minimum 0.9 length of minute wave a at 2,211.83. The normal range for minute wave b within a flat correction for minor wave 4 would be from 1 to 1.38 the length of minute wave a, giving a range from 2,213.35 to 2,219.13.
If minor wave 4 is unfolding as a combination, then it would be relabelled minute waves w-x-y. Minute wave x of a combination may make a new high above the start of minute wave w at 2,211.83.
If minor wave 4 is unfolding as a triangle, then there is no minimum nor maximum limit for minute wave b within it. Minute wave b may make a new price extreme above the start of minute wave a at 2,211.83 as in a running triangle. A triangle would move price sideways for possibly a few more days.
Minor wave 4 may not move into minor wave 1 price territory below 2,182.30.
The channel is redrawn now using Elliott’s technique. Draw the first trend line from the ends of minor waves 1 to 3, then place a parallel copy on the end of minor wave 2. The lower edge of this channel may provide support if minor wave 4 moves lower.
It is likely that minor wave 4 will end within the price territory of the fourth wave of one lesser degree. Minute wave iv has its range from 2,204.80 to 2,194.51. Minor wave 4 is now within this territory, so if it continues the expectation would be for it to continue sideways and not substantially lower.
The S&P often forms slow rounded tops. When it does this the many subdivisions make analysis difficult. Only when support is breached by movement that is clearly downwards and not sideways would it be an indication of a deeper pullback.
ALTERNATE WAVE COUNT
DAILY CHART
There is a wave count that fits for the Dow Industrials that sees an imminent trend change. It relies upon an ending diagonal, but that idea will not fit well for the S&P.
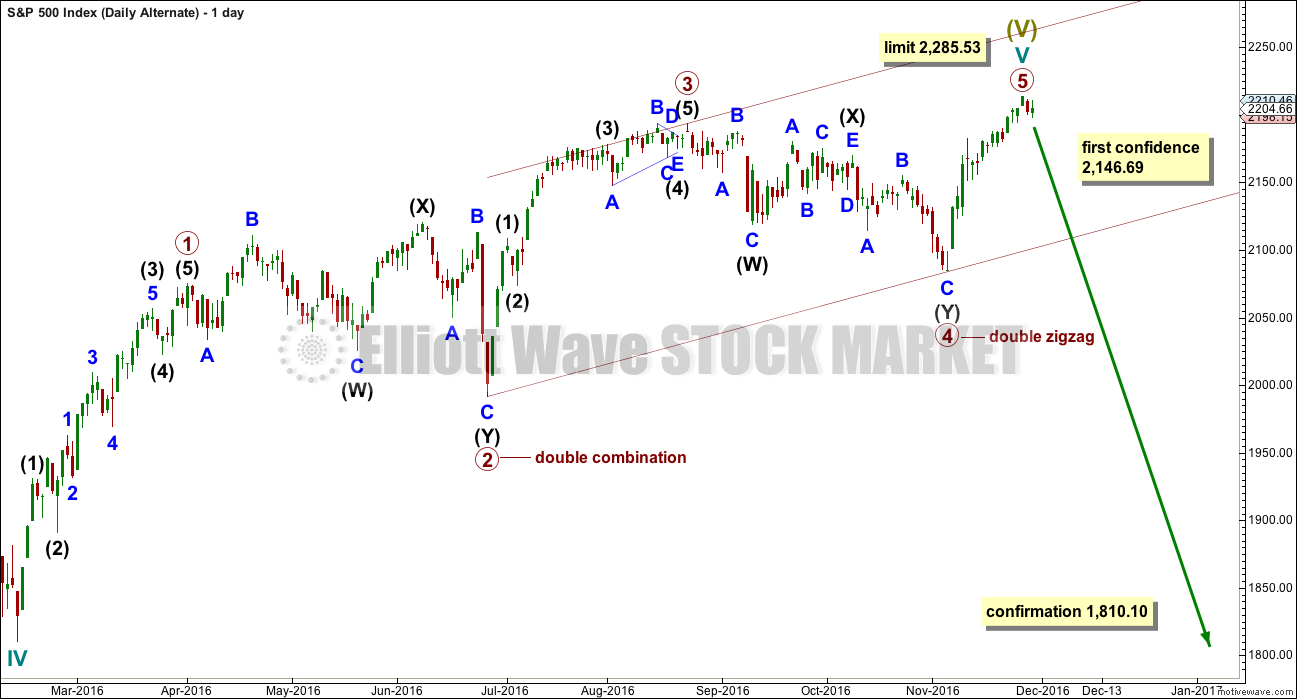
What if an impulse upwards is now complete? The large corrections labelled primary waves 2 and 4 do look like they should be labelled at the same degree as each other, so that gives this wave count the right look.
Primary wave 4 ends within primary wave 2 price territory, but it does not overlap primary wave 1. Primary wave 1 has its high at 2,057 and primary wave 4 has its low at 2,083.79. The rule is met.
There is alternation between the double combination of primary wave 2 and the double zigzag of primary wave 4. Even though both are labelled as multiples W-X-Y, these are different structures belonging to different groups of corrective structures.
Primary wave 3 is shorter than primary wave 1. This limits primary wave 5 to no longer than equality with primary wave 3 at 2,285.53.
The equivalent wave count for DJIA expects an end now to upwards movement and the start of a large bear market. Only for that reason will this alternate for the S&P also expect a reversal here.
This wave count has good proportions. Primary wave 1 lasted a Fibonacci 34 days, primary wave 2 lasted 60 days, primary wave 3 lasted 40 days, and primary wave 4 lasted 52 days. Primary wave 5 may be more brief than primary wave 3. If it exhibits a Fibonacci duration, it may total a Fibonacci 34 days and that would see it end on the 22nd of December. If it is only a Fibonacci 21 days in duration, it may end more quickly on the 2nd of December.
DOW JONES INDUSTRIALS
DAILY CHART
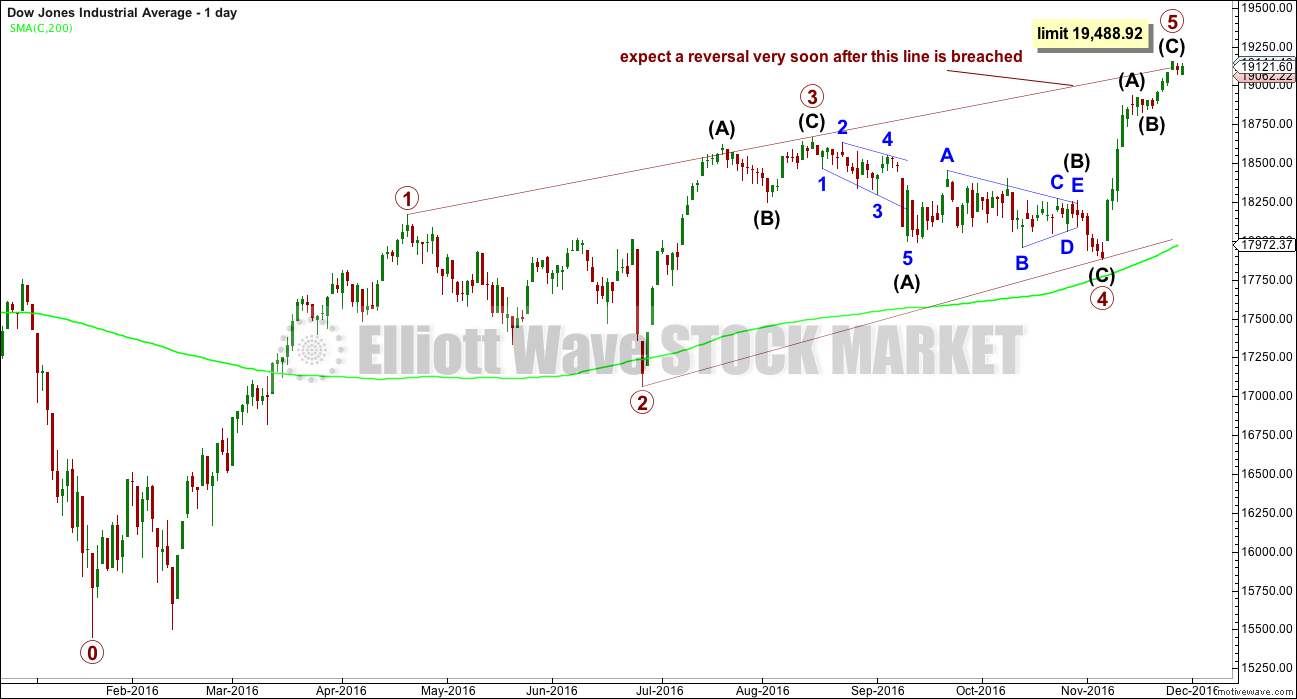
An ending contracting diagonal may be complete for the DJIA. This fits into the same picture as the alternate wave count for the S&P; both see a final fifth wave coming to an end very soon.
The 1-3 trend line is now overshot. Contracting diagonals normally end very quickly after this line is overshot, and it can be surprising how small the overshoot is. This wave count expects a very strong reversal.
The small red doji for last session, and small green candlestick for this session, is completely unconvincing as a sharp reversal. Diagonals are normally followed immediately by a sharp reversal, but this is not what is happening. Price behaviour today strongly suggests this wave count is wrong.
The diagonal is contracting, so the final fifth wave is limited to no longer than equality in length with primary wave 3 at 19,488.92.
TECHNICAL ANALYSIS
WEEKLY CHART
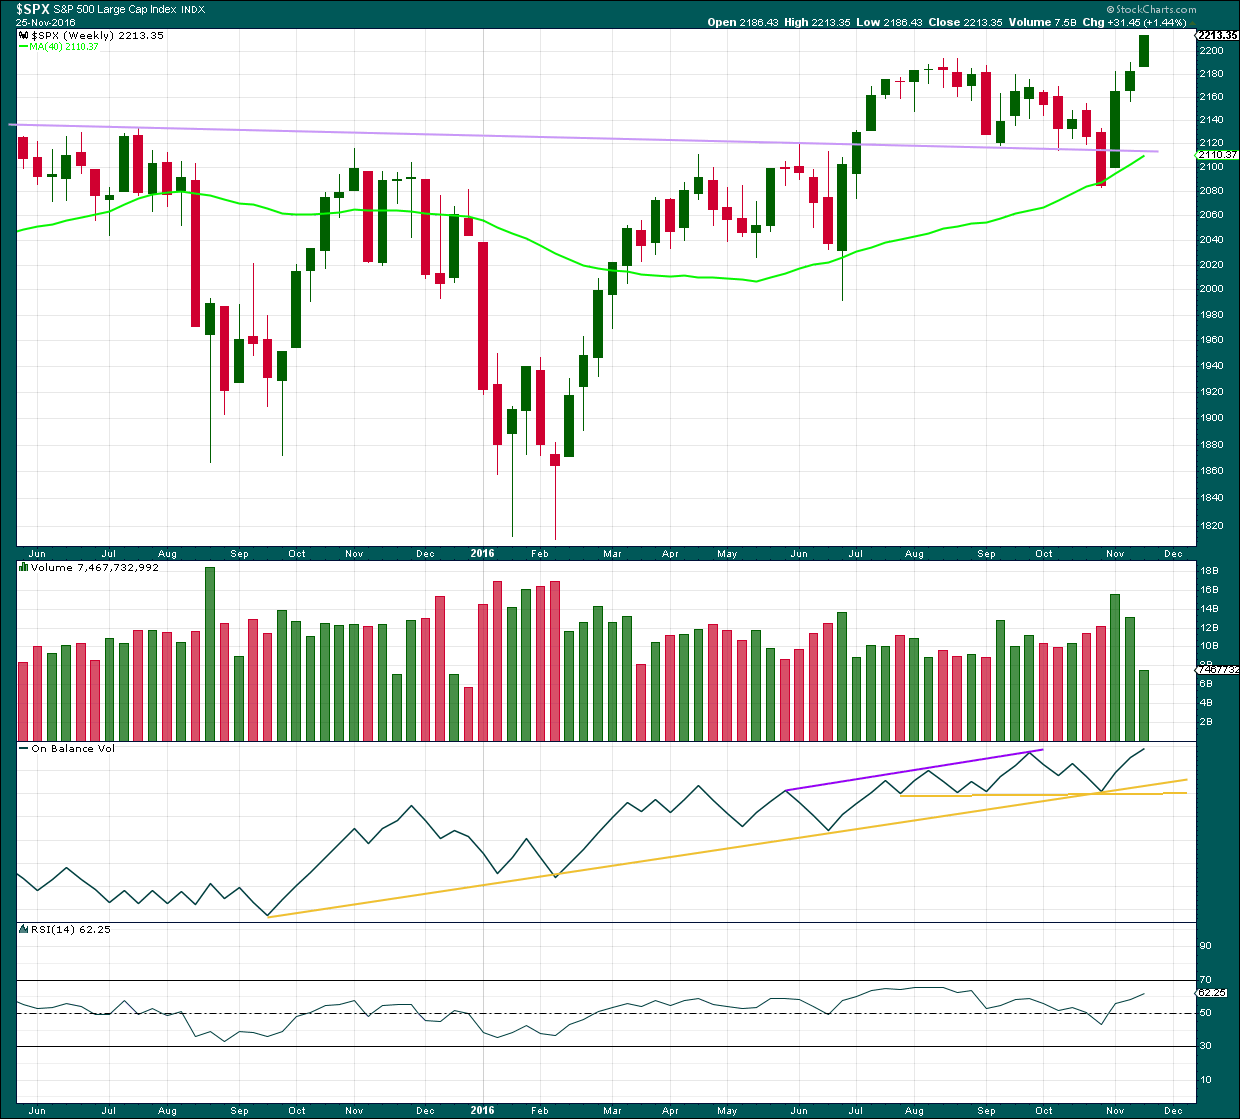
Click chart to enlarge. Chart courtesy of StockCharts.com.
Another upwards week comes with an increase in range but a strong decline in volume. This is partly due to the Thanksgiving Day holiday making this week short of one day, so not too much will be read into it.
On Balance Volume is bullish.
There is some mid term divergence between price and RSI: price is making new all time highs, but RSI is not following. This indicates weakness in price. It is not a signal of a trend change, only indication of weakness.
DAILY CHART
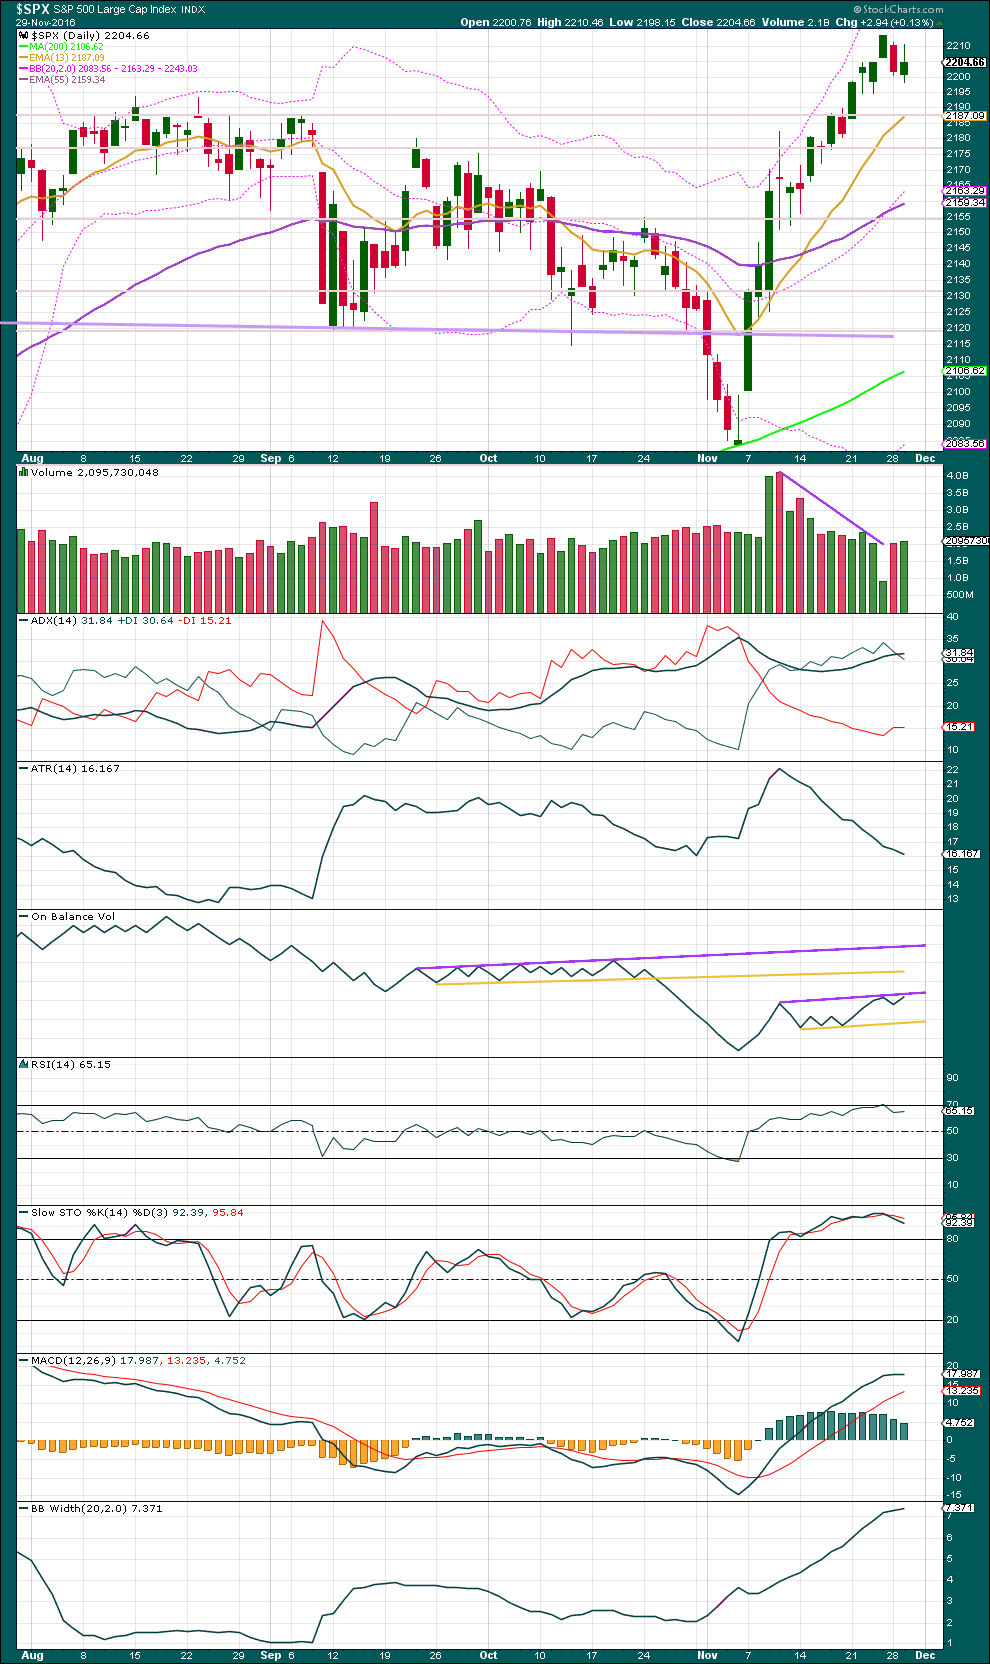
Click chart to enlarge. Chart courtesy of StockCharts.com.
Tuesday’s session has a lower high and lower low compared to Monday. This session moved price overall lower although it closed green. During the session, as On Balance Volume moved higher, there was more support from volume for upwards movement than downwards.
The increase in volume supports upwards movement during today’s session. Volume is still relatively light though.
With volume favouring upwards movement this session, we should expect more upwards movement next session.
ADX is still increasing, indicating an upwards trend is in place. Bollinger Bands continue to widen in agreement.
There is something wrong with this trend though because ATR is declining. Bulls are able to push price higher by smaller and smaller amounts each session. They are weakening.
A small consolidation may be bringing RSI and Stochastics down from extreme.
On Balance Volume may find resistance here at the purple trend line, but this line does not have good technical significance as it is not often tested nor long held.
VOLATILITY – INVERTED VIX CHART
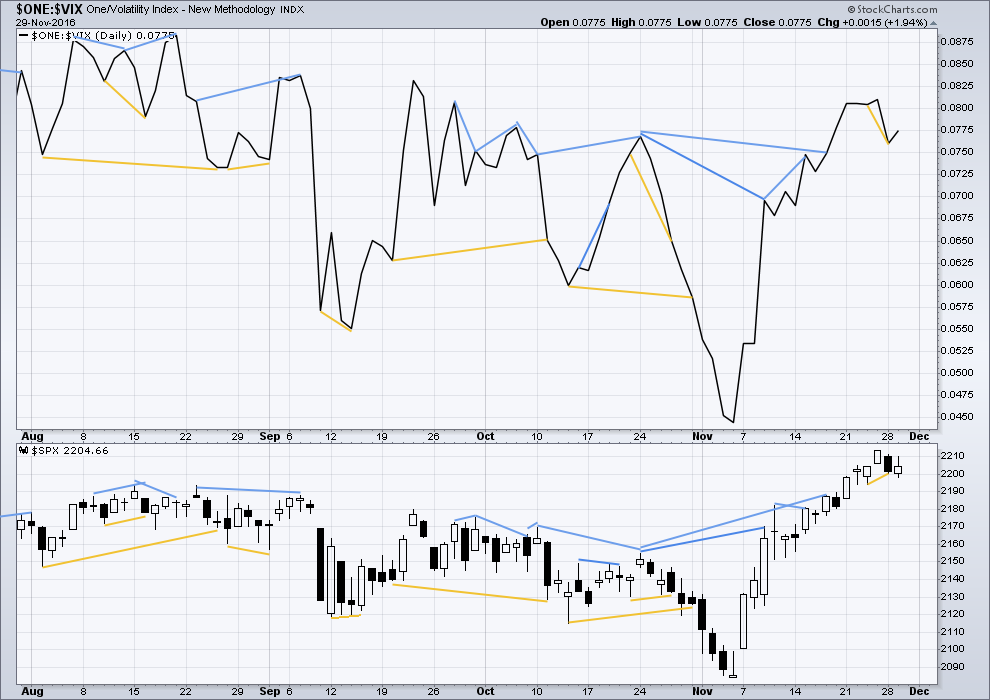
Click chart to enlarge. Chart courtesy of StockCharts.com.
There are a few instances of multi day divergence between price and inverted VIX noted here. Bearish divergence is blue. Bullish divergence is yellow. It appears so far that divergence between inverted VIX and price is again working to indicate short term movements spanning one or two days. While this seems to be working more often than not, it is not always working. As with everything in technical analysis, there is nothing that is certain. This is an exercise in probability.
Some short term divergence is noted yesterday between price and inverted VIX: price has made a higher low from the low three sessions ago, but inverted VIX has made a lower low. This hidden bullish divergence indicates weakness in price. It may be followed by one or two days of upwards movement.
Price overall moved lower today, but volatility declined. This single day divergence is also bullish.
BREADTH – AD LINE
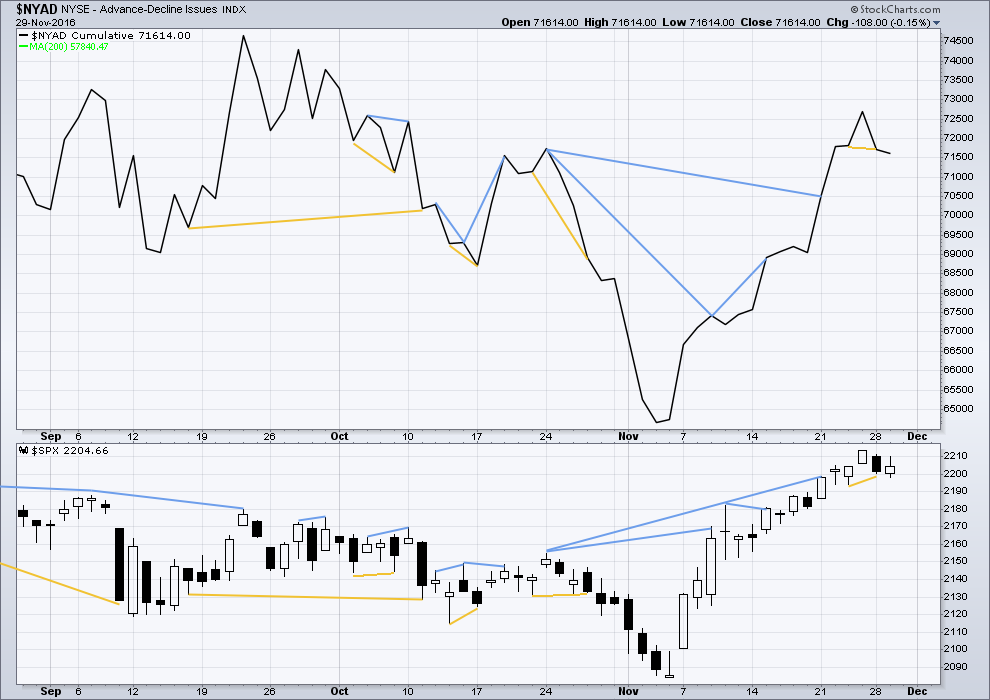
Click chart to enlarge. Chart courtesy of StockCharts.com.
Short term bullish and bearish divergence is again working between price and the AD line to show the direction for the following one or two days.
There is longer term divergence between price and the AD line, but like inverted VIX this has proven reasonably recently to be unreliable. It will be given no weight here.
Some short term divergence is noted yesterday between price and the AD line: price has made a higher low from the low three sessions ago, but the AD line has made a lower low. This hidden bullish divergence suggests there is weakness to this downwards movement from price. Breadth declined to a lower point, but this was not enough to bring price down to a corresponding point.
This divergence has been followed by a green daily candlestick, but one which moved price overall lower. It may be resolved by a green candlestick tomorrow.
BREADTH – MCCLELLAN OSCILLATOR
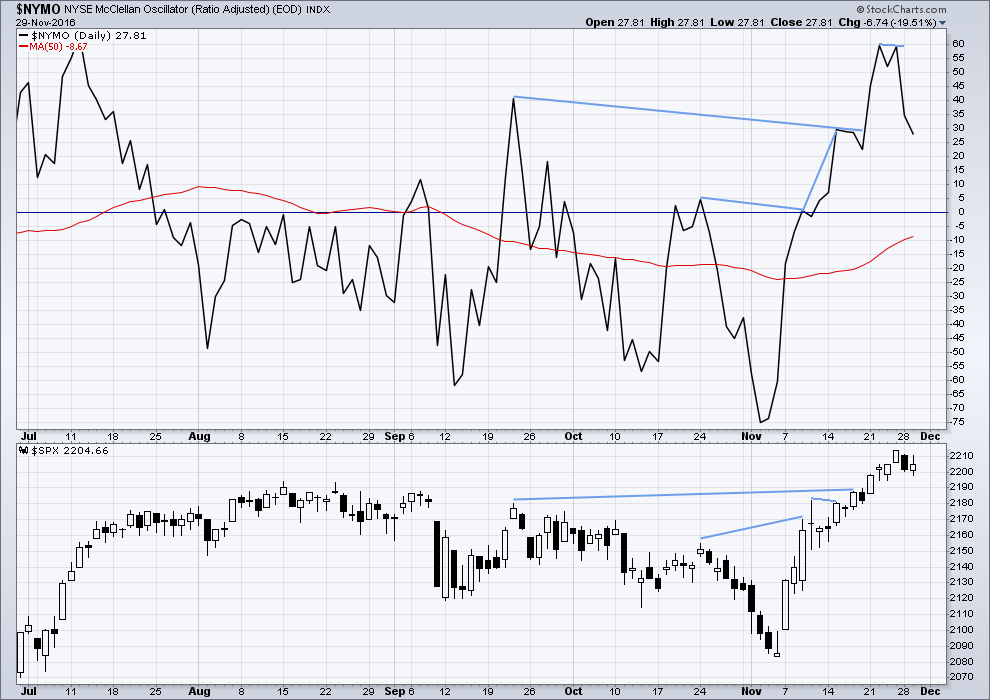
Click chart to enlarge. Chart courtesy of StockCharts.com.
On the 21st August, 2015, the McClellan Oscillator reached -71.56. Price found a low the next session, 104 points below the closing price of the 21st August. This very extreme reading for the 24th August would have been a strong indicator of a low in place.
On the 11th December, 2015, the McClellan Oscillator reached -80.82. It moved lower the next session to -92.65 and price moved 19 points lower. The extreme reading of 11th December might possibly have led to an expectation of a bigger bounce than the one that occurred, and might have misled analysis into missing the strong fall from 29th December to 20th of January.
The next most recent occasion where this oscillator was extreme was the 8th January, 2016. It reached -66.25 on that date. The low was not found for seven sessions though, on the 20th January 2016, almost 110 points below the closing price of the 8th January. At the low of the 11th February, there was strong bullish divergence with price making new lows and the oscillator making substantially higher lows. This may have been a strong warning of a major low in place.
The most recent occasion of an extreme reading was -75.05 on the 2nd of November. The last low came two days later.
As an indicator of a low this is not it. It is a warning of extreme levels. The next thing to look for would be some divergence with price and this oscillator at lows. Divergence is not always seen at lows, but when it is seen it should be taken seriously. Any reading over 100 should also be taken very seriously.
This indicator will be approached with caution. It is one more piece of evidence to take into account.
The McClellan Oscillator has just reached extreme at 60 and now exhibits divergence with price at Friday’s high. This does not mean price must turn here. The last time on this chart this oscillator reached 60 was on the 12th of July and price continued higher to the 15th of August before a reasonable correction began. It looks like this does not work well to indicate or warn of highs.
DOW THEORY
Major lows within the old bull market:
DJIA: 15,855.12 (15th October, 2014) – closed below on 25th August, 2015.
DJT: 7,700.49 (12th October, 2014) – closed below on 24th August, 2015.
S&P500: 1,821.61 (15th October, 2014) – has not closed below this point yet.
Nasdaq: 4,117.84 (15th October, 2014) – has not closed below this point yet.
Major highs within the bear market from November 2014:
DJIA: 17,977.85 (4th November, 2015) – closed above on 18th April, 2016.
DJT: 8,358.20 (20th November, 2015) – closed above this point on the 9th of November, 2016.
S&P500: 2,116.48 (3rd November, 2015) – closed above this point on 8th June, 2016.
Nasdaq: 5,176.77 (2nd December, 2015) – closed above this point on 1st August, 2016.
Dow Theory Conclusion: The transportations indicate an end to the prior bear market. The transportation index confirms a bull market.
This analysis is published @ 10:00 p.m. EST.

Minute b is now 1.05 X minute a. This is the requirement for an expanded flat, the most common type of flat.
Minor 4 may now be expected to most likely be an expanded flat. Target for minute c = 1.618 X minute a = 2,190.
Minor 4 could still also be a triangle, it could move sideways in an ever narrowing range for a few days.
Minor 4 could still be a combination, sideways in a confounding range with poor delineation for a few days.
Short term conclusion: this consolidation is not done. It should continue for at least one more day and possibly two or five more to total a Fibonacci five or eight.
VIX flashing warning lights. Unloading remaining upside hedges.
A few days ago a few folk disagreed with my take on the decision of the Indian government to eliminate its two highest denominated notes. Some very interesting points were raised about justification for the decision based on the argument that it would be an effective tool against corruption. I have been doing a bit of digging and here are some interesting facts. Did you know that the countries with the higest denominated notes also have the lowest crime rates, including financial and organized crime? Here is how they stack up based on the World Economic Forum’s competitive rankings which looks at organized crime, as well as business costs attributable to crime and violence.
Switzerland, with its 1,000 Swiss franc note (roughly $1,000 USD) has among the lowest levels of organized crime in the world according to the WEF.
Ditto for Singapore, which has a 1,000 Singapore dollar note (about $700 USD).
A spotless city both physically and ethically ( or as close as one gets)
Japan’s highest denomination of currency is 10,000 yen, worth $88 today. Yet Japan also has extremely low crime rates.
Same for the United Arab Emirates, whose highest denomination is the 1,000 dirham ($272).
On the other hand, countries with very low denominations of cash, the opposite holds true: crime rates, and in particular organized crime rates, are extremely high.
Consider Venezuela, Nigeria, Brazil, South Africa, etc. Organized crime is prevalent. Yet each of these has a currency whose maximum denomination is less than $30.
The lesson?
Never blindly accept the reasons politicians give for the decisions they make to curtail your freedom and independence, no matter how plausible!
The current global push for a cashless economy is no exception.
Vern,
India has added a 2000 rupee note while eliminating old 500 and 1000 rupee notes which fill coffers of most corrupt people. Short term pain for India but even if 25% corruption in the country gets reduced and black money induced real estate bubble pops (real estate in Mumbai, delhi down), this is good for genuine buyers who are priced out of the market. Rent cap rates in major cities are close to 2% while banks pay fixed deposit interest of close to 7% (or higher). Most black money for several years was also channeled into empty properties siting or being owned simply to hide that wealth. Now slowly that is hitting the market. Eventually demographics, reducing corruption, bringing more people into the system, more tax payers, will all help India greatly. The only complain I have is that the implantation so far has been not good. People have to wait in lines for hours to get cash. And very limited cash. Not very efficient. Hope they fix that soon.
Vern,
Switzerland may have the “lowest organized crime” in the world but is also a place for swiss banks whose sole purpose has been to hide assets of cheats, crooks, and billionaires world wide.
Japan may have low crime rates but is a society on decline and its fiscal and monetary policies for the last decade or two have been inadequate to say the least, along with being a closed society.
Honestly, hard to compare all these countries to India. India’s population alone is more than all these countries combined. Approx. 1/5 th of the world lives there.
Perhaps a comparison to China would be better?
I have mixed feelings about the Swiss. I agree that some of the banks there were assisting some clients engaging in not just tax avoidance, which is perfectly legal, but also tax evasion which is not. On the other hand, it was a banking system world re-knowned for its protection of depositors personal information, and which the US has completely destroyed, along the way putting a bank out of business that was founded in 1741. The remarkable thing was what the banks there did in co-operating with the US Treasury violated Swiss laws guarding banking privacy. The bottom line is that this is hardly “organized crime” and certainly not on the same par with government officials using their official positions to engage in bribery and corruption, or even the average person trying to avoid a sales tax, which matters you referenced in explaining the Indian government’s motives. I would be interested to see just how many of those new rupee notes actually make it into circulation.
In NZ our largest note is $100, worth USD70 today.
We are usually toward the top the list of least corrupt countries in the world, but I’m not sure that we actually are. Still, you don’t have to bribe anyone here to get stuff done.
Even though the list of countries you’ve given includes a great variety in culture and population, there may still be some merit in the comparisons.
Which countries would be closer in terms of population to India? China would be the closest but there are major cultural differences to India. China is generally ranked rather poorly but higher than India. The largest note in China is RMB100
You can hear the crickets chirping so far as the MSM is concerned when it comes to the impending Dec 4 Italy referendum. Aside from a recent Charlie Rose interview of Renzi, there has not been too much discussion of its implications. Why the strange silence? 🙂
Closing half my upside hedges today, including UVXY 13 strike calls sold against my long position. It is quite interesting that those calls have not declined very much from what I sold them for awhile back.
I have to smile at the exuberance, and that is really all it is – an emotional response, at the announcement of an OPEC deal. I expect it to be a short lived fantasy. The frackers are going to be all over the price increase and ramp up production at wells that have been sitting idle and waiting for just this development. I would not be surprised to see world inventory increase, rather than decrease at the next report. I am not even taking into consideration the fact that none of the cartel members are going to be able to resist the temptation to cheat…just a little bit. I will be shorting the rip. 🙂
I agree Verne, for Oil that spike up today looks like a blowoff top.
The EW count expects it to go down.