A red long legged doji for today’s session indicates indecision, a balance between bulls and bears. This mostly fits expectations; this session was expected to produce a small red daily candlestick.
Summary: Tomorrow may begin with some downwards movement to a target at 2,147 but not below 2,125.35. Thereafter, upwards movement may show some increase in momentum and support from volume. A bull market is indicated by Dow Theory and should be assumed to be intact, until price tells us it is not. Corrections are an opportunity to join the trend.
Last monthly chart for the main wave count is here.
Last weekly chart is here.
New updates to this analysis are in bold.
MAIN WAVE COUNT
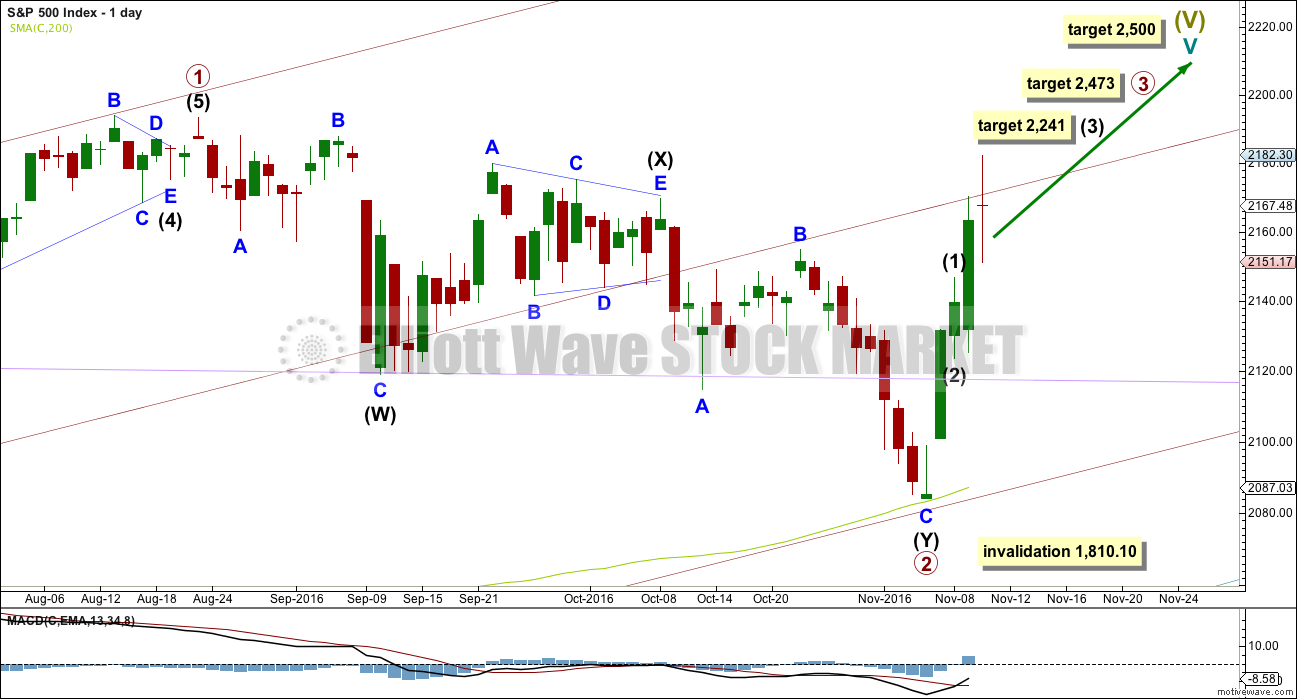
DAILY CHART
Primary wave 2 now looks to be complete as a double zigzag. Within primary wave 2: intermediate wave (W) was a very shallow zigzag lasting a Fibonacci 13 sessions; intermediate wave (X) fits perfectly as a triangle lasting 20 sessions, just one short of a Fibonacci 21; and intermediate wave (Y) also lasting 20 sessions deepens the correction achieving the purpose of a second zigzag in a double.
Primary wave 2 looks like it has ended at support about the lower edge of the maroon channel about primary wave 1, and at the 200 day moving average.
With upwards movement slicing cleanly through the lilac trend line, this behaviour looks to be more typical of an upwards trend. At this stage, corrections within primary wave 3 may be expected to turn down to test support at this trend line. While after hours movement did not find support there, the New York session did.
At 2,500 cycle wave V would reach equality in length with cycle wave I.
At 2,467 primary wave 3 would reach equality in length with primary wave 1. This is the ratio used in this instance because it fits with the higher target at 2,500.
Within primary wave 3, now intermediate waves (1) and (2) may be complete. At 2,241 intermediate wave (3) would reach 1.618 the length of intermediate wave (1).
Primary wave 3 may show some strength compared to primary wave 1, but it does not have to. This wave count sees price in a final fifth wave at cycle degree, within a larger fifth wave at Super Cycle degree. The upcoming trend change may be at Grand Super Cycle degree, a once in generations trend change. This final fifth wave should be expected to exhibit great internal weakness; this market may appear broken. That would be typical behaviour for a final fifth wave of this magnitude.
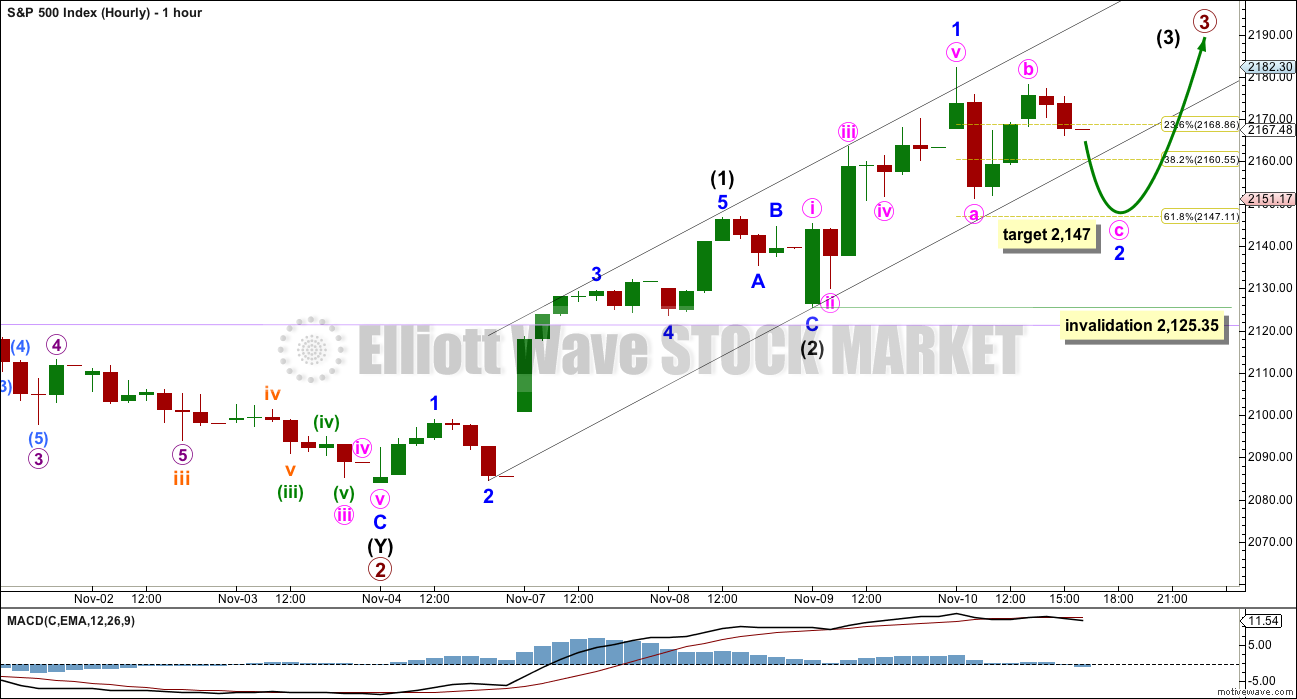
HOURLY CHART
Intermediate waves (1) and (2) look complete. Intermediate wave (3) looks like it has begun and is likely to extend.
Upwards movement for Thursday’s session looks corrective and shows weakness on the five minute chart. The downwards movement to begin Thursday’s session looks like a five, not a three. On the five minute chart, it looks like minor wave 2 is completing as a zigzag that is more time consuming than originally expected.
At 2,147 minute wave c would reach equality in length with minute wave a. This would bring minor wave 2 down to the 0.618 Fibonacci ratio of minor wave 1 at 2,147.11. This seems to be a reasonable target for the start of tomorrow’s session.
The target for minor wave 2 to continue lower early tomorrow would necessitate a breach of the black channel drawn about this upwards movement. The S&P does not always fit neatly within channels; it does have a tendency to breach them yet continue in the prior direction. It looks like that is what may happen here. This makes sense given the larger expected picture of a “broken” market showing great internal weakness.
Minor wave 2 tomorrow may not move beyond the start of minor wave 1 below 2,125.35.
When minor wave 2 is complete, then a third wave up at three degrees is expected for this wave count. It should exhibit some strength: an increase in momentum and support from volume.
ALTERNATE WAVE COUNT
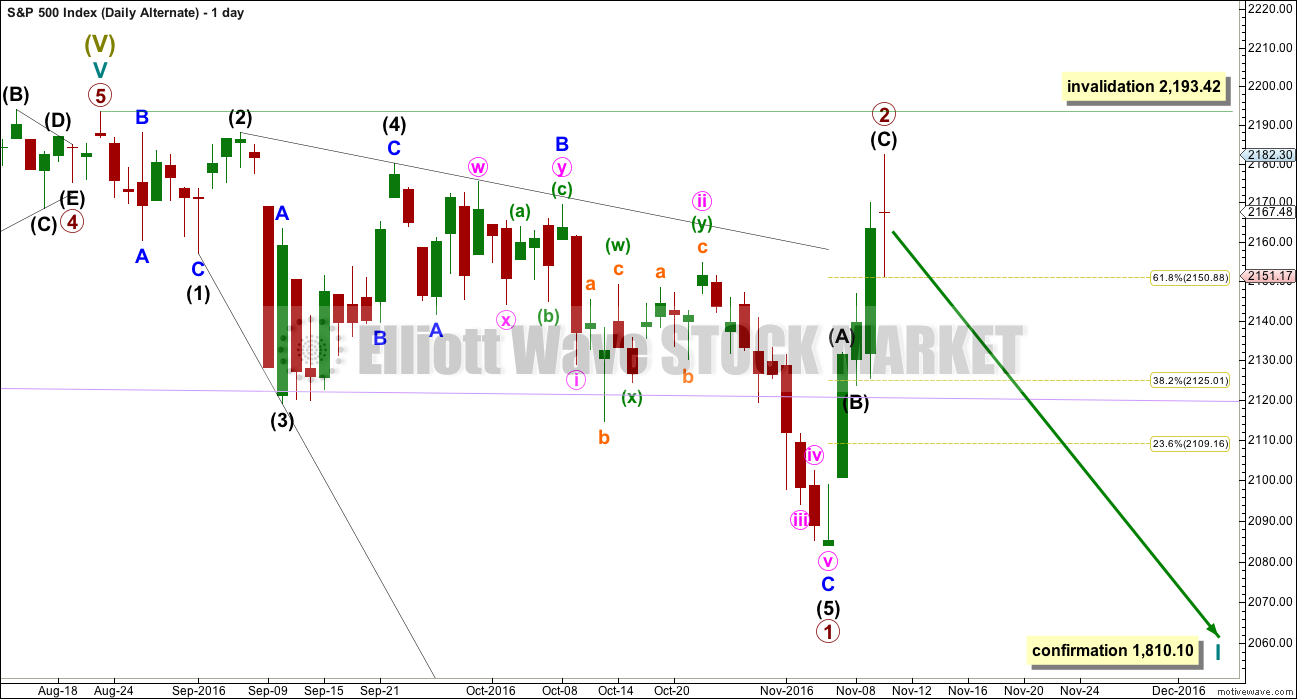
DAILY CHART
This is at this stage the only idea I can see which meets all Elliott wave rules for a bearish scenario.
If there has been a Grand Super Cycle degree trend change at the last all time high, then the first wave down must subdivide as a five wave structure. This may be a leading expanding diagonal for a primary degree first wave.
While diagonals are not rare structures, they are more commonly ending than leading. When first waves do subdivide as diagonals, they are most often contracting and not expanding. This is not a rare structure, but it is not very common either. This reduces the probability of this alternate wave count. It is presented as a “what if?” to consider all options.
A new low below 2,083.79 would add some confidence to this wave count.
Second wave corrections following first wave leading diagonals are most often very deep. Primary wave 2 subdivides as a quick deep zigzag, at 0.79 the length of primary wave 1.
If it continues higher, primary wave 2 may not move beyond the start of primary wave 1 above 2,193.42.
TECHNICAL ANALYSIS
WEEKLY CHART
Click chart to enlarge. Chart courtesy of StockCharts.com.
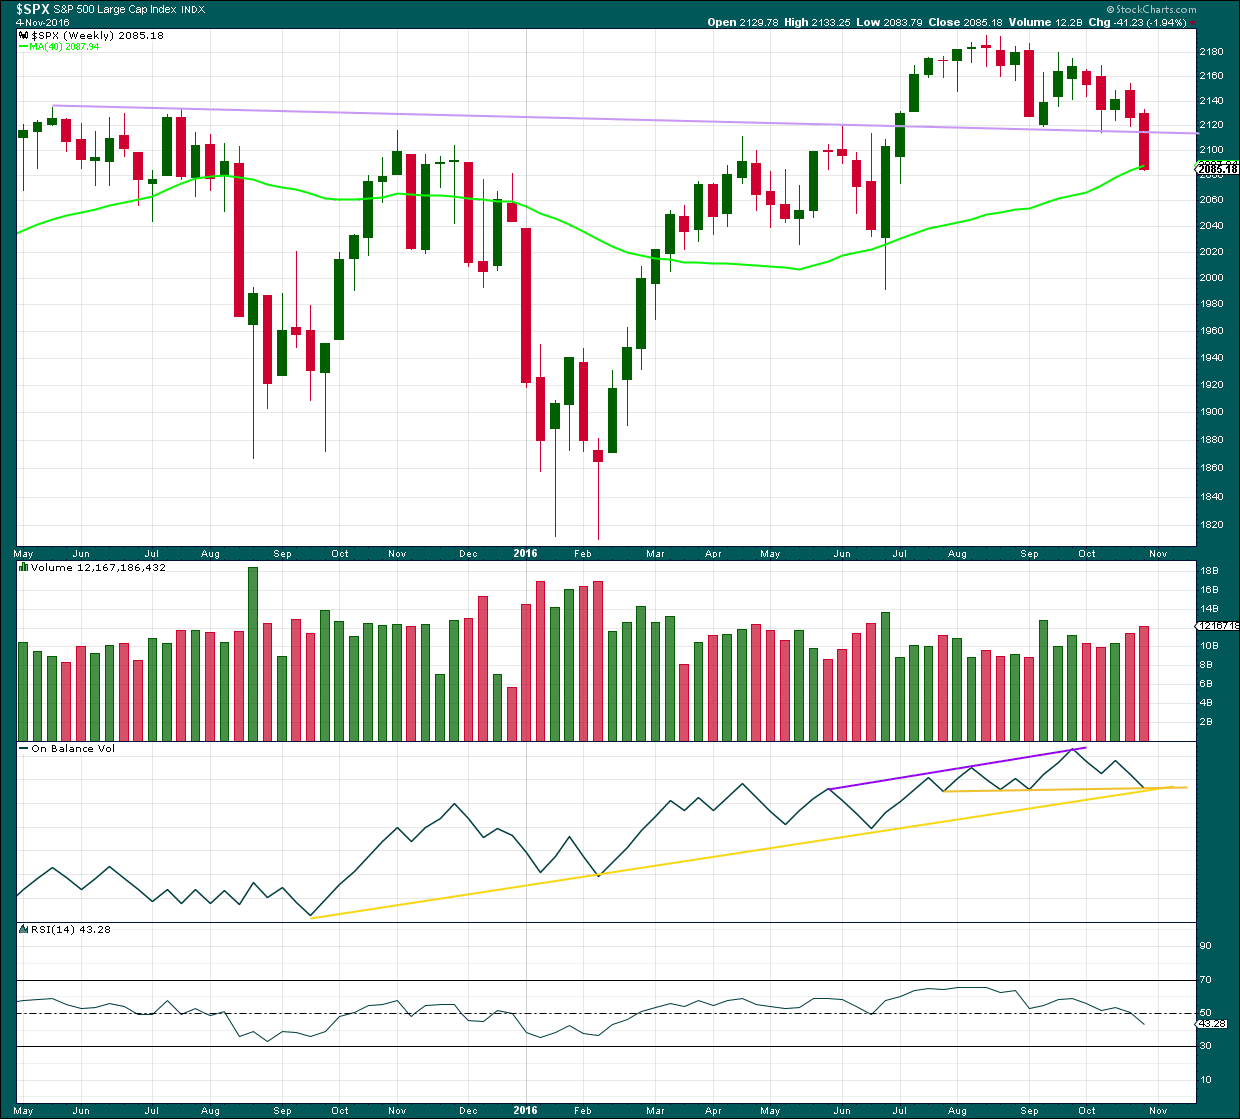
A strong downwards week breaking and closing well below the lilac trend line is a strong bearish signal. After a trend line breach, it would be typical to see price turn upwards and test resistance at the line.
There is strong support for price here from the 40 week (200 day) moving average. There is strong support for On Balance Volume here by both yellow lines. This suggests price may bounce early next week.
How high the bounce goes is going to tell us which Elliott wave count is correct. From a classic technical analysis point of view a breach back above the lilac line would be very bullish. If that happens, then new all time highs may be expected. But if the lilac line remains intact and provides strong resistance, then the possibility of a bear market would increase.
DAILY CHART
Click chart to enlarge. Chart courtesy of StockCharts.com.
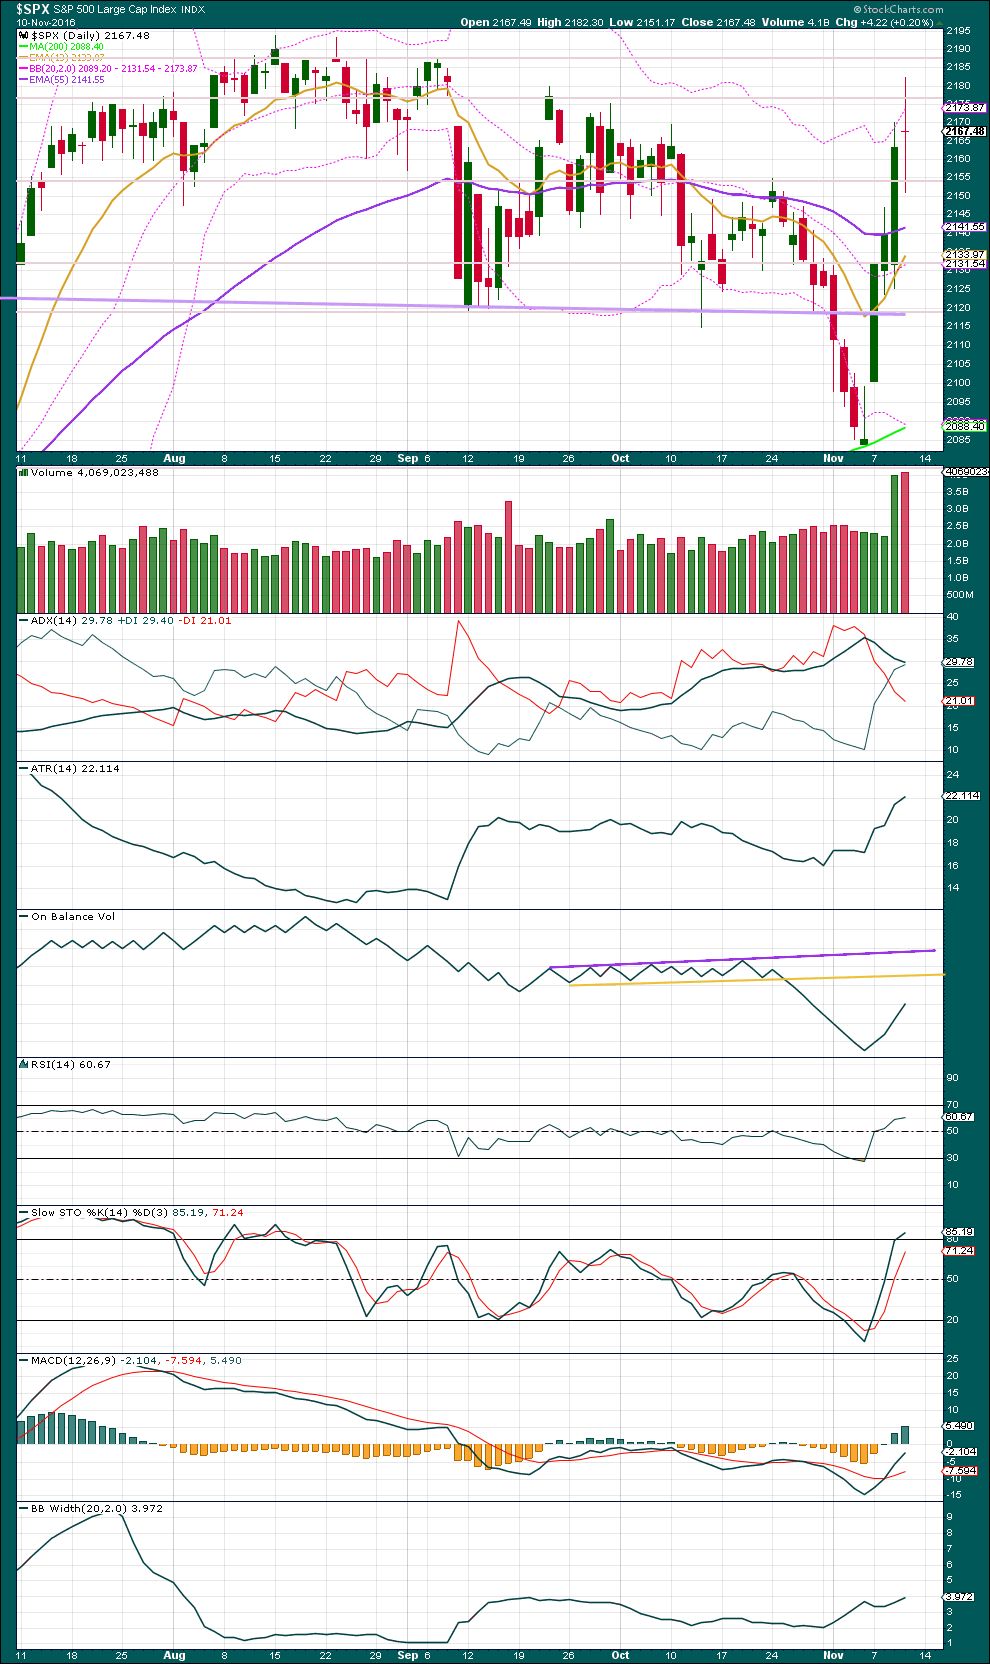
While today’s doji is red, On Balance Volume indicates upwards volume is stronger than downwards. The rise in price still has support from volume.
The doji for this session indicates a pause, a balance between bulls and bears. It is not on its own a reversal signal. If tomorrow completes a red daily candlestick, particularly if it gaps lower, then an Evening Doji Star would be complete. That would be a reversal signal, but it is not complete yet.
There is plenty of room for upwards movement before On Balance Volume finds resistance.
ADX is still declining and the +DX line is above the -DX line. A trend change is possible, but a new upwards trend is not yet indicated. This is a lagging indictor though as it is based upon a 14 day average.
ATR is increasing, indicating a trending market.
Bollinger Bands are expanding, which is normal for a trending market. With price close to the upper edge of Bollinger Bands two days in a row now, some small downwards reaction, a reversion to the mean, would be a reasonable expectation. This fits neatly with the hourly Elliott wave count today.
This market is most likely trending upwards.
MACD has given a buy signal with a cross of the signal line over the moving average.
RSI is not yet extreme. There is room for this market to move higher.
Stochastcis is entering overbought, but during a trending market this oscillator may remain extreme for reasonable periods of time.
VOLATILITY – INVERTED VIX CHART
Click chart to enlarge. Chart courtesy of StockCharts.com.
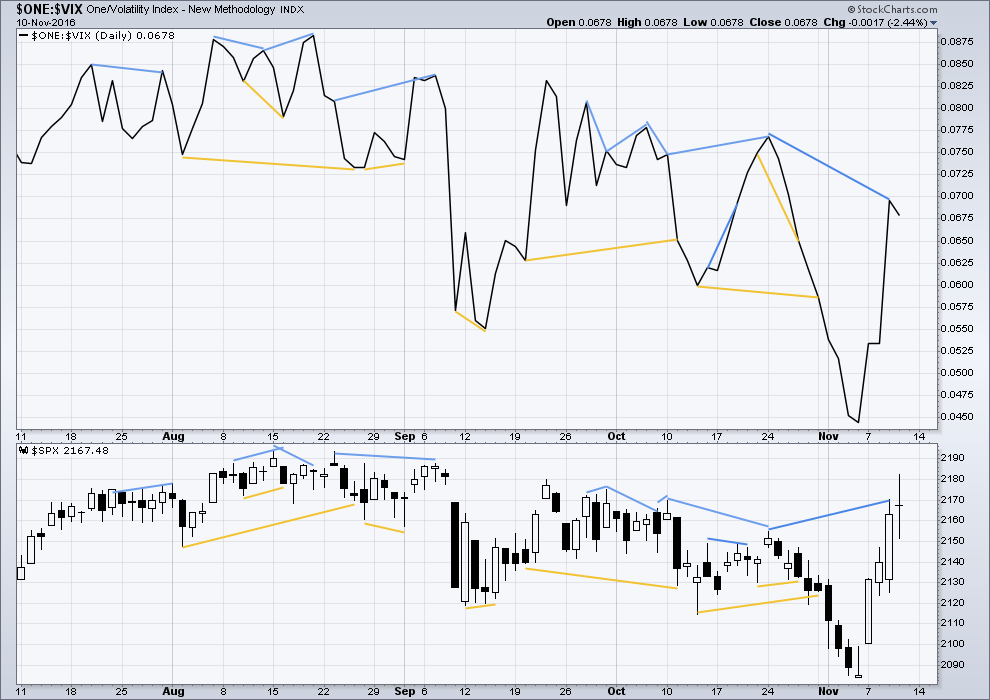
There are a few instances of multi day divergence between price and inverted VIX noted here. Bearish divergence is blue. Bullish divergence is yellow. It appears so far that divergence between inverted VIX and price is again working to indicate short term movements spanning one or two days.
Price moved higher yesterday along with inverted VIX. However, price has made a new swing high above the prior swing high of the 24th of October yet inverted VIX has not. This is regular bearish divergence and indicates the bulls are exhausted. It may be followed by one or two days of downwards movement.
This session moved price higher with a higher high and a higher low. If tomorrow moves price lower, then the divergence indicated by VIX may be resolved.
BREADTH – AD LINE
Click chart to enlarge. Chart courtesy of StockCharts.com.
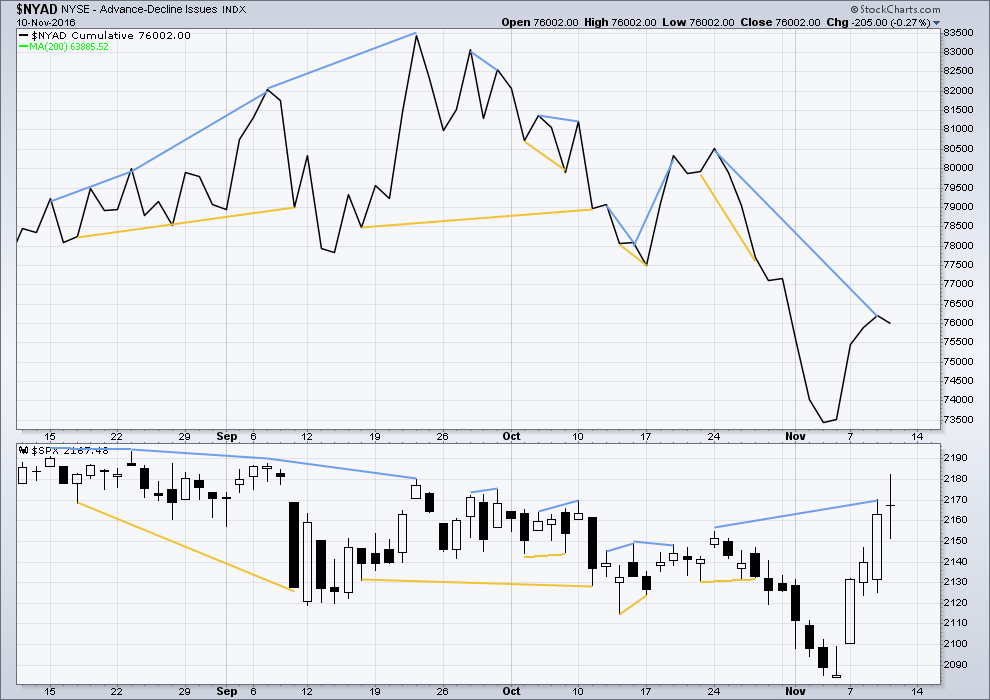
Short term bullish and bearish divergence is again working between price and the AD line to show the direction for the following one or two days.
There is regular bearish divergence yesterday between price and the AD line: price today made a new high above prior swing high of the 24th of October, but the AD line has not. This indicates a lack of breadth to this upwards movement. It may be followed by one or two days of downwards movement.
Today’s session moved price higher with a higher high and a higher low. If tomorrow moves price lower, then this bearish divergence may be resolved.
BREADTH – MCCLELLAN OSCILLATOR
Click chart to enlarge. Chart courtesy of StockCharts.com.
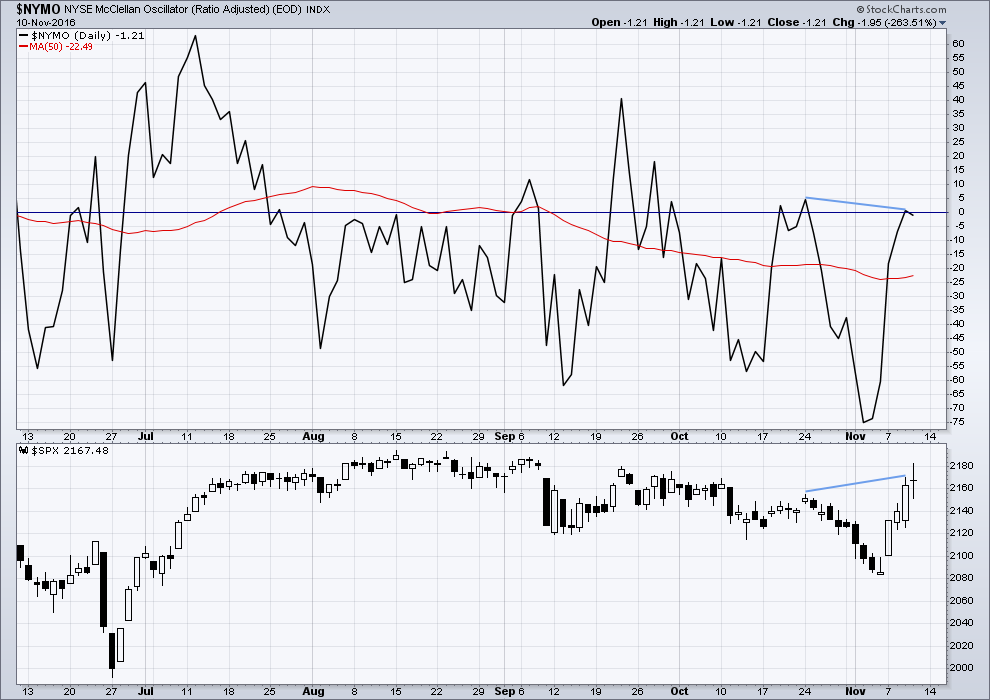
The McClellan Oscillator is now extreme (below 60). On its own this is not an indicator of a low, but it is a warning that this market is oversold. The McClellan Oscillator today is at -73.44.
On the 21st August, 2015, the McClellan Oscillator reached a similar point of -71.56. Price found a low the next session, 104 points below the closing price of the 21st August. This very extreme reading for the 24th August would have been a strong indicator of a low in place.
On the 11th December, 2015, the McClellan Oscillator reached -80.82. It moved lower the next session to -92.65 and price moved 19 points lower. The extreme reading of 11th December might possibly have led to an expectation of a bigger bounce than the one that occurred, and might have misled analysis into missing the strong fall from 29th December to 20th of January.
The next most recent occasion where this oscillator was extreme was the 8th January, 2016. It reached -66.25 on that date. The low was not found for seven sessions though, on the 20th January 2016, almost 110 points below the closing price of the 8th January. At the low of the 11th February, there was strong bullish divergence with price making new lows and the oscillator making substantially higher lows. This may have been a strong warning of a major low in place.
The most recent occasion of an extreme reading was -75.05 on the 2nd of November. The last low came two days later.
As an indicator of a low this is not it. It is a warning of extreme levels. The next thing to look for would be some divergence with price and this oscillator at lows. Divergence is not always seen at lows, but when it is seen it should be taken seriously. Any reading over 100 should also be taken very seriously.
This indicator will be approached with caution. It is one more piece of evidence to take into account.
There is regular bearish divergence yesterday between price and the McClellan oscillator: price today made a new high above prior swing high of the 24th of October, but the McClellan oscillator has not. This indicates a lack of breadth to this upwards movement. It may be followed by one or two days of downwards movement.
Today’s session moved price higher with a higher high and a higher low. If tomorrow moves price lower, then this bearish divergence may be resolved.
DOW THEORY
Major lows within the old bull market:
DJIA: 15,855.12 (15th October, 2014) – closed below on 25th August, 2015.
DJT: 7,700.49 (12th October, 2014) – closed below on 24th August, 2015.
S&P500: 1,821.61 (15th October, 2014) – has not closed below this point yet.
Nasdaq: 4,117.84 (15th October, 2014) – has not closed below this point yet.
Major highs within the bear market from November 2014:
DJIA: 17,977.85 (4th November, 2015) – closed above on 18th April, 2016.
DJT: 8,358.20 (20th November, 2015) – closed above this point on the 9th of November, 2016.
S&P500: 2,116.48 (3rd November, 2015) – closed above this point on 8th June, 2016.
Nasdaq: 5,176.77 (2nd December, 2015) – closed above this point on 1st August, 2016.
Dow Theory Conclusion: The transportations indicate an end to the prior bear market. The transportation index today confirms a bull market.
This analysis is published @ 07:48 p.m. EST.

The guys at EWI think we may be in a final fifth wave up. Prechter sent an interim report suggesting the same this week. Here is their count of the current action. I don’t know if they are right but I am watching the price action with great interest.
The failure of other indices to confirm the DJI new ATH, declining AD ratio, and most fascinating of all, the DJI’s extended stay above those BBs suggest something big is afoot. Was that plunge on Tuesday evening a harbinger? I will be looking for a spike past the 1-3 trend-line followed by an immediate and brutal reversal typical of the ED.
For me personally, the all important pivots will tell the tale. I note with interest that in the ED wave count the 2-4 trend-line almost exactly crosses at that important pivot. If it falls next week, that could be all she wrote! Have a restful weekend everyone!
I read that today. This is there last chance for me… It fits with my own thesis but I don’t get anything anymore.
Have a great weekend all.
As money leaves the bond market, one likely place for some of it will be the stock market. I suspect we are seeing that this week (besides massive short covering). The bull market in bonds is OVER. Yields won’t go up in a straight line but will be higher 12 months down the road. Short term bonds are oversold and we could see yields go down next week. However the 30 yr run in bonds is over.
Those fleeing the bond market in search of a safe haven in equities are in for a rude awakening I am afraid. It is what will make what is coming so inscrutable to many, namely, that there will be no place to hide!
The collapse of the bond market is in fact that first domino that bring down the entire pile…
Agree Vern. But wont happen this year. This is a slow train to mega bear market. But in the meantime Bull will prevail.
However if we get major regulation and tax overhaul in the country along with fiscal stimulus, this could go on much longer than most expect.
I have to smile everytime I hear someone confidently state when some market event is or is not going to happen. Peter Temple of WCI for some time now has been calling a November top. That almost 1000.00 point futures drop, apparently so easily forgotten and dismissed by all the talking heads, this unprecedented multi standard deviation from ATR which has issued in stratospheric moves above DJI’s BB, and higher highs and higher VIX lows all tell me its is not a time to be complacent. I think when this market turns a lot of people are not going to be expecting it.
Minute c of Minor 2 down is currently slightly truncated. I expect we are currently finishing Minuette 4 of Minute c with another lower low still to go to finish off Minor 2 down.
Above approx. 2170.38 (minuette 1 of minute c) invalidates that view.
This time wasting is starting to make the waves as labelled look a bit strange imo. Minor 2 (if that’s what it is) is now well out of the intermediate base channel and out of proportion with Intermediate 2.
Sometime that happens, and there are no price invalidations yet, but I’m starting to get suspicious that something else might be going on (or maybe Minor 2 is truncated and we are just kicking off Minor 3).
It’s also possible that Minor 2 ended at yesterdays lows and todays deep pullback was a deep second wave within Minor 3 (albeit that move up from yesterdays low fits better as a 3 imo).
If that’s the case, price should aim for the stars on Monday. I consider this scenario a lower probability though.
Looks like a fewJohnny-come-latelys piling onto the long TBT trade on a reversal threshold. Volume continues to shrink with the move up. We will probably see a substantial downside gap. I am actually starting to wonder if we may be in a fourth wave correction already….
Scaled some more Gold shorts /gc. bought some /zb for short term bounce.
Anybody looking at a 1 min chart of TBT?
OMG! What in tarnation is going on there??!!
There is the signal on TBT. The 39 strike puts expiring November 25 are looking particularly merry at 0.84/1.00 bid/ask, and that still gives you a whole month to get your Xmas shopping done. You should walk away with your double long before then. Holiday Cheers! 🙂
A third wave should drive UVXY back below 13.00 to a new 52 week low.
It may be a final historic buying opportunity as I would not be surprised to see divergence with a possible five wave up. As tempting as it is to hold onto these explosive instruments, you have to take profits quickly. Price volatility during bear market makes scalping the most effective approach to compounding profits. Of course, another approach is to load up on 2018 puts and walk away and wait for the carnage to unfold….. 🙂
Vern,
What puts are you looking at for 2018.
Actually, I have not looked at any specifically as I now very rarely execute position trades. The life-time of my trades can now usually be measured in hours, and sometimes days if they are credit spreads. I like to keep my exposure to Mr. Market’s whims at a minimal at all times. It is much more fun watching him from the sidelines… 🙂
🙂
We either have near term safe short trade in DJI, or we will shortly with on or two more spikes above the BB. This territory will ultimately be surrendered as it trades back within its BBs, and even if the move is only corrective.
Agreed Verne, it looks very extreme ATM. Closing above the upper BB three days in a row? Only one more day at the most really should be expected.
I just took a look at a DJI chart going back four years and the roughly three standard deviation move such as we seeing with this kind of duration has not happened once during that time, even in the most bullish of bull runs. I wonder what it all means?
We will probably see an over-sold bounce in the long bond at support to be followed by a decisive break sometime soon. When that happens, get out…!
If the 30 Year Treasury Yield breaks convincingly above 3.26%… Look out! That’s the point of no return.
Kimble has some interesting observations on interest rates as a few charts are at key levels. I think resistance and support will hold at the first attempt and be broken in the near future.
Sold last tranche @2.00 but I suspect we could go a bit higher as the series of higher highs and higher lows continue
Selling another 1/4 of UVXY 13 strike calls @ 2.05
Will hold last 1/4 for UVXY reversal below today’s open, or 2.50 bid, whichever comes first…
Selling another 1/4 of UVXY 13 strike calls @ 1.94
The more things change, the more they remain the same.
I was absolutely stunned to hear reports this morning that Jamie Dimon is being considered for Treasury Secretary of the US.
If this is true and I hope to God it is not, the American public just got royally scammed.
Let’s hope and pray that Donald Trump is not that stupid.
This is probably all coming from Rudy Guilliani who is a Judas in the camp and apparently they are going to make Attorney General. (Sorry Hillary)
Outsider my rear end. The banksters are apparently still in charge, no matter who gets elected. Unbelieveable!!!!!!!!!
I am from Chicago where money (cash) makes the wheels go round. This is true in NYC, Washington DC and BVI. I hope Jamie Dimon is just one of a list of several who might be considered.
The most important thing Trump must do is to not become ‘beholding’ to anyone.
Have a good trading week all. I am thinking the next good entry point will be between 2135 and 2120.
Gotta go catch a plane.
“Gimme a ticket for an aero plane. Ain’t got time to catch a fast train.”
Safe travels my friend!
Jamie Dimon is a liberal media plant to rile up the Trump supporters… all in Trump’s inner circle signed non-disclosure agreements (I am sure with Financial Teeth). There are NO LEAKS of any names for any position. Just know the people who campaigned for him and stuck by him are obvious choices for a role in the administration. Everything else is unknown!
The Never Trump’s should look for careers outside of public service for the next 8 years.
Makes sense to me Joseph. I never stopped to think that it could just be psy ops from the junk-yard dog media! They got me good!
I really do hope he drains the swamp…
It would appear that the long-expected global bond market rout has begun. Bond holders lost 1T this week and this is just the beginning. I expect a relief bounce the next few days followed by a resumption of the rout as a decades old trend reverses. The bond market will determine the destiny of the equities markets and all the banksters in all the central banks in all the world are powerless to change that. Oh they will try, no doubt, but resistance is futile.
I am struck by how many experienced traders are commenting on the fact that they are seeing things in the market that they have never seen in decades of trading. I think this is because the markets are building a historic top, not seen prior and it is at Grand Super Cycle degree. I can imagine how many people are looking at what happened this week and have become even more convinced that BTFD remains alive and well – Ichan was boasting about his 1 billion dollar futures purchase at the lows on Wednesday. There is no doubt in my mind that countless traders are eagerly waiting for the next big drop with itchy fingers, ready to go all in! Talk about a set-up for the ultimate ambush! A plunging VIX last Wednesday was a big hint that something unusual was developing. Keep an eye on what it is doing during the next decline and it could keep you from making a serious BTFD mistake. Have a great trading day everyone!
Lara, re importing data from Yahoo Finance, I can only find daily data. Is there hourly as well?
No. Sadly it’s daily only.
NYAD -205 today…the negative divergence continues…
Thanks for the chart Philip. You always post really insightful ones.
Thanks for updating Lara.
Exciting times! 🙂