
A small inside day printed a small red doji candlestick. The Elliott wave counts remain the same.
Some divergence today is noted between price and the AD line, and between price and VIX. This may assist to indicate the direction for tomorrow.
Summary: Upwards movement is expected overall towards 2,175. Corrections initially should find strong support at the lilac trend line. A bullish outlook at least short term is supported today by divergence between price and VIX, and price and the AD line. Only if price moves below 2,111.05 would a deeper pullback be expected to be underway.
Last monthly chart for the main wave count is here.
New updates to this analysis are in bold.
MAIN WAVE COUNT
WEEKLY CHART
Click chart to enlarge.
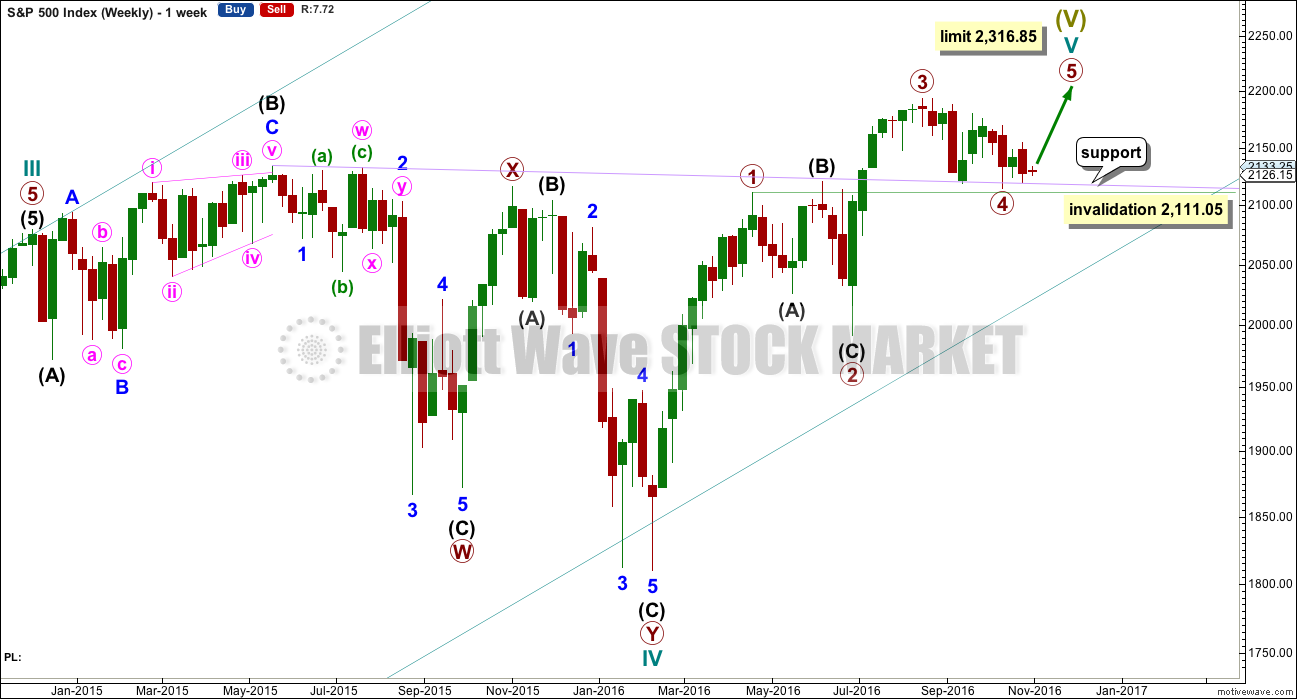
Cycle wave V must subdivide as a five wave structure. I have two wave counts for upwards movement of cycle wave V. This main wave count is presented first because we should assume the trend remains the same until proven otherwise. Assume that downwards movement is a correction within the upwards trend, until proven it is not.
Primary wave 3 is shorter than primary wave 1, but shows stronger momentum and volume as a third wave normally does. Because primary wave 3 is shorter than primary wave 1 this will limit primary wave 5 to no longer than equality in length with primary wave 3, so that the core Elliott wave rule stating a third wave may not be the shortest is met. Primary wave 5 has a limit at 2,316.85.
Primary wave 2 was a shallow 0.40 expanded flat correction. Primary wave 4 may have ended as a shallow 0.39 double zigzag. There is no alternation in depth, but there is good alternation in structure.
Primary wave 4 may not move into primary wave 1 price territory below 2,111.05.
It is also possible to move the degree of labelling within cycle wave V all down one degree. It may be only primary wave 1 unfolding. The invalidation point for this idea is at 1,810.10. That chart will not be published at this time in order to keep the number of charts manageable. The probability that this upwards impulse is only primary wave 1 is even with the probability that it is cycle wave V in its entirety.
When the five wave structure upwards labelled primary wave 5 is complete, then my main wave count will move the labelling within cycle wave V all down one degree and expect that only primary wave 1 may be complete. The labelling as it is here will become an alternate wave count. This is because we should always assume the trend remains the same until proven otherwise. We should always assume that a counter trend movement is a correction, until price tells us it’s not.
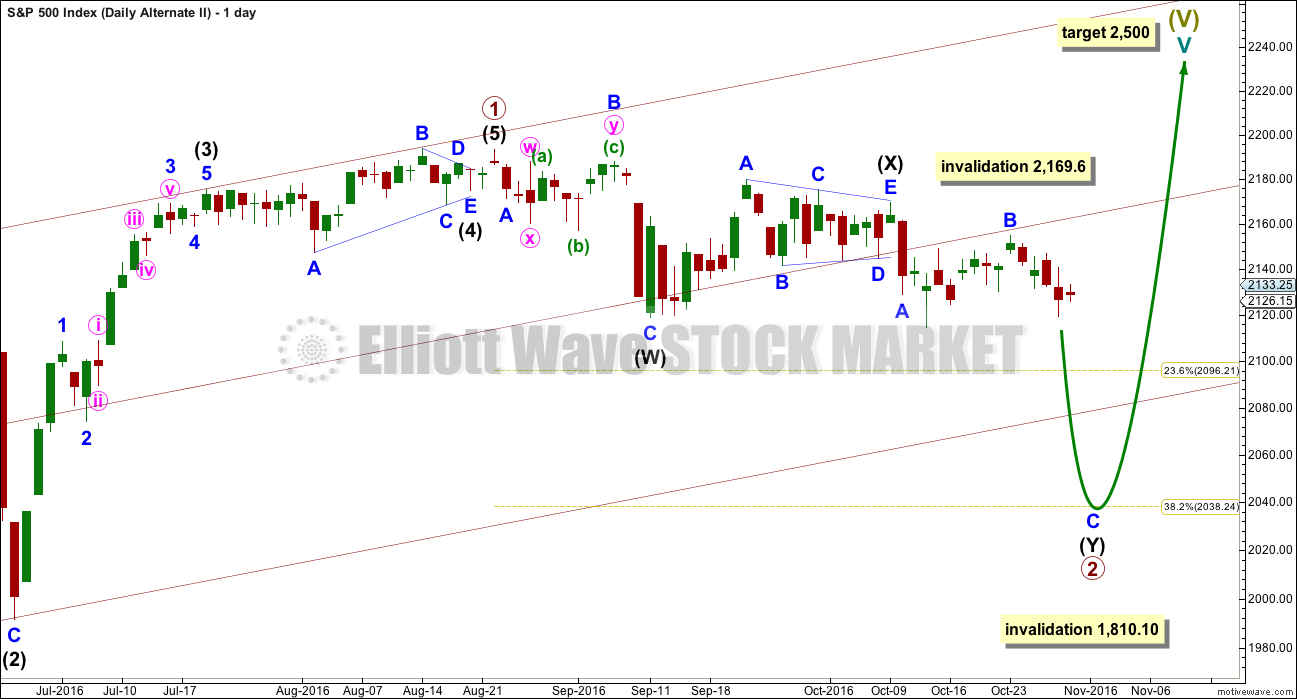
DAILY CHART
Click chart to enlarge.
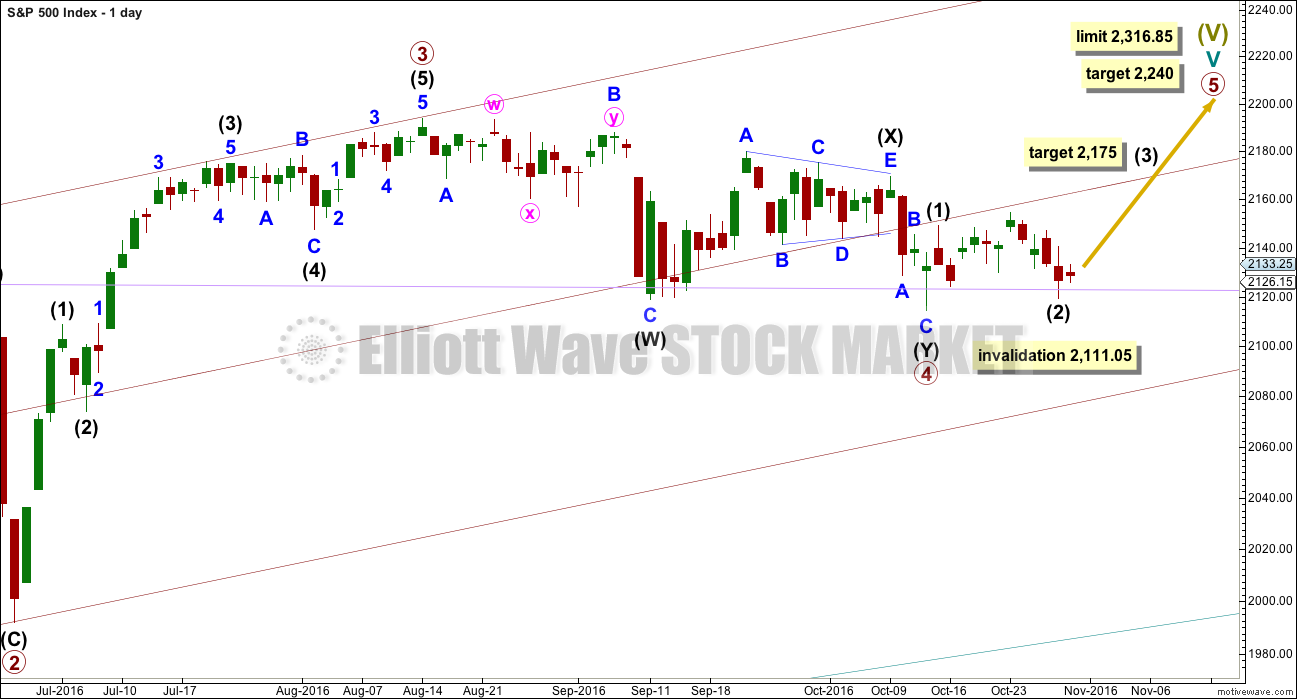
Primary wave 3 is 16.14 points longer than 0.618 the length of primary wave 1. This is a reasonable difference. But as it is less than 10% the length of primary wave 3, it is my judgement that it is close enough to say these waves exhibit a Fibonacci ratio to each other.
If this pattern continues, then about 2,240 primary wave 5 would reach 0.618 the length of primary wave 3. If this target is wrong, it may be too high. When intermediate waves (1) through to (4) are complete, then the target may be changed as it may be calculated at a second degree.
Within cycle wave V, so far primary wave 3 is shorter than primary wave 1 in length. So that the rule stating a third wave may not be the shortest is met, this limits primary wave 5 to no longer than equality in length with primary wave 3 at 2,316.85.
There is good proportion for this wave count. Primary wave 1 lasted 46 days, primary wave 2 lasted 47 days, primary wave 3 lasted a Fibonacci 34 days, and primary wave 4 lasted 42 days. So far primary wave 5 has lasted twelve days. With the very slow pace of primary wave 5 so far, if it exhibits a Fibonacci duration when complete, that may now be a Fibonacci 21 days and that would see it end on the 10th of November (give or take one day either side).
Primary wave 4 fits perfectly as a double zigzag. The second zigzag in the double should have ended with a small overshoot of the lilac trend line. This line should provide very strong support. There is almost no room left for primary wave 4 to move into.
If primary wave 4 continues any further, it may not move into primary wave 1 price territory below 2,111.05. This is the final invalidation point for this main wave count.
Primary wave 5 must be a five wave structure, so it is most likely to be a simple impulse. It would be very likely to make at least a slight new high above the end of primary wave 3 at 2,193.81 to avoid a truncation. At this stage, it still looks more like an impulse rather than an ending diagonal. But if it starts to unfold in a series of zigzags, then a diagonal will be charted as well. Fifth waves are more commonly impulses than ending diagonals.
Because primary wave 5 must be shorter in length than primary wave 3, each of its sub-waves should be shorter in length and duration. For this reason intermediate waves (1) and (2) are labelled as complete within primary wave 5. Intermediate wave (2) may have ended when price came to slightly overshoot the lilac trend line on the 28th of October.
HOURLY CHART
Click chart to enlarge.
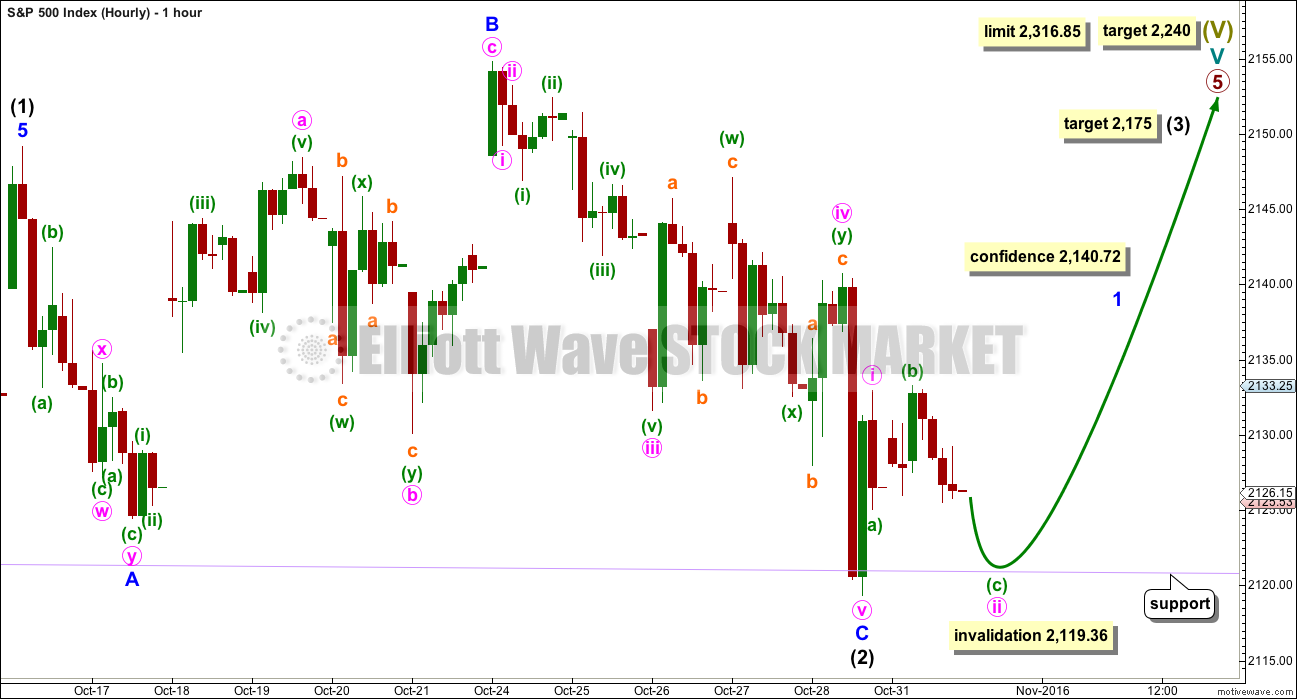
Intermediate wave (2) may have ended as an expanded flat correction.
Minor wave A fits as a double zigzag, which is classified as a three. Minor wave B fits as a zigzag and is a 1.23 length of minor wave A, within the normal range of 1 to 1.38.
Minor wave C has ended below the end of minor wave A at 2,124.43 avoiding a truncation.
Intermediate wave (2) ends with a small overshoot of the lilac trend line. This line has now been tested for support six times (at the daily chart level) and so far it has held. Each test strengthens the line. It is likely to continue to provide support.
Minute wave ii may move a little lower tomorrow to complete a small expanded flat correction. If it gets down to the lilac trend line, then it would be expected to end there. It may not move beyond the start of minute wave i below 2,119.36.
At 2,175 intermediate wave (3) would reach 1.618 the length of intermediate wave (1). This target may be met within one or two weeks.
ALTERNATE WAVE COUNT
WEEKLY CHART
Click chart to enlarge.
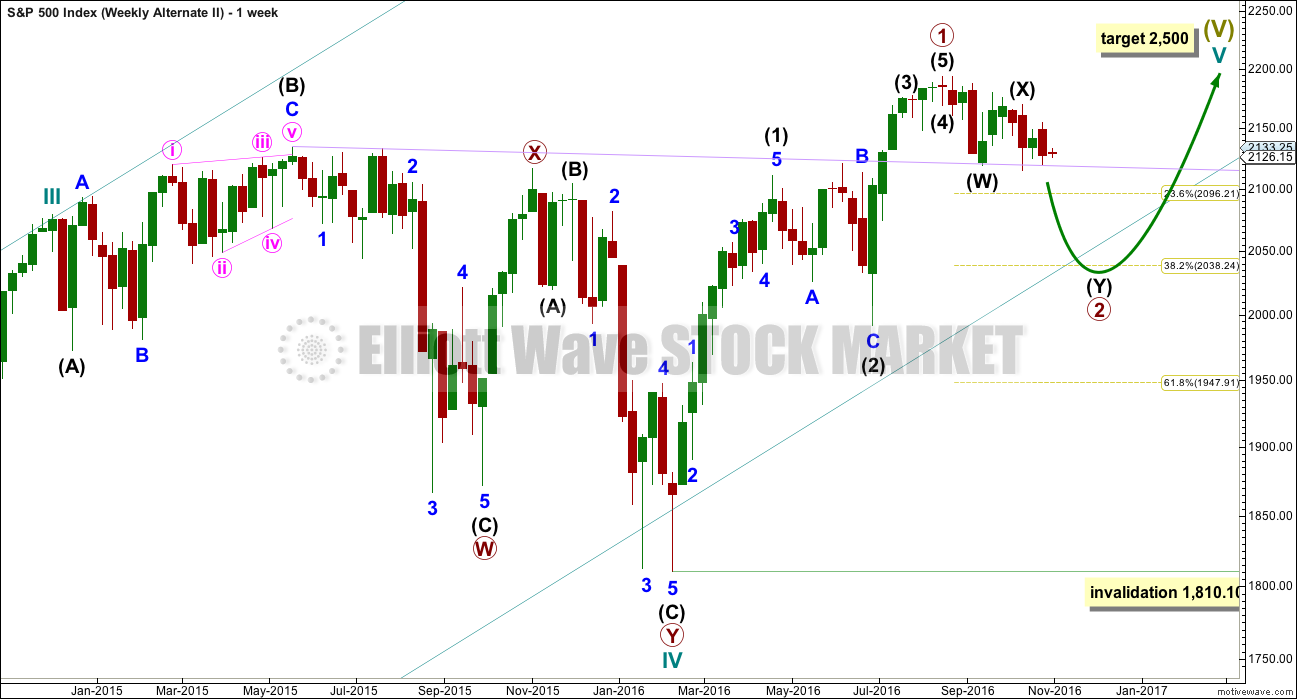
What if an impulse upwards is complete? The implications are important. If this is possible, then primary wave 1 within cycle wave V may be complete.
With downwards movement from the high of primary wave 1 now clearly a three and not a five, the possibility that cycle wave V and Super Cycle wave (V) are over has substantially reduced. This possibility would be eliminated if price can make a new all time high above 2,193.81.
If an impulse upwards is complete, then a second wave correction may be unfolding for primary wave 2. Expectations on how deep primary wave 2 is likely to be are now adjusted. It may be expected now to more likely only reach the 0.382 Fibonacci ratio about 2,038.
At this stage, it looks like price has found strong support at the lilac trend line.
Primary wave 2 may not move beyond the start of primary wave 1 below 1,810.10.
DAILY CHART
Click chart to enlarge.
If an impulse upwards is complete, then how may it subdivide and are proportions good?
Intermediate wave (1) was an impulse lasting 47 days. Intermediate wave (2) was an expanded flat lasting 47 days. Intermediate wave (3) fits as an impulse lasting 16 days, and it is 2.04 points short of 0.618 the length of intermediate wave (1). So far this alternate wave count is identical to the main wave count (with the exception of the degree of labelling, but here it may also be moved up one degree).
Intermediate wave (4) may have been a running contracting triangle lasting 22 days and very shallow at only 0.0027 the depth of intermediate wave (3). At its end it effected only a 0.5 point retracement. There is perfect alternation between the deeper expanded flat of intermediate wave (2) and the very shallow triangle of intermediate wave (4). All subdivisions fit and the proportion is good.
Intermediate wave (5) would be very brief at only 18.29 points. Intermediate wave (5) is 1.43 points longer than 0.056 the length of intermediate wave (1).
At this stage, primary wave 2 now has a completed zigzag downwards that did not reach the 0.236 Fibonacci ratio. It is very unlikely for this wave count that primary wave 2 is over there; the correction is too brief and shallow. Upwards movement labelled intermediate wave (X) is so far less than 0.9 the length of the prior wave down labelled intermediate wave (W). The minimum for a flat correction has not been met. Primary wave 2 may continue lower as a double zigzag. A second zigzag in the double may be required to deepen the correction closer to the 0.382 Fibonacci ratio.
Intermediate wave (W) lasted a Fibonacci 13 sessions. Intermediate wave (X) is a complete triangle. X waves may subdivide as any corrective structure (including multiples), and a triangle is possible here.
If minor wave B within the second zigzag of intermediate wave (Y) moves any higher, it may not move beyond the start of minor wave A above 2,169.60.
Primary wave 2 may not move beyond the start of primary wave 1 below 1,810.10. A new low below this point would see the degree of labelling within cycle wave V moved up one degree. At that stage, a trend change at Super Cycle degree would be expected and a new bear market to span several years would be confirmed.
HOURLY CHART
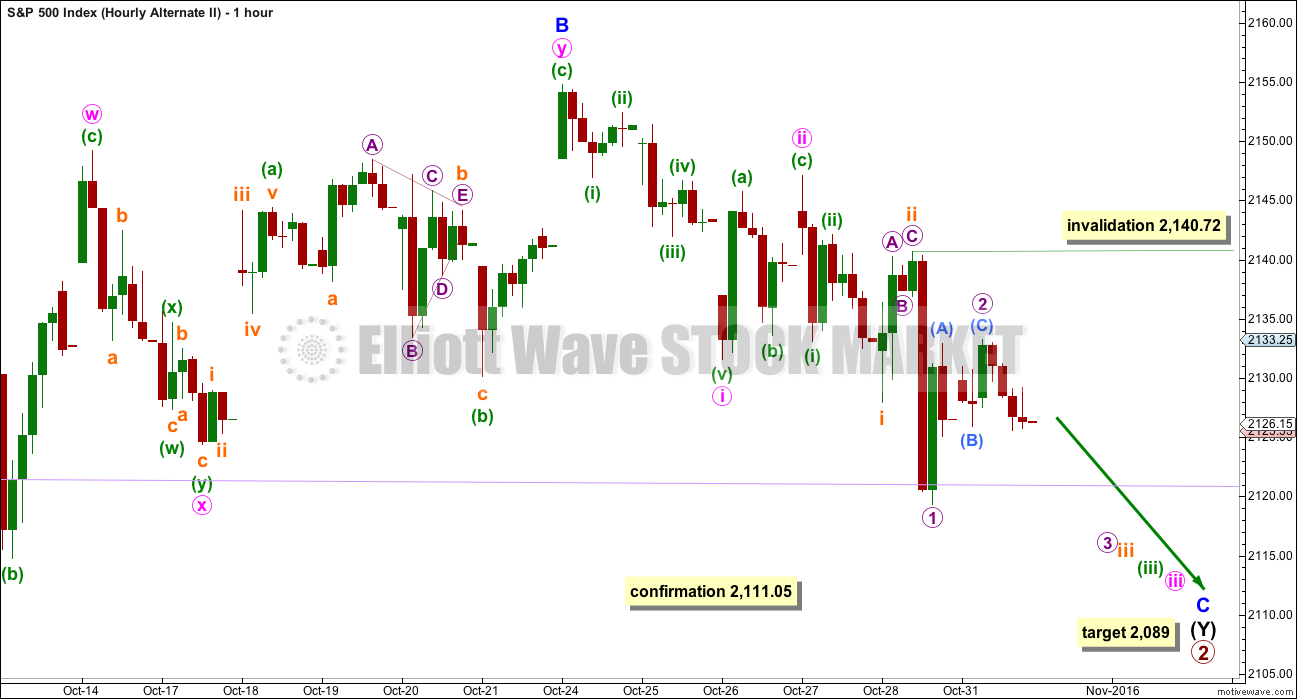
Click chart to enlarge.
At 2,089 minor wave C would reach 1.618 the length of minor wave A. This would take intermediate wave (Y) somewhat below the end of intermediate wave (W), achieving its purpose of deepening the correction.
This wave count requires confirmation with a new low below 2,111.05 before it should be used.
Prior to that price confirmation, this wave count would substantially increase in probability if price breaks clearly and cleanly below the lilac trend line. Since price broke above this line on the 8th of July, 2016, it has provided very strong support. It has been tested for support six times now and has not yet had an hourly candlestick fully below and not touching the line. It has been overshot but not breached. If a full hourly candlestick prints fully below the line, that would be the earliest signal that this alternate may be correct and a deeper more sustained correction is underway.
Within minor wave C, there may now be a series of four overlapping first and second waves. At the hourly chart level, this wave count does have a slightly better fit for this piece of downwards movement than the main hourly wave count does. This wave count now expects to see strong downwards movement on Tuesday as the middle of a third wave down unfolds. If this wave count is correct, it should be confirmed early this week.
TECHNICAL ANALYSIS
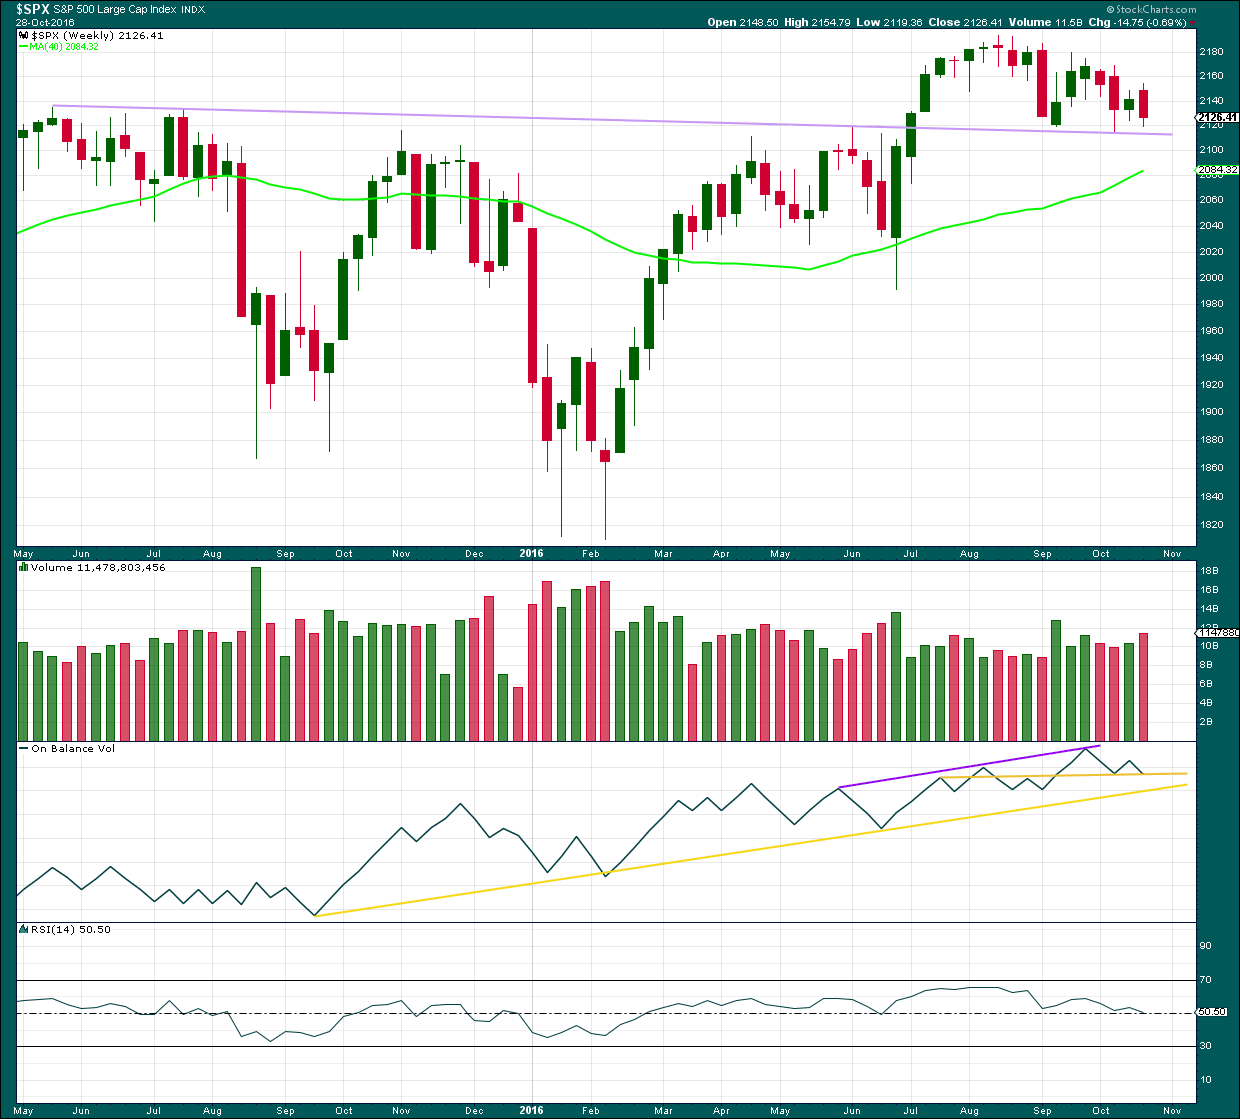
WEEKLY CHART
Click chart to enlarge. Chart courtesy of StockCharts.com.
The lilac trend line has strong technical significance. Price broke through resistance, turned down to test support for the first time, and then moved up and away from this line. It was reasonable to conclude that a new all time high is a likely consequence of this typical behaviour.
Now price has come back down for a third test of the lilac trend line. This line is expected to continue to provide support because support at this line is so strong. A break below this line would be a highly significant bearish signal.
Last downwards week closes red and has support from volume. Increased volume this week is bearish.
At the weekly chart level, On Balance Volume may find support here at the horizontal yellow trend line, which may halt a further fall in price. This support line on OBV in conjunction with the lilac support line for price are strong indicators that downwards movement is very likely to be over.
RSI is still close to neutral. There is plenty of room for price to rise further.
DAILY CHART
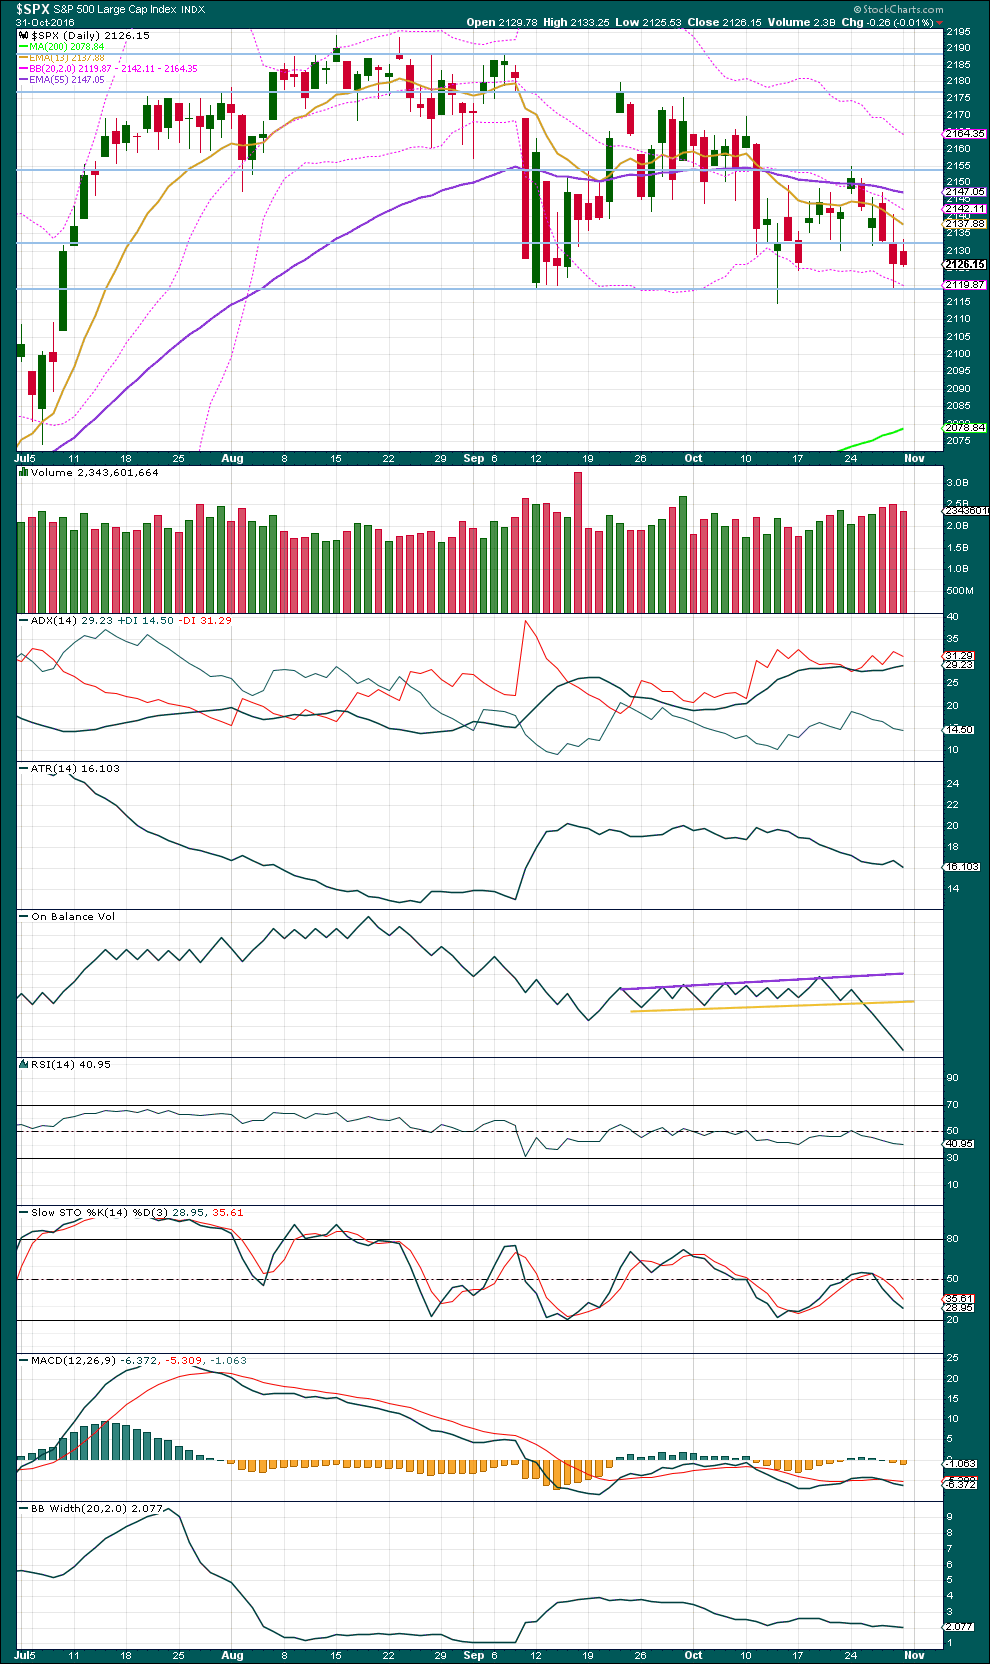
Click chart to enlarge. Chart courtesy of StockCharts.com.
Overall, price moved lower for Monday’s session. Volume declined, so the fall in price was not supported by volume. This offers some small support for the main Elliott wave count today.
Price may find strong support here about 2,120 and at the lilac trend line (not shown on this chart, refer to the Elliott wave charts). This support favours the main Elliott wave count over the alternate.
ADX is increasing, indicating the market is trending downwards. However, most concerning for Bears, this does not look like a normal healthy trend. ATR is overall still declining and Bollinger Bands are still steady and not widening. This trend lacks range and volatility, and it is not healthy. With price touching the lower edge of the Bollinger Bands on Friday, this should also offer support and a bounce about here would be typical behaviour. If a second test of the lower edge of Bollinger bands and support is seen tomorrow, then expectations for an upwards bounce to follow would be stronger.
The bearish signal from On Balance Volume on the 26th of October has played out with three days afterwards of overall downwards movement to new lows. This bearish signal may now be resolved. Divergence at this stage between price and OBV continues to be unreliable, so it will be given no weight in this analysis today.
The support for OBV at the weekly chart level may assist with support for price to stop downwards movement here.
There is a little bullish divergence between price and MACD between the lows of the 17th of October and the 28th of October: price has made a lower low, but MACD has failed to make a corresponding new low. This is hidden bullish divergence and supports the main wave count. It should be only given a very little weight though because it is not always very reliable.
Overall, the balance of evidence today is judged to be bullish.
VOLATILITY – INVERTED VIX CHART
Click chart to enlarge. Chart courtesy of StockCharts.com.
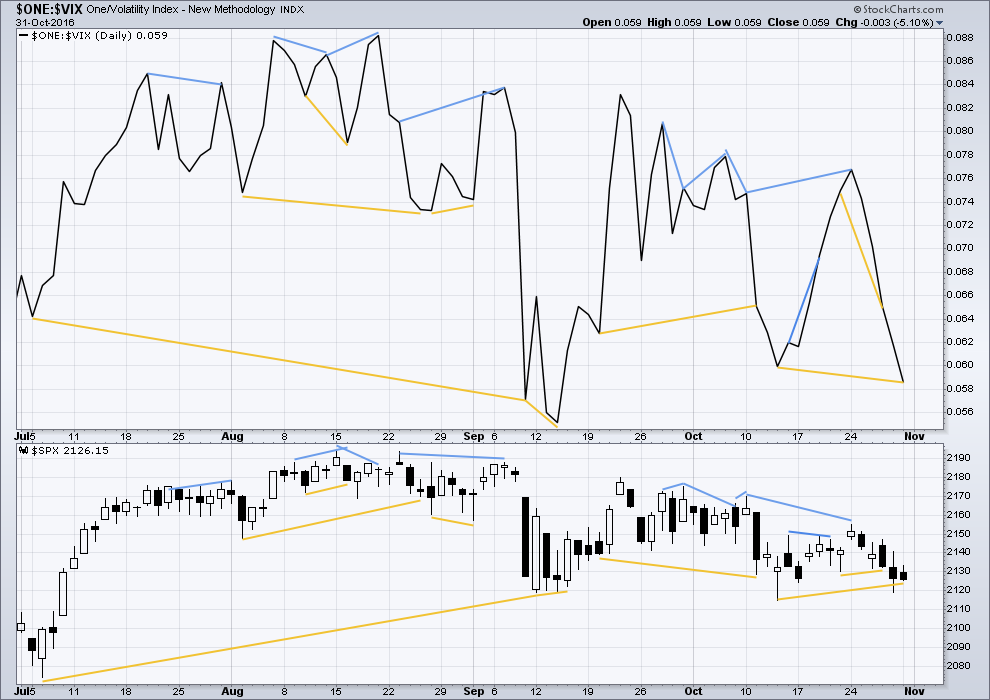
There are a few instances of multi day divergence between price and inverted VIX noted here. Bearish divergence is blue. Bullish divergence is yellow. It appears so far that divergence between inverted VIX and price is again working to indicate short term movements spanning one or two days.
There is new divergence today between price and inverted VIX: inverted VIX has made a new low, but price has failed to make a corresponding new low. This is hidden bullish divergence and indicates weakness in price. It may be followed by one to two days of upwards movement.
BREADTH – AD LINE
Click chart to enlarge. Chart courtesy of StockCharts.com.
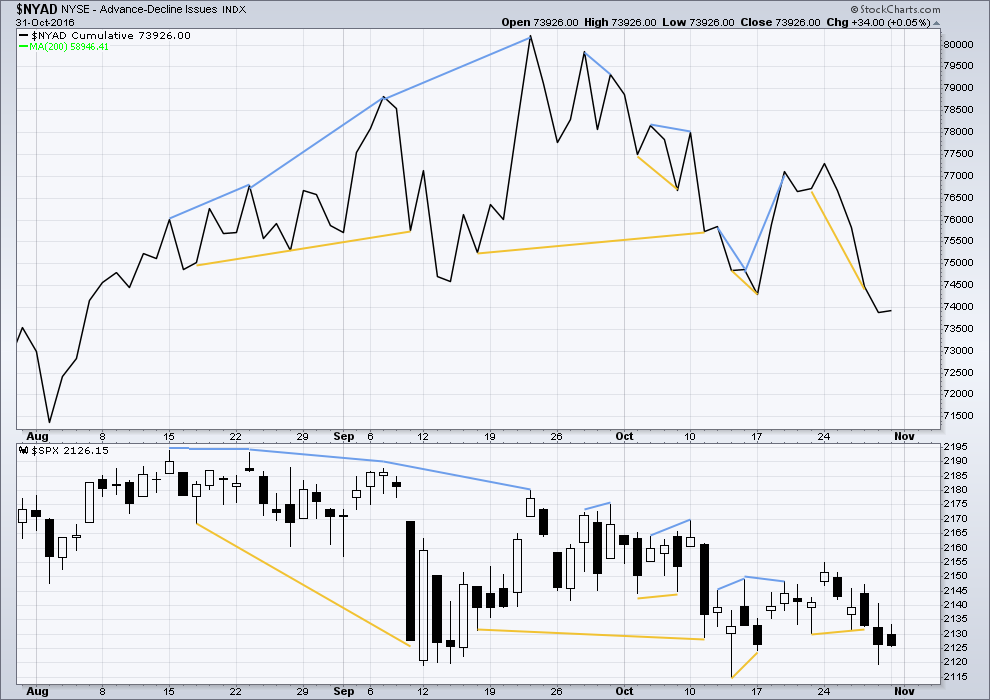
Short term bullish and bearish divergence is again working between price and the AD line to show the direction for the following one or two days.
Single day divergence today between the direction of price and the direction of the AD line is noted: price moved overall lower to print a red daily candlestick, but the AD line moved upwards. Underlying market breadth improved today although price moved lower. This indicates weakness in price, and it is interpreted as bullish.
DOW THEORY
Major lows within the old bull market:
DJIA: 15,855.12 (15th October, 2014) – closed below on 25th August, 2015.
DJT: 7,700.49 (12th October, 2014) – closed below on 24th August, 2015.
S&P500: 1,821.61 (15th October, 2014) – has not closed below this point yet.
Nasdaq: 4,117.84 (15th October, 2014) – has not closed below this point yet.
Major highs within the bear market from November 2014:
DJIA: 17,977.85 (4th November, 2015) – closed above on 18th April, 2016.
DJT: 8,358.20 (20th November, 2015) – has not closed above this point yet.
S&P500: 2,116.48 (3rd November, 2015) – closed above this point on 8th June, 2016.
Nasdaq: 5,176.77 (2nd December, 2015) – closed above this point on 1st August, 2016.
Dow Theory Conclusion: Original Dow Theory still sees price in a bear market because the transportations have failed to confirm an end to that bear market. Modified Dow Theory (adding S&P and Nasdaq) has failed still to confirm an end to the old bull market, modified Dow Theory sees price still in a bull market.
This analysis is published @ 10:49 p.m. EST on 29th October, 2016.
I am in a state of shock! Shock! I tell you. I just popped into my inbox and there was a solicitation letter from……KARL ROVE???!!!!!
How in tarnation did that miserable miscreant get hold of my e-mail address?! And worse, what in Thor’s name would make him think that I would be willing to give the likes of him even one stinking penny???!!! You gotta be kidding me!! 🙂 🙂 🙂
ROTFL
I’m guessing…. you’re not a fan of Mr Rove then Verne.
Miserable miscreant. Love it. 🙂
Not a fan would be an understatement! 🙂
Verne
All of your contact info ……. It’s public record
Sometimes I forget what an open book our lives have become in an internet age…
We should get a new VIX high tomorrow with a red candle by the close to signal the move down is complete – a great set-up for the 10X trade.
(Unless of course all hell is about to break loose!) Have a great evening everyone!
Hourly chart updated. This is the new main wave count, it’s been confirmed below 2,111.05.
When the third wave is done then a series of fourth and fifth waves needs to complete. Minor C has to be a complete five wave impulse.
This is the new main wave count. Minor C is not over though, it still needs a series of fourth and fifth waves down to complete its structure.
What that means for your pivots Verne is they’d been to be broken, but price would then turn up for a third wave.
I think you are right on the money on the count. I will be adding to my short positions if we close below those pivots. I took profits on half my positions during the initial decline as I was not sure if the pivots would hold. I think they are going to stay busted! At least until tomorrow, then its off to the races to the upside in a third wave up! 🙂
If price breaks below 1,810.10 then this market is very likely in a huge bear market.
For this wave count to work the triangle needs to be ignored. I don’t like how that looks, but it’s viable.
The Fear – Greed Index is now at 18 (Extreme Fear)
http://money.cnn.com/data/fear-and-greed/
They may not be anywhere near fearful enough. Complacency has prevailed for quite some time now. If we take out today’s lows they are going to become a lot more fearful I wager…and oh yeah, the banksters had better hold those pivots….
That may very well prove to be true. But we are nearing an extreme we have not seen since January 2016. Coupled with BB penetrations you and I noted earlier, we are near a bottom. Not there yet, but near. Like Sundeep, I’ll be looking to add to my long positions tomorrow or soon thereafter.
I agree my man. VIX is saying it’s time to short volatility!
Rats! Life so often works out this way: Tomorrow I will not be able to be by a computer or cell phone for most of the trading day as I am traveling to a major medical teaching institution for a serious examination of my larynx. I have not said anything here because who wants to be a downer. However, it looks like I have some surgery to face some time after tomorrow.
Have a great evening and day tomorrow.
I’m so sorry to hear that Rodney. May the examination go smoothly and if you need surgery may you recover quickly.
The markets will still be here, and so will we to welcome you back when your health is restored.
All the best with that examination Rodney. We will remember you in our prayers my friend.
I think you are going to fine sitting tight on your long positions. The move back above the round numbers means this decline is just about done I think.
Rodney,
All the best for your examination. We all will pray for the best outcome for you.
May God Bless you Rodney with a good diagnosis.
Predictably, here they come with the pivot defense. They have for the last several months always won this battle so let’s see if they can re-claim DJI 18,000.00 by the close.
selling pressure has been somewhat muted.
My concern today is what if the alternate isn’t bearish enough?
I’ve been staring and staring at the charts trying to see how the downwards movement from the last ATH could be the start of a five down. With all the overlapping and movement that looks like zigzags it doesn’t look right.
I’ll chart a series of 1-2’s and see how that looks… but there would be five of them!
Yes Lara. I think you may be onto something there. There is some monstrous bearish potential in the market based on how it has been trading the last few weeks. The very fat green VIX candlestick protruding above the upper BB generally signals that a bottom is close but still….it could be in time but not in distance, if you know what I mean….
Yeah, I know what you mean.
This market makes it’s moves while I’m fast asleep. I missed this one.
I think I’ll have to stay up tonight.
TBH I was wondering if it was just going to meander for a few more days and then move on the US election day.
It is setting up to begin the big move up on election day or the day after. So we have 4 or 5 days to complete the series of 4th and 5th waves. Perfect. And whoever wins the election, the news will say the market likes the choice. However, we know, “The market makes the news.” It is not the other way around.
So… if the new main wave count is correct then Hillary will win and the market will go up on that news.
If a more bearish scenario is correct then Trump wins and the markets go down.
Agree with you Lara.
I must say I was smiling when I heard all the comments about how the market was going to keep playing ‘possum until election today. That gave me pretty high confidence that Mr. Market was going to do no such thing! 🙂
The ideal case for the bears would be a bankster pump to come back and kiss the underside of the pivot areas and then….farewell and adieu….
I would ordinarily vouch for a bottom rapidly approaching and I am still keenly observing price action around the pivots. The bankster pump that went nowhere for months has been like water piling up behind a dam and we could be about to see a dam break. Let’s see if price falls away from the pivots at the close. If it does DJI could shed a thousand points before we’re done…
Scaled my VIX longs. Still expecting 21 where I will close most of my vix positions. I am looking to add to longs in the market between 2070-2090
Nice call Sundeep!
You are my volatility Guru 🙂
Huge market decision and possible inflection point approaching. I am expecting the banksters to defend the 18,000.00 DJI and SPX 2100.00 pivots vigorously and with good reason. The length of the sideways movements suggests that a close beneath these critical pivots will see a very steep decline unfold. I am looking for an initial break followed by a climb back above soon after. If it instead acts as resistance we’re going much lower…
Starting to build a short volatility positions via VIX, VXX and UVXY, and long SVXY. A good way to get positioned is to open “stink bids” in anticipation of a final spike higher at capitulation. The market does not offer these kinds of trade opportunities very often. They can however make up for the frustration of waiting for them to present themselves.
SPX below lower BB. VIX above upper BB. A good set up. $NYMO needs to get under its lower BB yet.
We also have a full hourly candle beneath and not touching Lara’s aqua line. Lara’s Hourly Alternate II looks good. Target 2089 SPX, only 16 points to go.
Although the main count has been invalidated, I think the downside potential could be limited. We could of course get a waterfall plunge starting now and continuing tomorrow that takes us a lot lower. VIX is signalling that a bottom is close, at least in terms of time…
@ SPX 2110, I am thinking the Alternate count is in play and the main wave count is out. I am looking for 2080 but the range could be 2095 to 2060 of so. That is the bad news for bulls.
The good new for bulls is that the Alternate count now projects a possible 2500 on the SPX.
I think we are finally approaching capitulation. We should see a bottom tomorrow with a final VIX high and close back below the upper BB.
Happy Halloween everybody!