
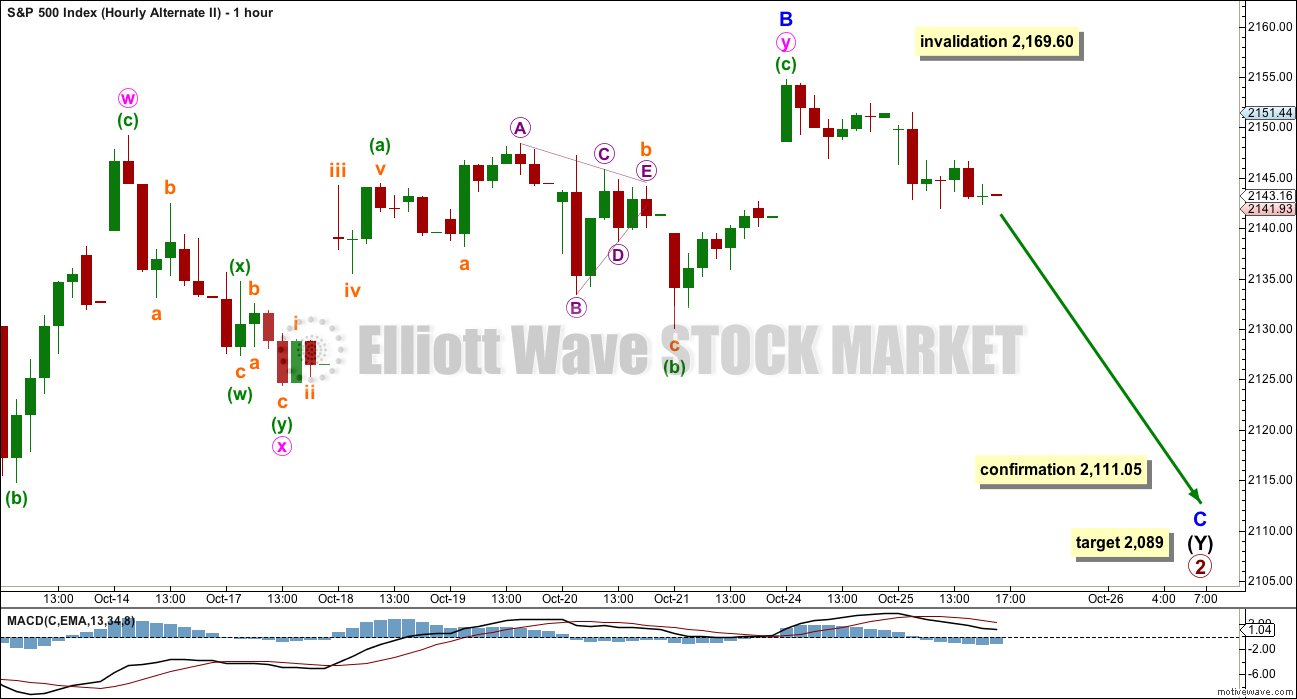
A red daily candlestick was expected for Tuesday’s session, which is exactly what happened.
The short term target was at 2,145. The low for the day was 2,141.93.
Summary: Tomorrow’s session may begin with a very little downwards movement to end close to 2,140. Thereafter, upwards movement should resume to new highs, towards the mid term target at 2,180. Use the cyan trend line on the hourly chart for support.
Last monthly chart for the main wave count is here.
New updates to this analysis are in bold.
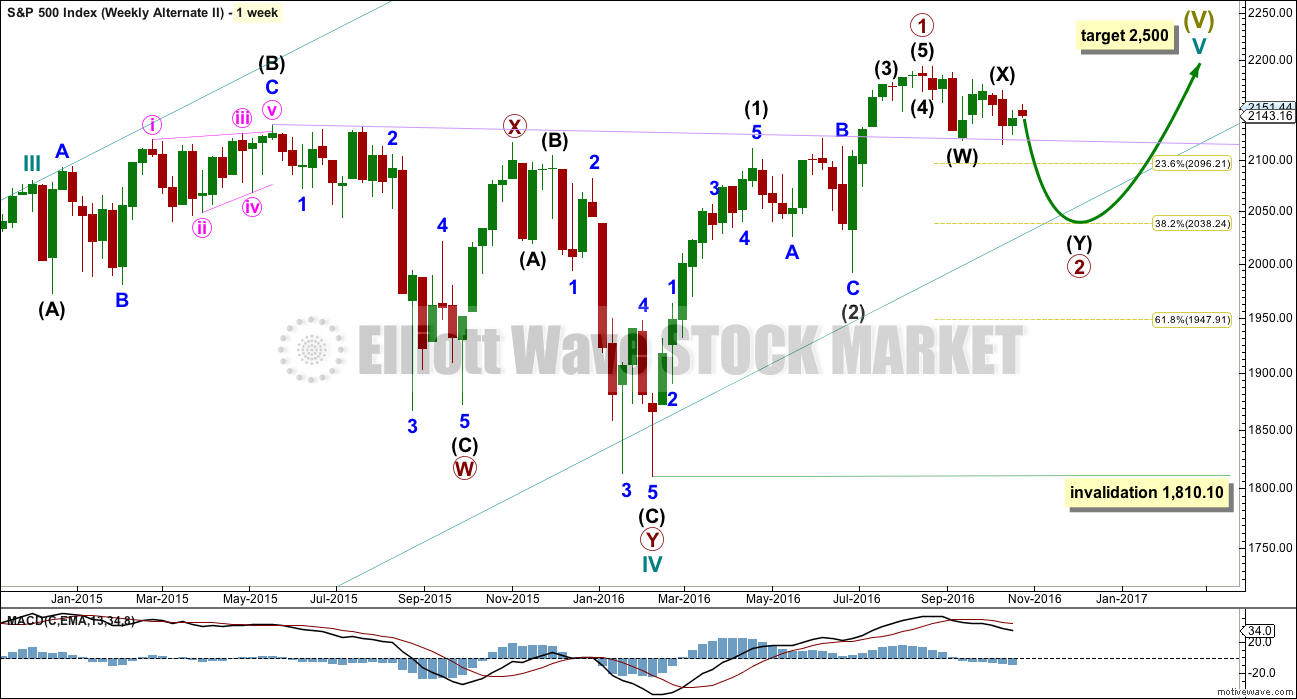
MAIN WAVE COUNT
WEEKLY CHART
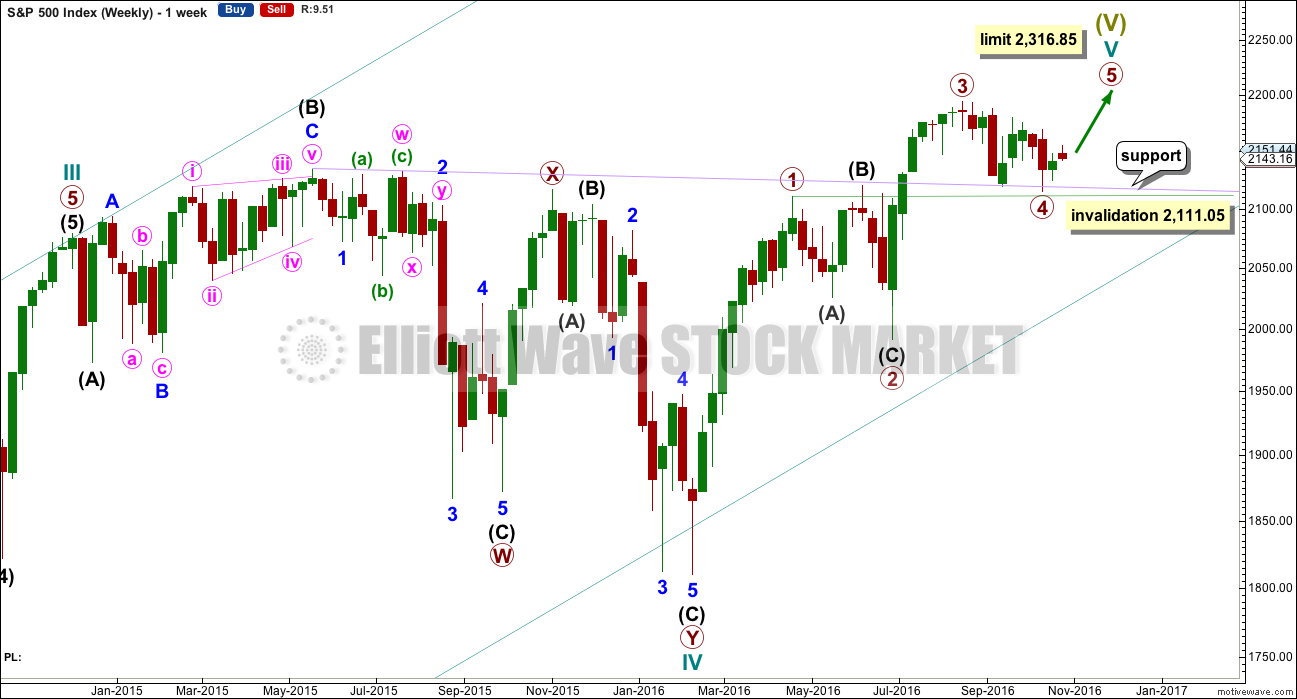
Click chart to enlarge.
Cycle wave V must subdivide as a five wave structure. I have two wave counts for upwards movement of cycle wave V. This main wave count is presented first only because we should assume the trend remains the same until proven otherwise. Assume that downwards movement is a correction within the upwards trend, until proven it is not.
Primary wave 3 is shorter than primary wave 1, but shows stronger momentum and volume as a third wave normally does. Because primary wave 3 is shorter than primary wave 1 this will limit primary wave 5 to no longer than equality in length with primary wave 3, so that the core Elliott wave rule stating a third wave may not be the shortest is met. Primary wave 5 has a limit at 2,316.85.
Primary wave 2 was a shallow 0.40 expanded flat correction. Primary wave 4 may have ended as a shallow 0.39 double zigzag. There is no alternation in depth, but there is good alternation in structure.
Primary wave 4 may not move into primary wave 1 price territory below 2,111.05.
It is also possible to move the degree of labelling within cycle wave V all down one degree. It may be only primary wave 1 unfolding. The invalidation point for this idea is at 1,810.10. That chart will not be published at this time in order to keep the number of charts manageable. The probability that this upwards impulse is only primary wave 1 is even with the probability that it is cycle wave V in its entirety.
When the five wave structure upwards labelled primary wave 5 is complete, then my main wave count will move the labelling within cycle wave V all down one degree and expect that only primary wave 1 may be complete. The labelling as it is here will become an alternate wave count. This is because we should always assume the trend remains the same until proven otherwise. We should always assume that a counter trend movement is a correction, until price tells us it’s not.
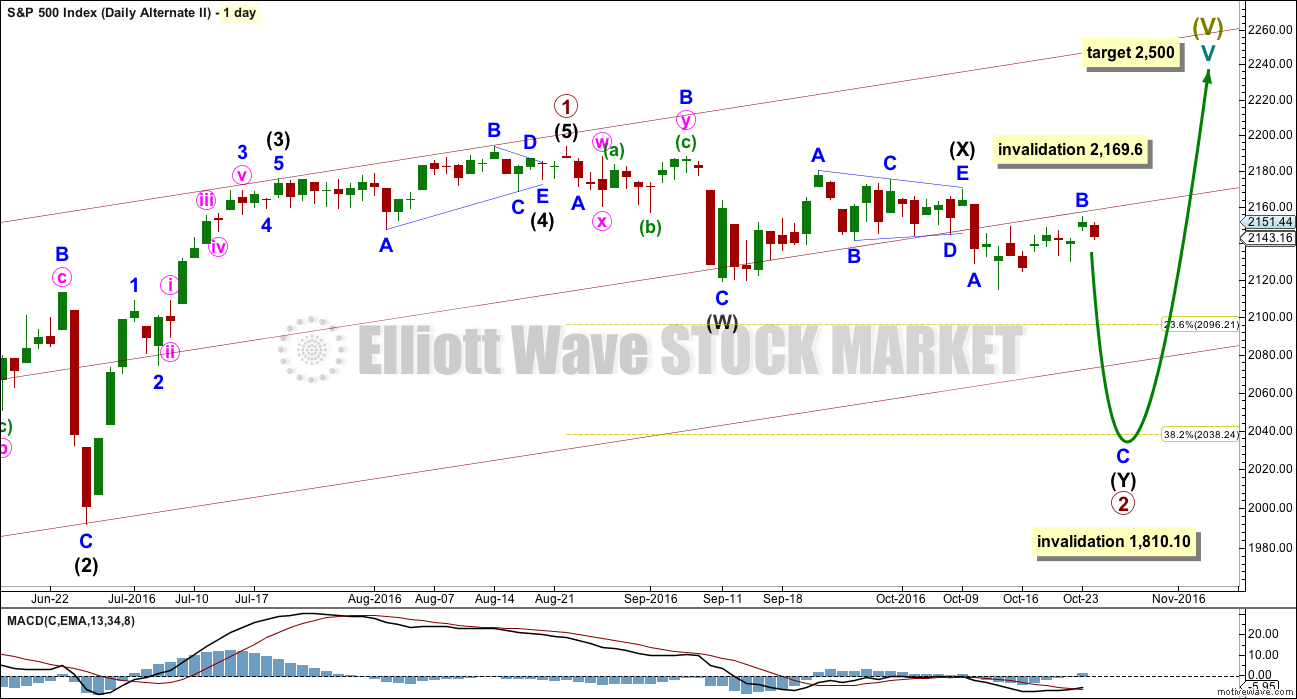
DAILY CHART
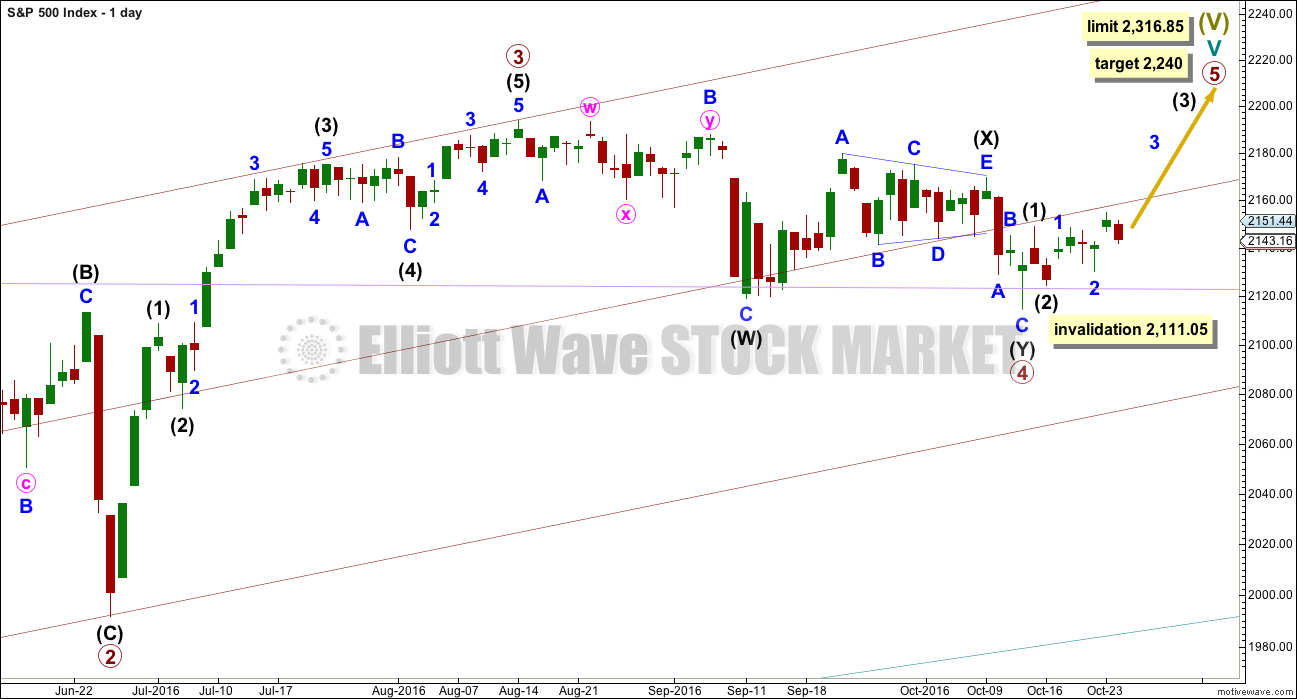
Click chart to enlarge.
Primary wave 3 is 16.14 points longer than 0.618 the length of primary wave 1. This is a reasonable difference. But as it is less than 10% the length of primary wave 3, it is my judgement that it is close enough to say these waves exhibit a Fibonacci ratio to each other.
If this pattern continues, then about 2,240 primary wave 5 would reach 0.618 the length of primary wave 3. If this target is wrong, it may be too high. When intermediate waves (1) through to (4) are complete, then the target may be changed as it may be calculated at a second degree.
There is good proportion for this wave count. Primary wave 1 lasted 46 days, primary wave 2 lasted 47 days, primary wave 3 lasted a Fibonacci 34 days, and primary wave 4 lasted 42 days. So far primary wave 5 has lasted eight days. If it exhibits a Fibonacci duration, it is likely to be more brief than primary wave 3. A Fibonacci 13 days may be reasonably likely at this stage. That would see primary wave 5 end on 1st of November. If this expectation is wrong, it may be too brief. This market is currently very slow moving.
Primary wave 4 fits perfectly as a double zigzag. The second zigzag in the double should have ended with a small overshoot of the lilac trend line. This line should provide very strong support. There is almost no room left for primary wave 4 to move into.
If primary wave 4 continues any further, it may not move into primary wave 1 price territory below 2,111.05.
Primary wave 5 must be a five wave structure, so it is most likely to be a simple impulse. It may be relatively quick, and would be very likely to make at least a slight new high above the end of primary wave 3 at 2,193.81 to avoid a truncation. So far it looks like it is unfolding as an impulse rather than an ending diagonal. Within the impulse of intermediate wave (3), the correction of minor wave 2 is now clear. This is typical for third waves of the S&P, so now at the daily chart level this part of the wave count has the right look.
Because primary wave 5 must be shorter in length than primary wave 3, each of its sub-waves should be shorter in length and duration. For this reason intermediate waves (1) and (2) are labelled as complete within primary wave 5. Intermediate wave (2) may have ended when price came to almost again touch the lilac trend line.
HOURLY CHART
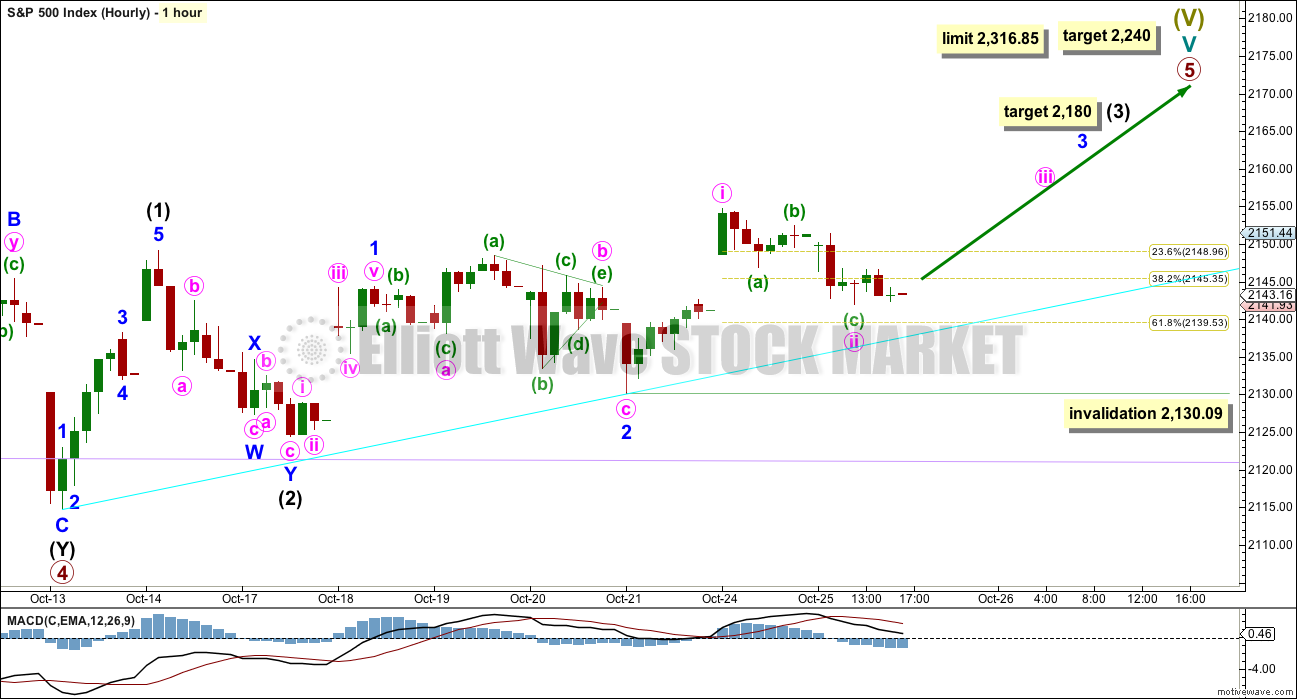
Click chart to enlarge.
The structure of minute wave ii now looks almost complete on the five minute chart. It may move slightly lower to begin tomorrow’s session, to end closer to the 0.618 Fibonacci ratio about 2,140. One final low may be required.
Thereafter, the upwards trend should resume.
There may now be three overlapping first and second waves almost complete. The next upwards movement should have an increase in momentum and should have support from volume. Each third wave must move price above the end of each first wave, far enough to allow room for a subsequent fourth wave to unfold and remain above first wave price territory.
At 2,180 intermediate wave (3) would reach 1.618 the length of intermediate wave (1).
Tomorrow, when markets open, minute wave ii may move slightly lower, but it may not move beyond the start of minute wave i below 2,130.09. Price may find support at the cyan trend line.
HOURLY CHART – ALTERNATE
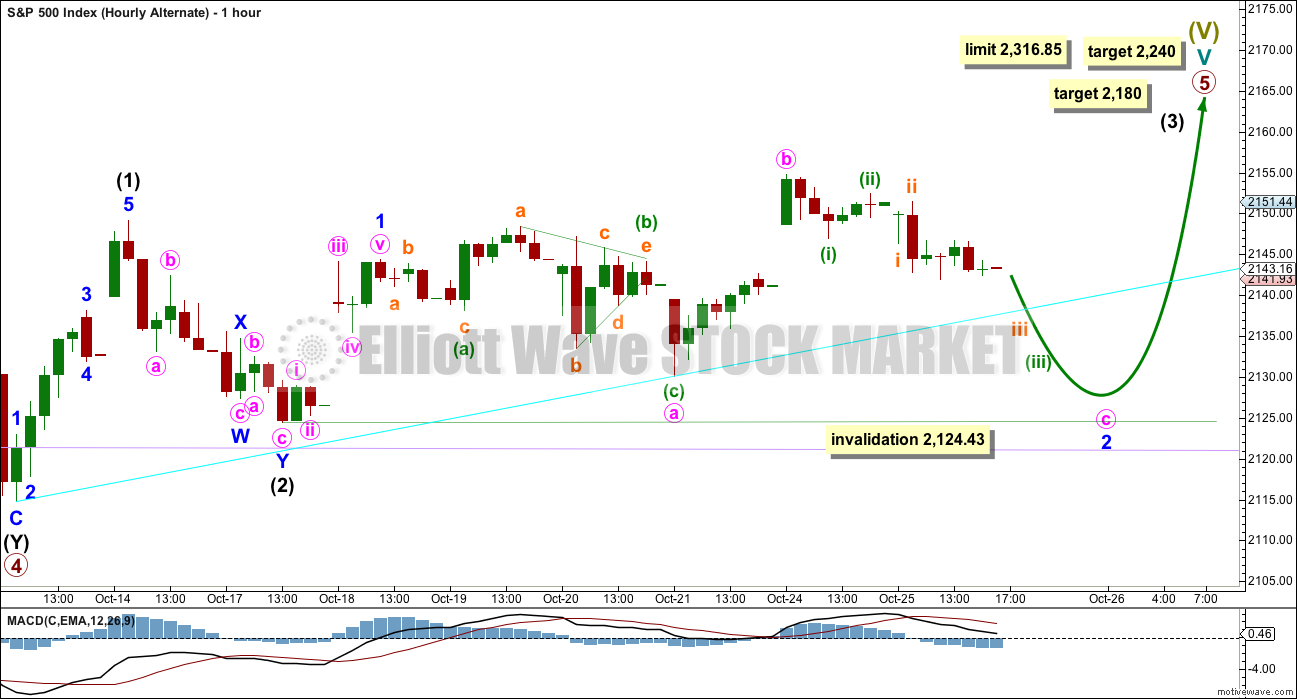
Click chart to enlarge.
What if the degree of labelling within minor wave 2 is moved all down one degree? How likely is it that minor wave 2 may be still incomplete?
If this is the case, then at its conclusion minor wave 2 would be grossly disproportionate to intermediate wave (2) one degree higher. Already minor wave 2 for the main hourly wave count is almost twice the duration of intermediate wave (2). If it were to continue, it may end as more than 3 or 4 times the duration of intermediate wave (2) giving the wave count the wrong look. This reduces the probability.
Minor wave 2 may be unfolding as an expanded flat correction. Within minor wave 2, minute wave b is a 1.74 length of minute wave a. This is a little longer than the maximum common length of up to 1.38, so this also reduces the probability of this wave count.
Minute wave c would be likely to end at least slightly below the end of minute wave a at 2,130.09 to avoid a truncation and a very rare running flat.
This wave count is still possible technically, but it does have a very low probability.
ALTERNATE WAVE COUNT
WEEKLY CHART
Click chart to enlarge.
What if an impulse upwards is complete? The implications are important. If this is possible, then primary wave 1 within cycle wave V may be complete.
With downwards movement from the high of primary wave 1 now clearly a three and not a five, the possibility that cycle wave V and Super Cycle wave (V) are over has substantially reduced. This possibility would be eliminated if price can make a new all time high above 2,193.81.
If an impulse upwards is complete, then a second wave correction may be unfolding for primary wave 2. Expectations on how deep primary wave 2 is likely to be are now adjusted. It may be expected now to more likely only reach the 0.382 Fibonacci ratio about 2,038.
At this stage, it looks like price has found strong support at the lilac trend line.
Primary wave 2 may not move beyond the start of primary wave 1 below 1,810.10.
DAILY CHART
Click chart to enlarge.
If an impulse upwards is complete, then how may it subdivide and are proportions good?
Intermediate wave (1) was an impulse lasting 47 days. Intermediate wave (2) was an expanded flat lasting 47 days. Intermediate wave (3) fits as an impulse lasting 16 days, and it is 2.04 points short of 0.618 the length of intermediate wave (1). So far this alternate wave count is identical to the main wave count (with the exception of the degree of labelling, but here it may also be moved up one degree).
Intermediate wave (4) may have been a running contracting triangle lasting 22 days and very shallow at only 0.0027 the depth of intermediate wave (3). At its end it effected only a 0.5 point retracement. There is perfect alternation between the deeper expanded flat of intermediate wave (2) and the very shallow triangle of intermediate wave (4). All subdivisions fit and the proportion is good.
Intermediate wave (5) would be very brief at only 18.29 points. Intermediate wave (5) is 1.43 points longer than 0.056 the length of intermediate wave (1).
At this stage, primary wave 2 now has a completed zigzag downwards that did not reach the 0.236 Fibonacci ratio. It is very unlikely for this wave count that primary wave 2 is over there; the correction is too brief and shallow. Upwards movement labelled intermediate wave (X) is so far less than 0.9 the length of the prior wave down labelled intermediate wave (W). The minimum for a flat correction has not been met. Primary wave 2 may continue lower as a double zigzag. A second zigzag in the double may be required to deepen the correction closer to the 0.382 Fibonacci ratio.
Intermediate wave (W) lasted a Fibonacci 13 sessions. Intermediate wave (X) is a complete triangle. X waves may subdivide as any corrective structure (including multiples), and a triangle is possible here.
If minor wave B within the second zigzag of intermediate wave (Y) moves any higher, it may not move beyond the start of minor wave A above 2,169.60.
Primary wave 2 may not move beyond the start of primary wave 1 below 1,810.10. A new low below this point would see the degree of labelling within cycle wave V moved up one degree. At that stage, a trend change at Super Cycle degree would be expected and a new bear market to span several years would be confirmed.
HOURLY CHART
Click chart to enlarge.
Intermediate wave (Y) should subdivide as a zigzag to deepen the correction.
Minor wave B may have completed as a double combination: flat – X – zigzag.
While the subwaves of W, Y and Z within combinations may be only simple corrective structures, X waves may be any type of corrective structure including a multiple. The maximum number of corrections within a multiple is three, so this rule applies to W, Y and Z and not to the X waves which move in the opposite direction and join the corrective structures within a multiple.
Minute wave x subdivides as a double zigzag in this case, and the rule is met: there are only two corrective structures in this multiple with one X wave joining them.
If minor wave B continues any further, it may not move beyond the start of minor wave A above 2,169.60.
At 2,089 minor wave C would reach 1.618 the length of minor wave A. This would take intermediate wave (Y) somewhat below the end of intermediate wave (W), achieving its purpose of deepening the correction.
This wave count requires confirmation with a new low below 2,111.05 before it should be used.
TECHNICAL ANALYSIS
WEEKLY CHART
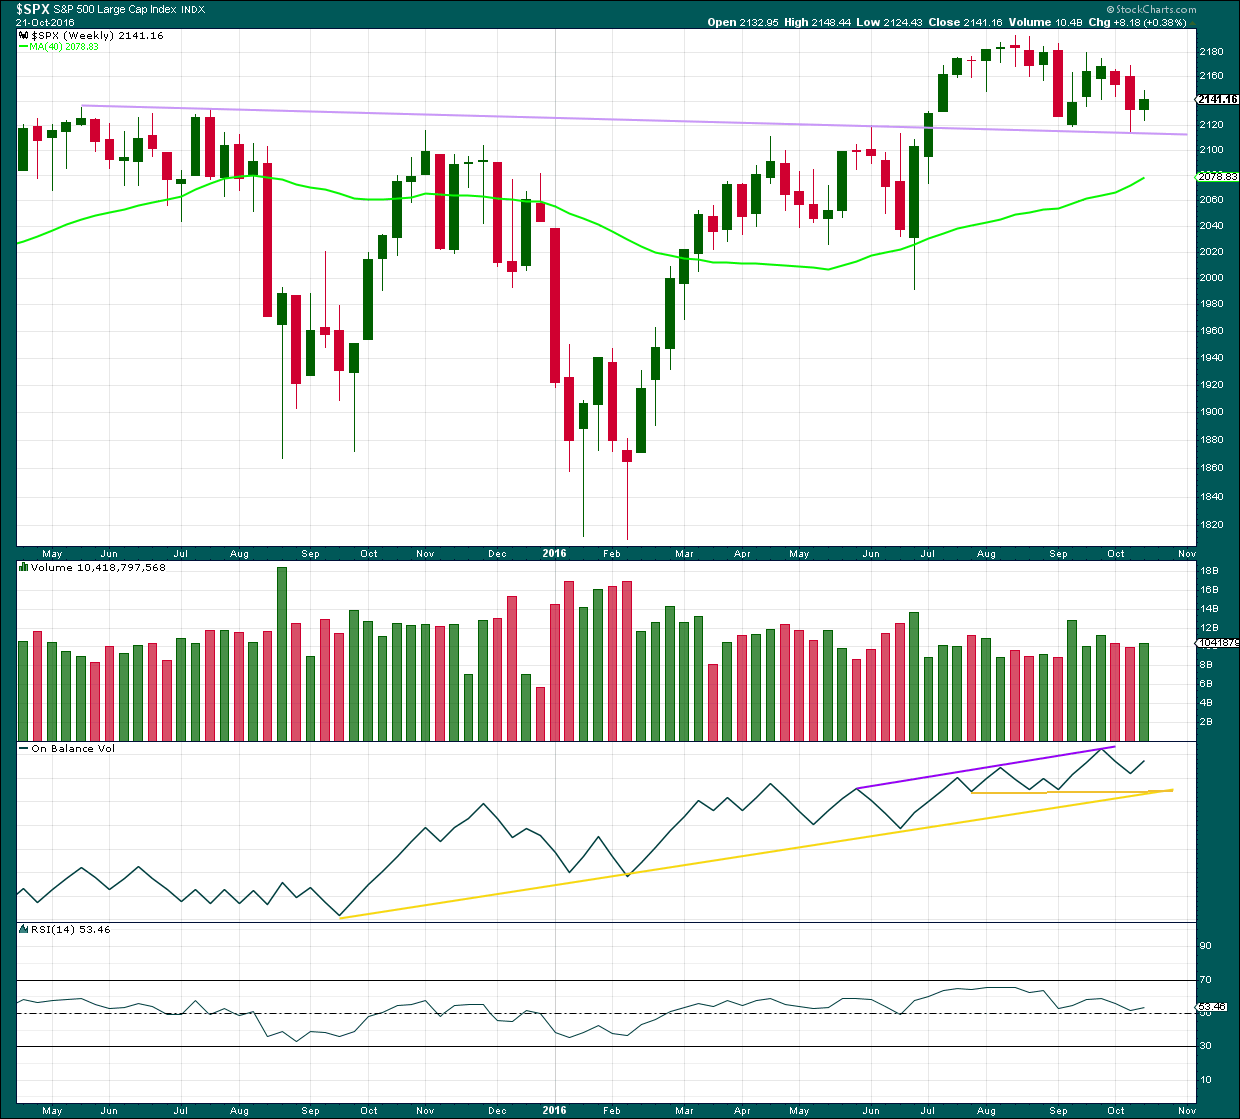
Click chart to enlarge. Chart courtesy of StockCharts.com.
The lilac trend line has strong technical significance. Price broke through resistance, turned down to test support for the first time, and then moved up and away from this line. It was reasonable to conclude that a new all time high is a likely consequence of this typical behaviour.
Now price has come back down for a second test of the lilac trend line. This line is expected to continue to provide support because support at this line is so strong. A break below this line would be a highly significant bearish signal.
A small inside week closes green. Overall, price last week moved upwards. This comes with some increase in volume to support a small rise in price, so this is bullish.
On Balance Volume has some distance to go before it finds any resistance at trend lines.
RSI is still close to neutral. There is plenty of room for price to rise further.
DAILY CHART
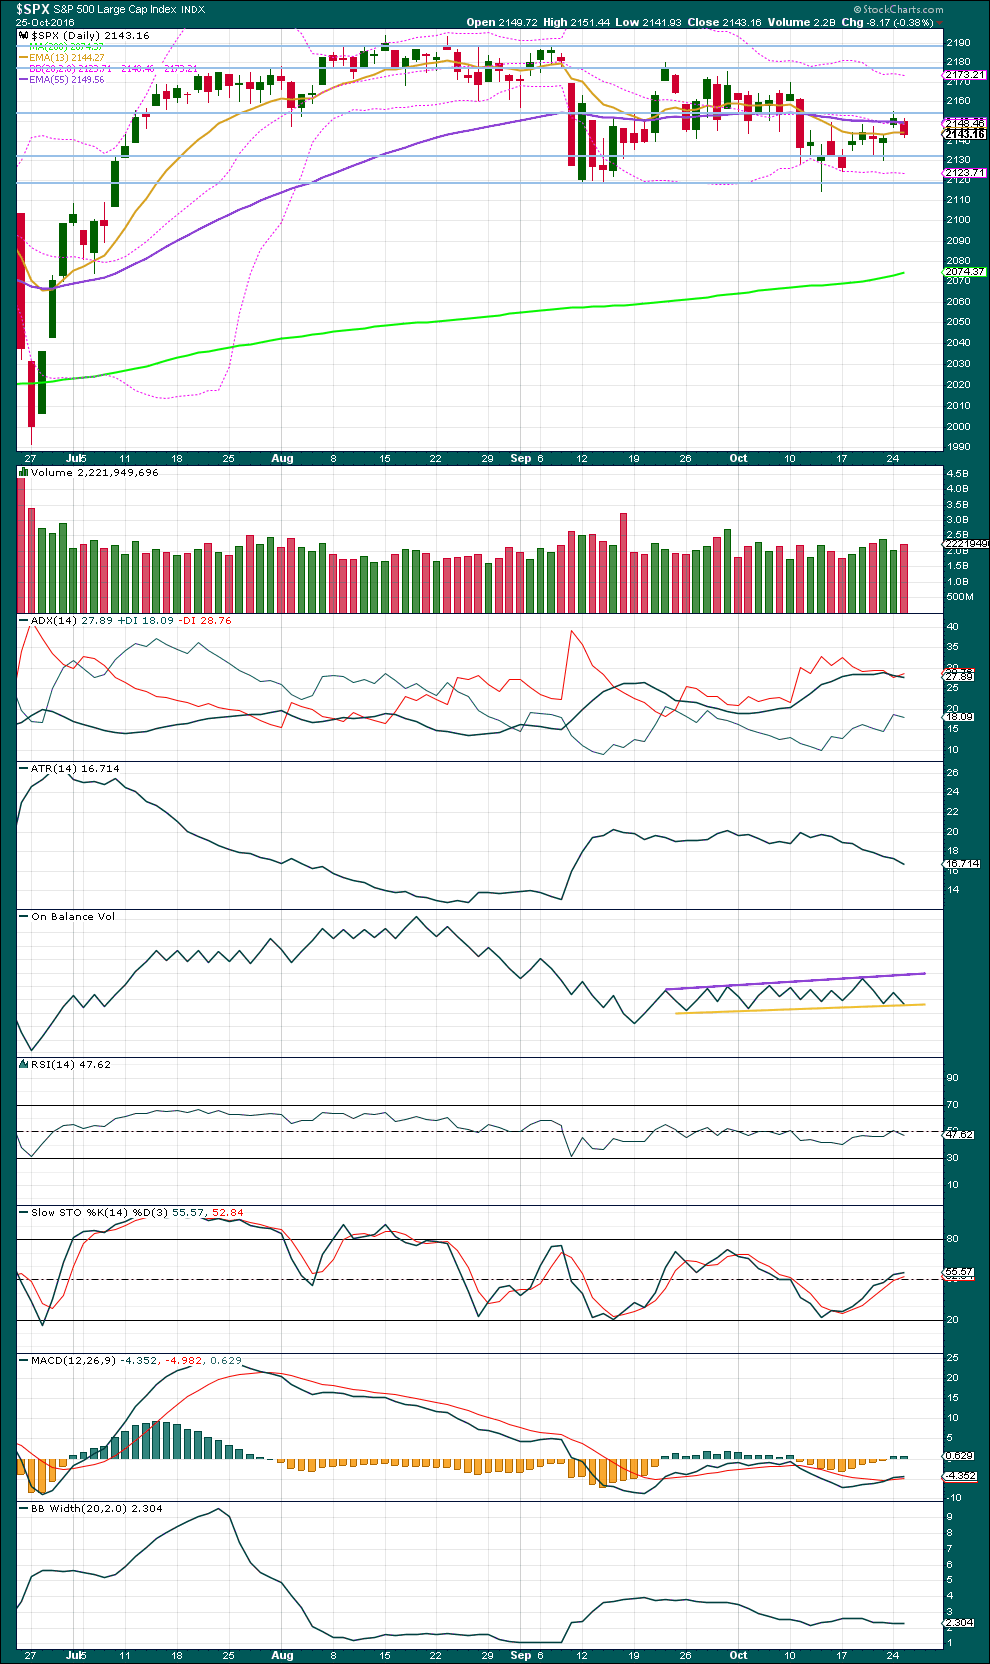
Click chart to enlarge. Chart courtesy of StockCharts.com.
A downwards day fills the pattern gap created yesterday. This day shows some increase in volume, so there was some support for downwards movement. However, volume is still lighter than the recent upwards day two days ago.
ADX is still declining, indicating the market is not yet trending. ATR agrees as it too is declining. Bollinger Bands are still tightly contracted. The market is still range bound with resistance about 2,180 and support about 2,120. During this range bound period, it remains the upwards day of 30th of September that has strongest volume suggesting an upwards breakout may be more likely than downwards. This technique does not always work, but it is one piece of evidence to weigh up.
On Balance Volume today has come down to touch the yellow support line, which should be expected to provide support and halt the fall in price overall here, because this line has strong technical significance, it is reasonably long held, shallowly sloped, and has been repeatedly tested. If OBV breaks below this line tomorrow, it would offer a strong bearish signal. A break above the purple resistance line would offer a strong bullish signal.
Price should be expected to swing from resistance to support and back again while it is consolidating. Stochastics may be used in conjunction with resistance and support to identify when each swing may end. Currently, Stochastics is returning from close to oversold. Price may be expected to move overall upwards until Stochastics reaches close to overbought and price reaches resistance. It should not be expected to move in a straight line though. That is not how consolidations unfold; they are choppy and overlapping.
VOLATILITY – INVERTED VIX CHART
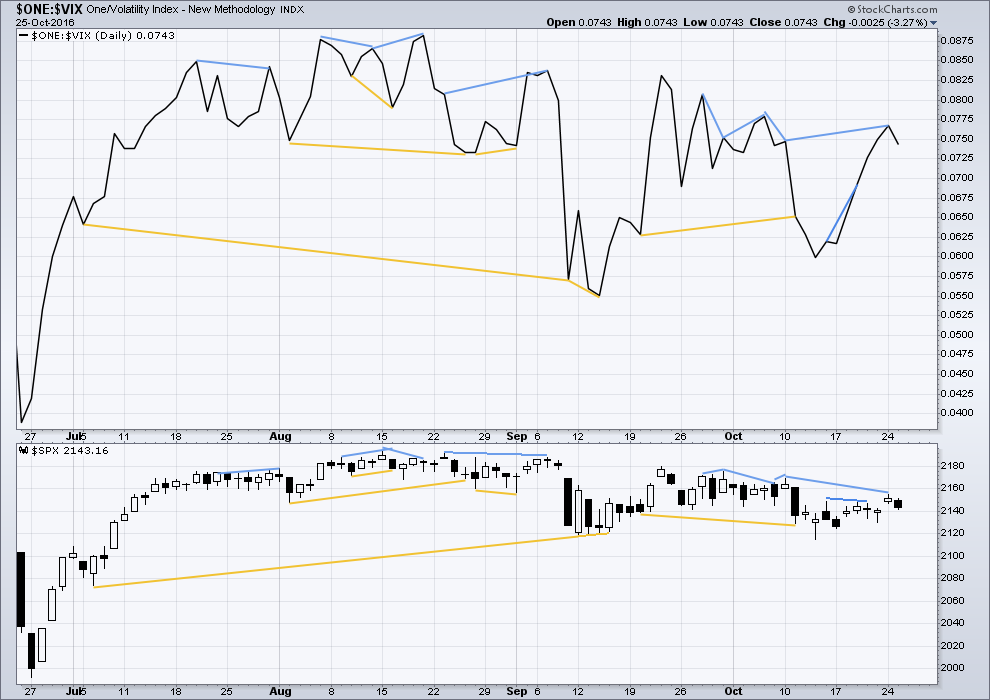
Click chart to enlarge. Chart courtesy of StockCharts.com.
There are a few instances of multi day divergence between price and inverted VIX noted here. Bearish divergence is blue. Bullish divergence is yellow. It appears so far that divergence between inverted VIX and price is again working to indicate short term movements spanning one or two days.
Bearish divergence noted in yesterday’s analysis is now followed by one downwards day. It may now be resolved, or it may require one more downwards day. No new divergence is noted today.
BREADTH – AD LINE
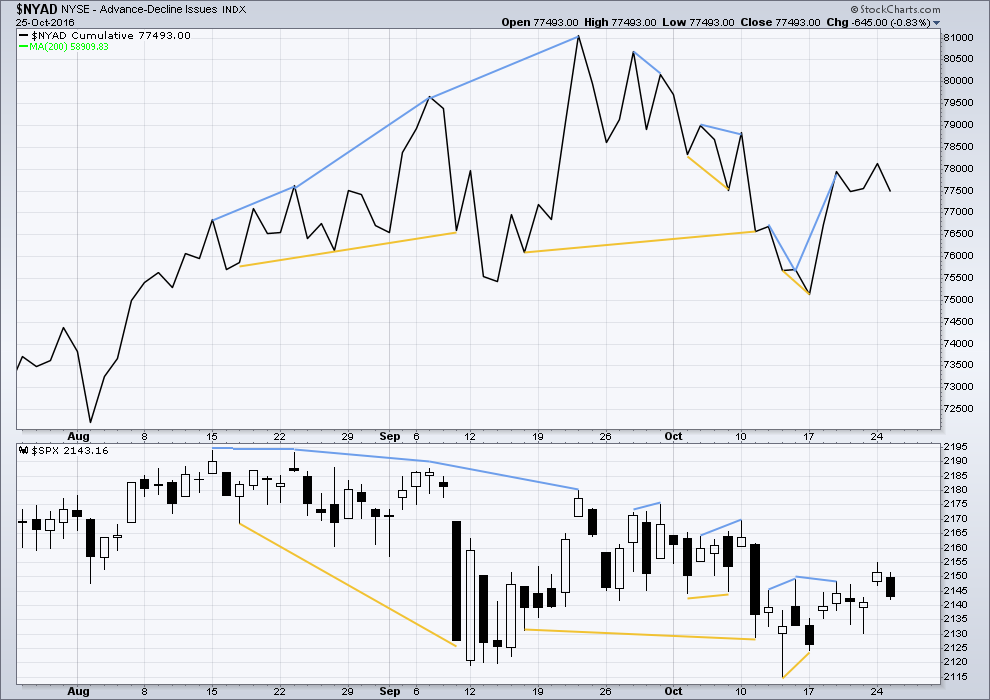
Click chart to enlarge. Chart courtesy of StockCharts.com.
Short term bullish and bearish divergence is again working between price and the AD line to show the direction for the following one or two days.
Price moved lower today as did the AD line. The AD line is essentially flat from the prior low of 20th of October, but the low for price is reasonably higher. This may be some very weak bullish divergence. Weak only because the AD line has not made a higher low; it is essentially flat.
DOW THEORY
Major lows within the old bull market:
DJIA: 15,855.12 (15th October, 2014) – closed below on 25th August, 2015.
DJT: 7,700.49 (12th October, 2014) – closed below on 24th August, 2015.
S&P500: 1,821.61 (15th October, 2014) – has not closed below this point yet.
Nasdaq: 4,117.84 (15th October, 2014) – has not closed below this point yet.
Major highs within the bear market from November 2014:
DJIA: 17,977.85 (4th November, 2015) – closed above on 18th April, 2016.
DJT: 8,358.20 (20th November, 2015) – has not closed above this point yet.
S&P500: 2,116.48 (3rd November, 2015) – closed above this point on 8th June, 2016.
Nasdaq: 5,176.77 (2nd December, 2015) – closed above this point on 1st August, 2016.
Dow Theory Conclusion: Original Dow Theory still sees price in a bear market because the transportations have failed to confirm an end to that bear market. Modified Dow Theory (adding S&P and Nasdaq) has failed still to confirm an end to the old bull market, modified Dow Theory sees price still in a bull market.
This analysis is published @ 12:04 a.m. EST on 26th October, 2016.
Main hourly chart updated.
The cyan trend line isn’t working. I’ll remove it for that reason. It was too steep and not well tested, so didn’t offer good technical significance. It is a small concern though that this line didn’t work.
Another deep second wave correction. Dammit. We’ve been here before and it hasn’t worked out. The long anticipated third wave never showed up (in the opposite direction). So… what else could be happening? What if this is wrong?
So I have the two alternates: minor 2 isn’t over, or primary 2 down is underway. Neither of those really look very good though.
All the pattern gaps are filled now. There’s a strong bullish engulfing candlestick pattern on the hourly chart off todays low. But so far the long upper wick on todays candlestick is a concern.
Lets see if the bulls have any energy to push price up at the end of this session to make this candlestick green.
Subminuette iii within minuette (a) within minute ii: subdivides as an impulse on the one minute chart. I checked it carefully. It has a disproportionate second and fourth wave correction within it that makes it look like a three on higher time frames. Not so happy with that TBH.
Watching VIX closely. A return to today’s high of 14.39 and above means an interim low is not yet in, and the bankster pre-mature meddling has now guaranteed a deeper downside move….
I’m looking for divergence today between price and VIX (inverted, easier to read).
So far I can see some between the lows for price of 21st October and today. Price has made a slightly higher low, but inverted VIX has made a lower low. If that holds I’ll be interpreting it as bullish. Hidden bullish divergence.
There is absolutely no edge in trading the indices right now IMO . Much easier stocks to trade out there.
I’m trading ’em. You just have to keep in mind the hucksterism of the banksters and beat them at their own game…these guys are nothing if not predictable…
I’m sure you’ve been in this longer than me, so I just try to take the higher probability trades, wave 4’s for me.
Hey Vern, of course I will take any tips or help that you offer. The banksters are just better than me, except for trading out of wave 4’s and I have their number on those most of the time.
They are incorrigible. They are also completely deluded and think they can ultimately control market price with their cash dumps. At some point in the not too distant future the market is going to remind them exactly who is in charge; probably smart to wait for the pivots to fall rather than trying to trade these whipsaws….
Which pivot points are you referring to? Yearly, monthly, weekly?
Round numbers. DJI 18,000.00 and SPX 2120.00
Gotcha, thanks vern. Just got 4hr sell trigger on SPY. Sold 214.5/215 spreads for .20 . Let’s see what happens.
Good grief, spread was 216.5/217.5 for .20. My brain is mush
Shorting DJI with a hard stop at today’s high of 18,236.04….
Edit: Moving stop to Monday’s high of 18,275.04
Exceeding that high would give a convincing two day bullish engulfing candle…
DJI has filled the gap down from this morning, but SPX and NDX have not. Fractured markets are unhealthy markets. The manic re-trace in DJI is meaningless unless confirmed by the other senior indices and also holds through the close…if it does not, downside action is far from done imo…
From all appearances, it does look as if the markets are developing a nascent hammer which would ordinarily portend an impending reversal. Watching the price action in the futures, it is quite apparent how totally corrupt the banksters have become both in their thinking and tactics as they constantly meddled in the price action as the market was trying to find a natural interim low. They of all people should understand the natural ebb and flow of the market. Markets must breathe, and a relentless one-directional jacking of prices that forestalls that natural process means the ultimate result is market asphyxiation. Let us see if this low holds through the close.If it does we are certainly headed higher in the near term.
We should complete wave C of minor two down today. The immediate bullish case absolutely requires that the round number pivots hold – DJI 18,000.00 and SPX 2120.00 and so far they have not been violated in the futures market which is bullish.
I think we should look for a few reversal signals – a candlestick hammer with a close well off the lows, a long VIX upper wick with a push above the upper BB, and most critically, a bounce at the afore-mentioned pivots. I plan on taking profits on all my short positions at the open as well as exiting my long volatility trades until I see how the market reacts to the round numbers. If they are taken out decisively, DJI will probably decline another 1000 points and SPX another 100. We learn today if the banksters have been check-mated, or if they have a bit of mojo left for one last hurrah…
There’s a strong bullish engulfing pattern off the low today
Perhaps futures will give us a clue. Although they did not manage to buy futures entirely out of deep in the red last night, generally when a decline suggested by futures is arrested either over night or during trading the following day that decline resumes in the next trading session.