
Upwards movement was expected for Tuesday.
Price made a higher high and a higher low, and the daily candlestick closed green but only just.
Summary: Price should move lower for one or two days. This is supported by bearish divergence with price and RSI, inverted VIX and the AD line. The target is at 2,132. Thereafter, price should turn upwards for a few days towards the final target at 2,240.
Last monthly chart for the main wave count is here.
New updates to this analysis are in bold.
MAIN WAVE COUNT
WEEKLY CHART
Click chart to enlarge.
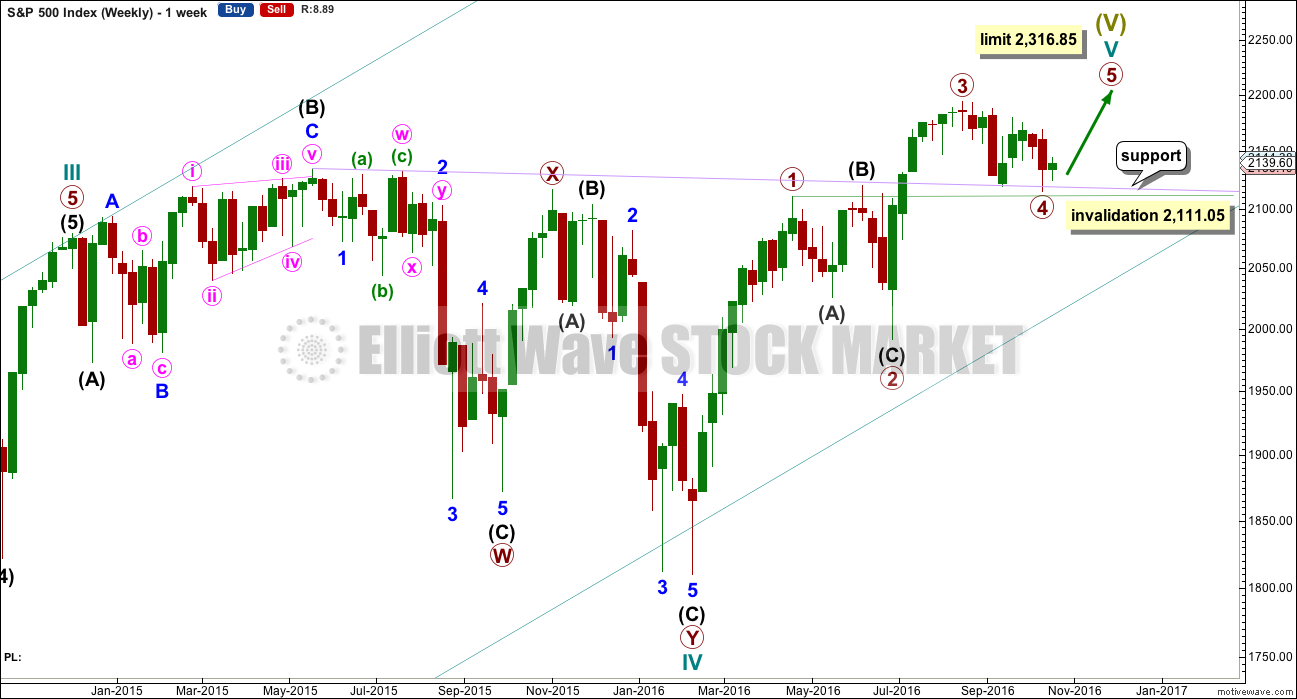
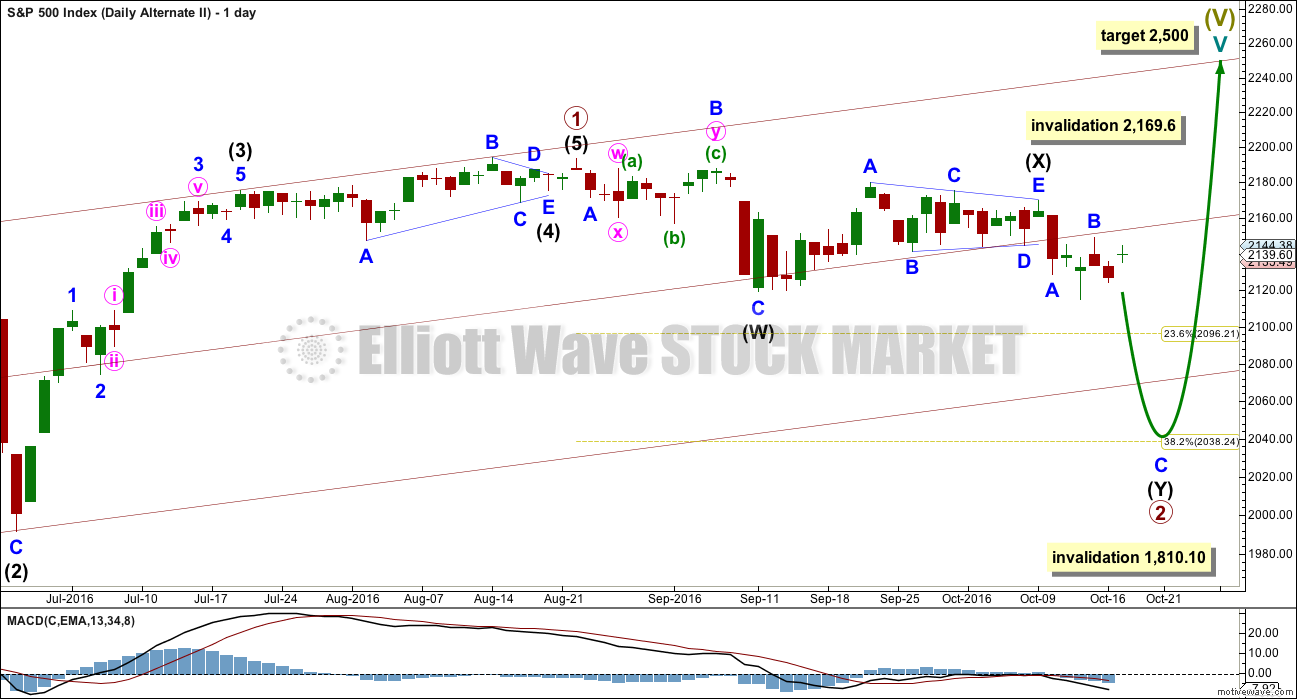
Cycle wave V must subdivide as a five wave structure. I have two wave counts for upwards movement of cycle wave V. This main wave count is presented first only because we should assume the trend remains the same until proven otherwise. Assume that downwards movement is a correction within the upwards trend, until proven it is not.
Primary wave 3 is shorter than primary wave 1, but shows stronger momentum and volume as a third wave normally does. Because primary wave 3 is shorter than primary wave 1 this will limit primary wave 5 to no longer than equality in length with primary wave 3, so that the core Elliott wave rule stating a third wave may not be the shortest is met. Primary wave 5 has a limit at 2,316.85.
Primary wave 2 was a shallow 0.40 expanded flat correction. Primary wave 4 may have ended as a shallow 0.39 double zigzag. There is no alternation in depth, but there is good alternation in structure.
Primary wave 4 may not move into primary wave 1 price territory below 2,111.05.
It is also possible to move the degree of labelling within cycle wave V all down one degree. It may be only primary wave 1 unfolding. The invalidation point for this idea is at 1,810.10. That chart will not be published at this time in order to keep the number of charts manageable. The probability that this upwards impulse is only primary wave 1 is even with the probability that it is cycle wave V in its entirety.
When the five wave structure upwards labelled primary wave 5 is complete, then my main wave count will move the labelling within cycle wave V all down one degree and expect that only primary wave 1 may be complete. The labelling as it is here will become an alternate wave count. This is because we should always assume the trend remains the same until proven otherwise. We should always assume that a counter trend movement is a correction, until price tells us it’s not.
DAILY CHART
Click chart to enlarge.
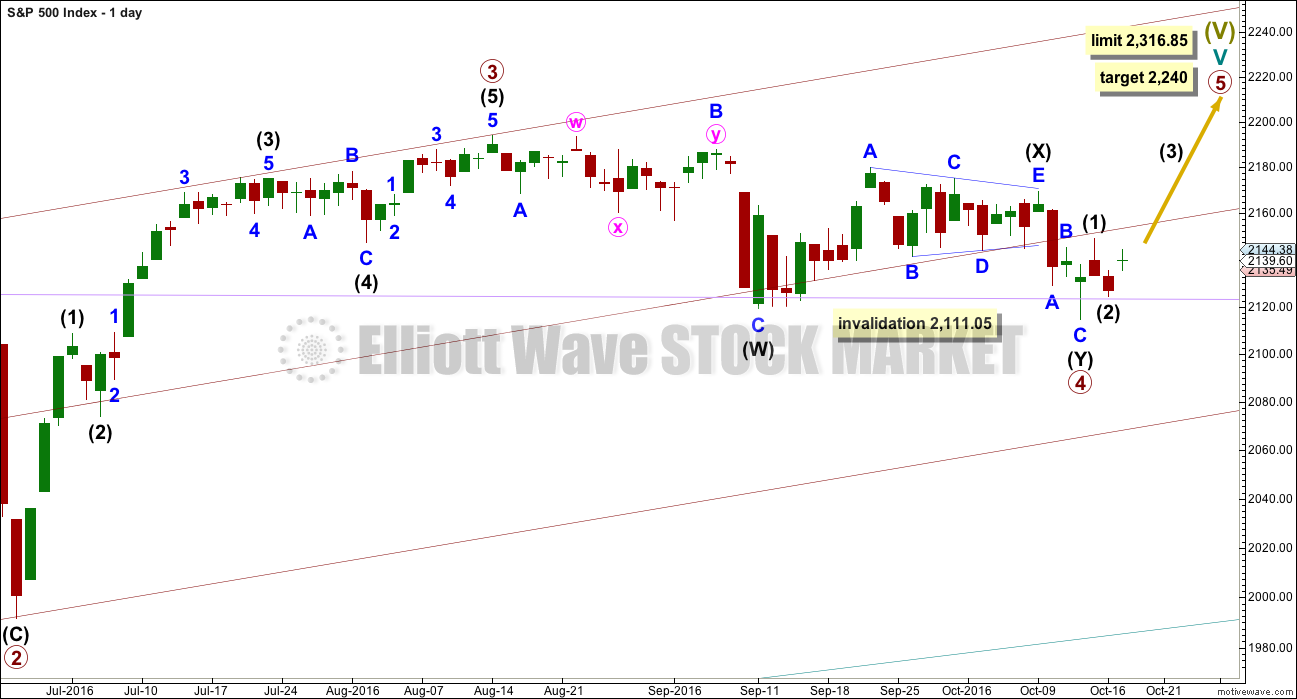
Primary wave 3 is moved to the last all time high. If it ended there, then this is where primary wave 4 has begun.
Primary wave 3 is 16.14 points longer than 0.618 the length of primary wave 1. This is a reasonable difference. But as it is less than 10% the length of primary wave 3, it is my judgement that it is close enough to say these waves exhibit a Fibonacci ratio to each other.
If this pattern continues, then about 2,240 primary wave 5 would reach 0.618 the length of primary wave 3. If this target is wrong, it may be too high. When intermediate waves (1) through to (4) are complete, then the target may be changed as it may be calculated at a second degree.
There is good proportion for this wave count. Primary wave 1 lasted 46 days, primary wave 2 lasted 47 days, primary wave 3 lasted a Fibonacci 34 days, and primary wave 4 lasted 42 days. So far primary wave 5 has lasted three days. If it exhibits a Fibonacci duration, it is likely to be more brief than primary wave 3. A Fibonacci 13 days may be reasonably likely at this stage. That would see primary wave 5 end on 1st of November. It does not look like primary wave 5 may manage to end now within October, because it is moving too slowly so far to complete in a Fibonacci 8 days on the 25th of October.
Primary wave 4 fits perfectly as a double zigzag. The second zigzag in the double should have ended with a small overshoot of the lilac trend line. This line should provide very strong support. There is almost no room left for primary wave 4 to move into.
If primary wave 4 continues any further, it may not move into primary wave 1 price territory below 2,111.05.
Primary wave 5 must be a five wave structure, so it is most likely to be a simple impulse. It may be relatively quick, and would be very likely to make at least a slight new high above the end of primary wave 3 at 2,193.81 to avoid a truncation.
Because primary wave 5 must be shorter in length than primary wave 3, each of its sub-waves should be shorter in length and duration. For this reason intermediate waves (1) and (2) are labelled as complete within primary wave 5. Intermediate wave (2) may today have ended when price came to almost again touch the lilac trend line.
HOURLY CHART
Click chart to enlarge.
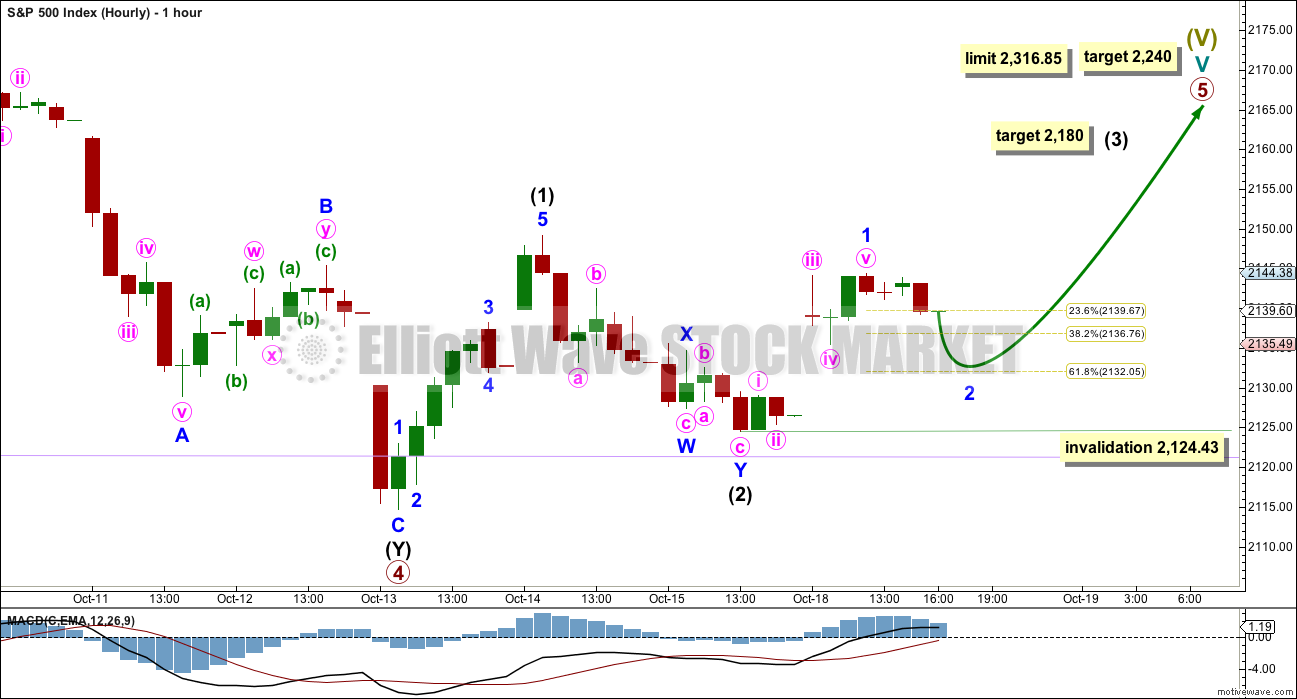
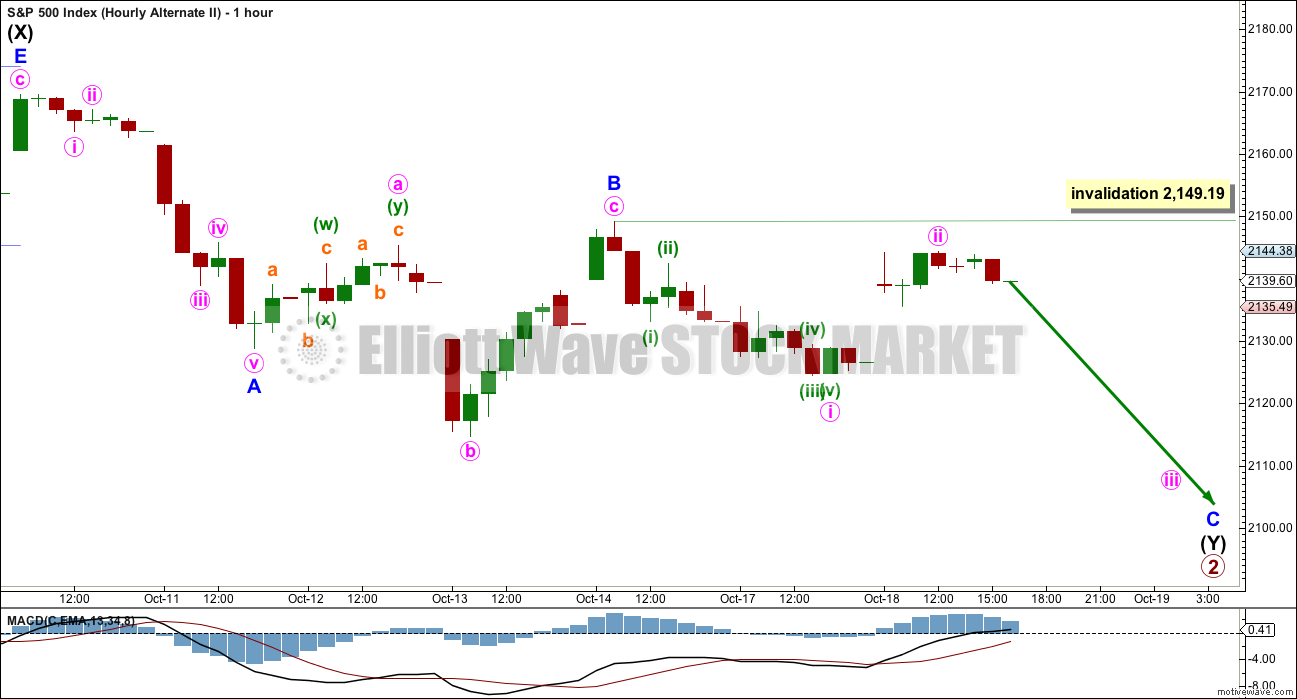
Downwards movement for intermediate wave (2) fits well as a double zigzag. This downwards wave fits better as a three than it does as a five.
Upwards movement to today’s high fits well as a five wave impulse. This may be minor wave 1 within intermediate wave (3).
Intermediate wave (3) must move beyond the end of intermediate wave (1) above 2,149.19. It must move far enough above this point to allow room for a subsequent fourth wave to unfold and remain above first wave price territory.
Intermediate wave (3) may only subdivide as an impulse. The subdivisions of minor waves 2 and 4 within it may show up at a higher time frame, on the daily chart as one or more red candlesticks or doji.
Intermediate wave (3) should show an increase in upwards momentum beyond that seen for intermediate wave (1). So far it has done that. It should also show support from volume. So far it has not done that.
At 2,180 intermediate wave (3) would reach 1.618 the length of intermediate wave (1).
Minor wave 2 may move price lower tomorrow. It may end close to the 0.618 Fibonacci ratio of minor wave 1 at 2,132. Minor wave 2 may not move beyond the start of minor wave 1 below 2,124.43.
If price moves below 2,124.43 in the next one or two days, then the invalidation point will move slightly lower to 2,114.72. It is still possible that intermediate wave (2) could be moving lower.
ALTERNATE WAVE COUNT
WEEKLY CHART
Click chart to enlarge.
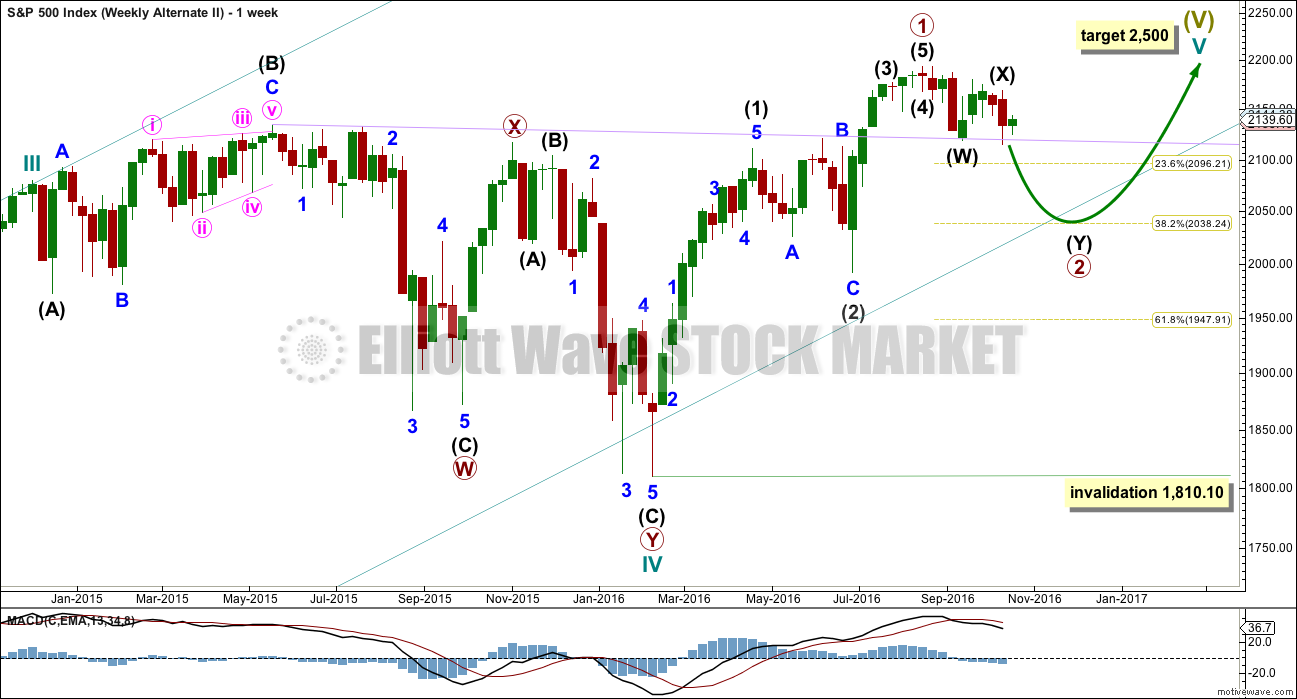
What if an impulse upwards is complete? The implications are important. If this is possible, then primary wave 1 within cycle wave V may be complete.
With downwards movement from the high of primary wave 1 now clearly a three and not a five, the possibility that cycle wave V and Super Cycle wave (V) are over has substantially reduced. This possibility would be eliminated if price can make a new all time high above 2,193.81.
If an impulse upwards is complete, then a second wave correction may be unfolding for primary wave 2. Expectations on how deep primary wave 2 is likely to be are now adjusted. It may be expected now to more likely only reach the 0.382 Fibonacci ratio about 2,038.
At this stage, it looks like price has found strong support at the lilac trend line.
Primary wave 2 may not move beyond the start of primary wave 1 below 1,810.10.
DAILY CHART
Click chart to enlarge.
If an impulse upwards is complete, then how may it subdivide and are proportions good?
Intermediate wave (1) was an impulse lasting 47 days. Intermediate wave (2) was an expanded flat lasting 47 days. Intermediate wave (3) fits as an impulse lasting 16 days, and it is 2.04 points short of 0.618 the length of intermediate wave (1). So far this alternate wave count is identical to the main wave count (with the exception of the degree of labelling, but here it may also be moved up one degree).
Intermediate wave (4) may have been a running contracting triangle lasting 22 days and very shallow at only 0.0027 the depth of intermediate wave (3). At its end it effected only a 0.5 point retracement. There is perfect alternation between the deeper expanded flat of intermediate wave (2) and the very shallow triangle of intermediate wave (4). All subdivisions fit and the proportion is good.
Intermediate wave (5) would be very brief at only 18.29 points. Intermediate wave (5) is 1.43 points longer than 0.056 the length of intermediate wave (1).
At this stage, primary wave 2 now has a completed zigzag downwards that did not reach the 0.236 Fibonacci ratio. It is very unlikely for this wave count that primary wave 2 is over there; the correction is too brief and shallow. Upwards movement labelled intermediate wave (X) is so far less than 0.9 the length of the prior wave down labelled intermediate wave (W). The minimum for a flat correction has not been met. Primary wave 2 may continue lower as a double zigzag. A second zigzag in the double may be required to deepen the correction closer to the 0.382 Fibonacci ratio.
Intermediate wave (W) lasted a Fibonacci 13 sessions. Intermediate wave (X) is a complete triangle. X waves may subdivide as any corrective structure (including multiples), and a triangle is possible here.
If minor wave B within the second zigzag of intermediate wave (Y) moves any higher, it may not move beyond the start of minor wave A above 2,169.60.
Primary wave 2 may not move beyond the start of primary wave 1 below 1,810.10. A new low below this point would see the degree of labelling within cycle wave V moved up one degree. At that stage, a trend change at Super Cycle degree would be expected and a new bear market to span several years would be confirmed.
HOURLY CHART
Click chart to enlarge.
Intermediate wave (Y) should subdivide as a zigzag to deepen the correction.
Within the zigzag of intermediate wave (Y), minor waves A and B may be complete.
Minor wave C must subdivide as a five wave structure. Within minor wave C, minute wave i will fit on the five minute chart as a five wave impulse (but this looks forced) and minute wave ii looks like a five, but it should be a three. This wave count today does not have a good fit at the hourly chart level. This reduces the probability of this wave count.
This wave count requires confirmation with a new low below 2,111.05 before it should be used.
TECHNICAL ANALYSIS
WEEKLY CHART
Click chart to enlarge. Chart courtesy of StockCharts.com.
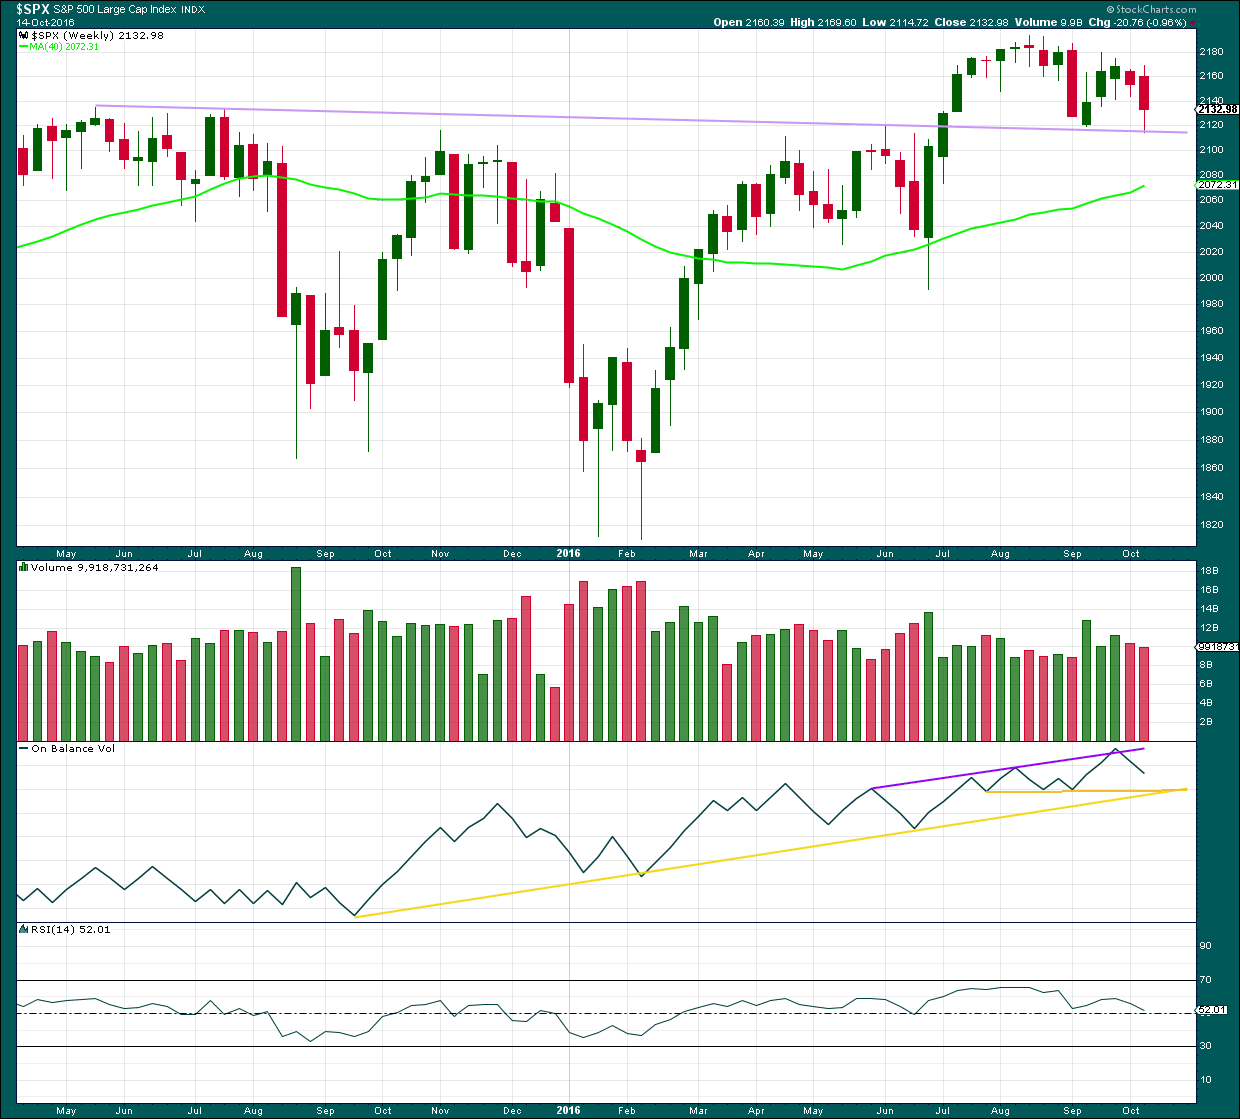
The lilac trend line has strong technical significance. Price broke through resistance, turned down to test support for the first time, and then moved up and away from this line. It was reasonable to conclude that a new all time high is a likely consequence of this typical behaviour.
Now price has come back down for a second test of the lilac trend line. This line is expected to continue to provide support because support at this line is so strong. A break below this line would be a highly significant bearish signal.
Volume for a second downwards week is slightly lighter than the prior upwards week. The fall in price has less support from volume but not by much.
Volume for the two downwards weeks is lighter than two out of three of the prior upwards weeks. Mid term, at the weekly chart level, it still looks like price has more support for upwards movement than downwards from volume.
On Balance Volume has some distance to go before it finds support at either of the yellow lines.
RSI is close to neutral. There is plenty of room for price to rise or fall. There is no mid term divergence between price and RSI to indicate weakness.
DAILY CHART
Click chart to enlarge. Chart courtesy of StockCharts.com.
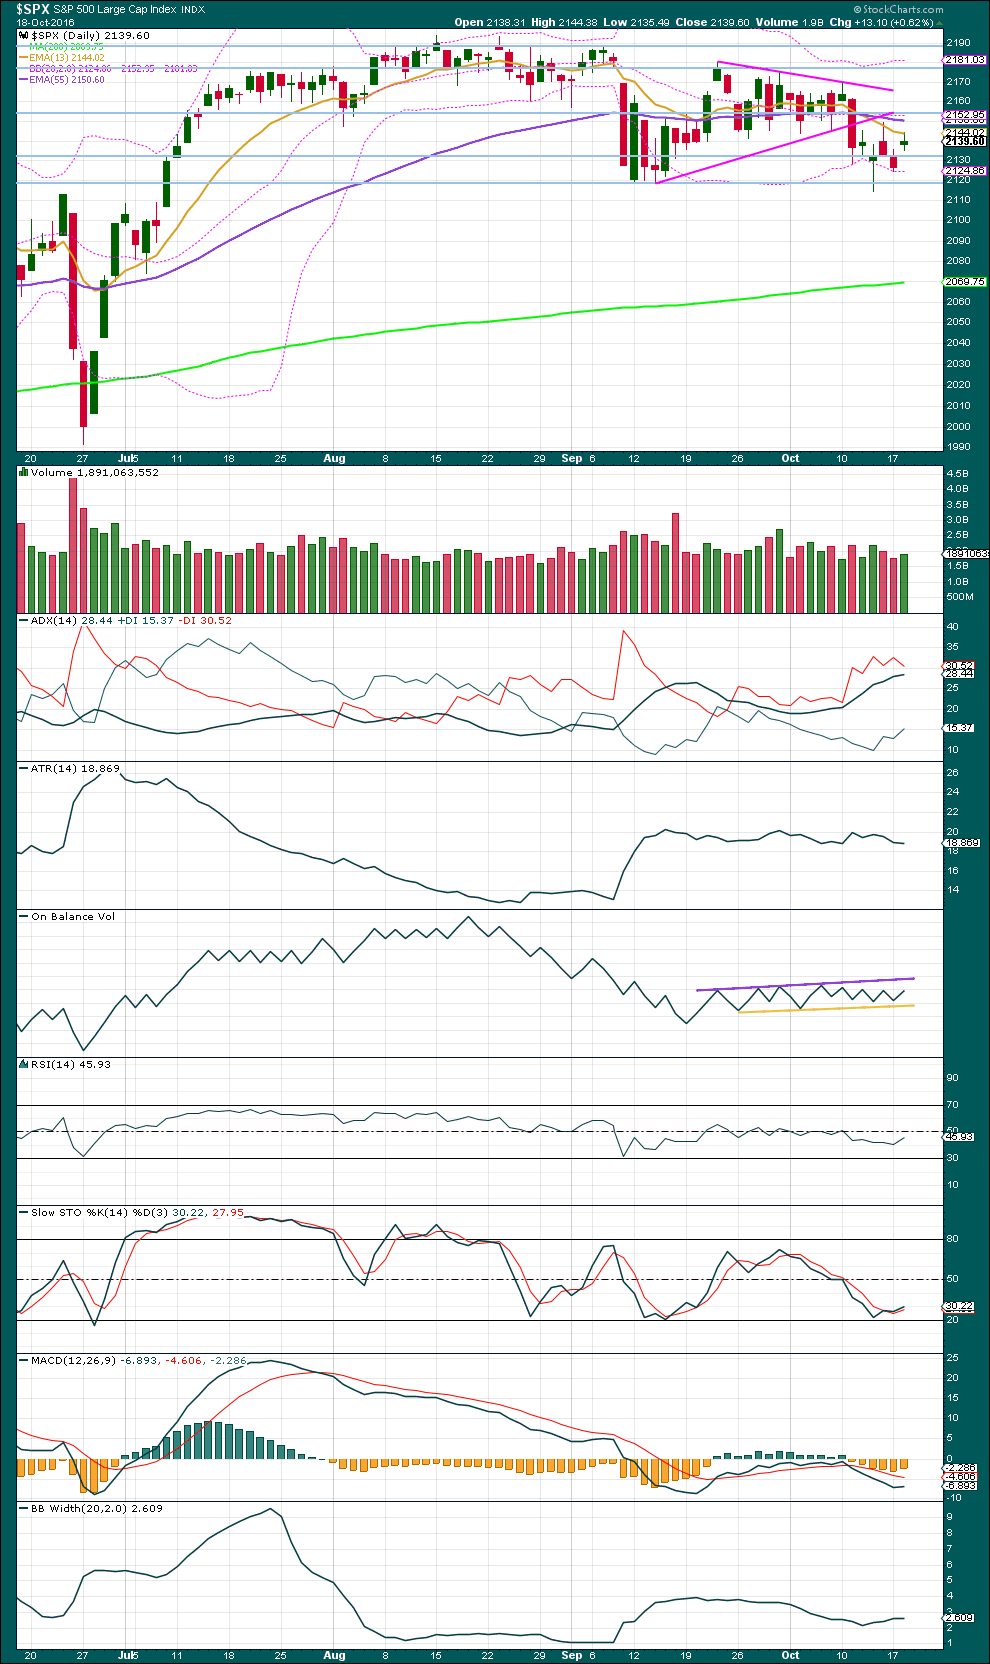
A small upwards day comes with a slight increase in volume beyond the prior downwards day, but the increase is small. Volume today is still lighter than two and three days prior.
ADX is still increasing and above 15. The -DX line is still above the +DX line. ADX indicates a downwards trend is still in place.
ATR disagrees as it is flat to declining.
Bollinger Bands are now flattening off for this session. The recent increase is small and volatility overall is still very low. Bollinger Bands do not agree that this market is trending at this time.
Overall, a downwards trend may be in place. But if so, it is not healthy and it is suspicious.
On Balance Volume remains contained within support and resistance lines and may find some support here about the yellow line. If OBV turns up from here tomorrow, then the yellow line should be adjusted to better sit across the last few lows.
RSI today exhibits new divergence with today’s high and the high three sessions ago of the 14th of October: RSI has made a higher high, but price has made a lower high. This divergence is bearish and indicates weakness in price.
Stochastics has not reached oversold, but it has not managed to reach extremes since August. It may be returning from almost oversold while price is returning from support.
MACD is no longer clearly indicating downwards momentum.
VOLATILITY – INVERTED VIX CHART
Click chart to enlarge. Chart courtesy of StockCharts.com.
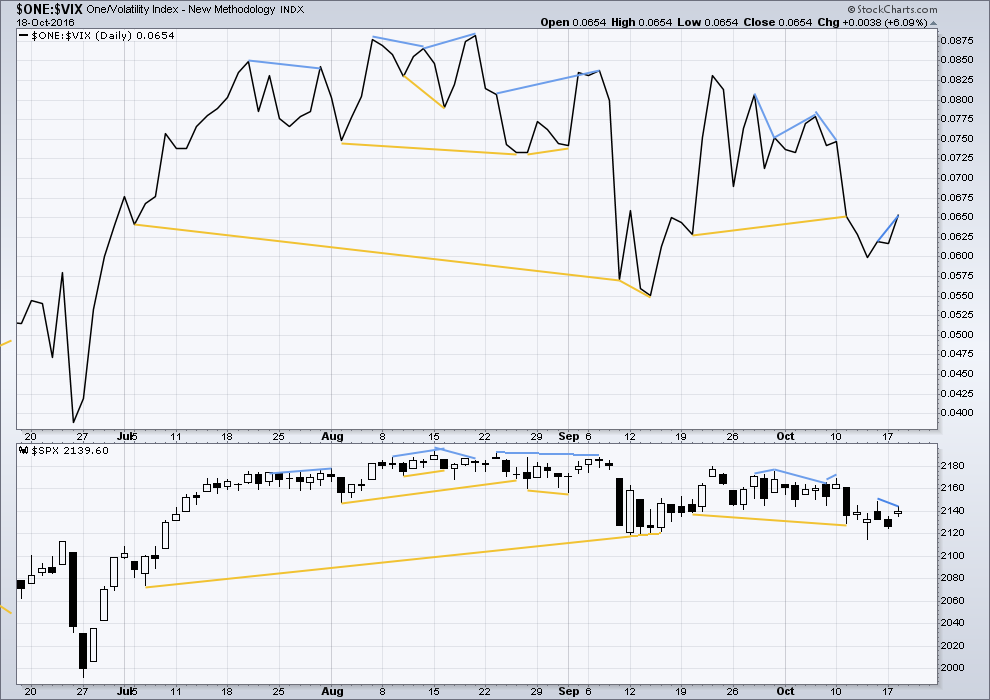
There are a few instances of multi day divergence between price and inverted VIX noted here. Bearish divergence is blue. Bullish divergence is yellow. It appears so far that divergence between inverted VIX and price is again working to indicate short term movements spanning one or two days.
There is new short term divergence today between price and inverted VIX: VIX has made a new high above the prior high three sessions ago on the 14th of October, but price has made a lower high. This divergence is bearish and indicates weakness in price. One or two days of downwards movement may be expected.
BREADTH – AD LINE
Click chart to enlarge. Chart courtesy of StockCharts.com.
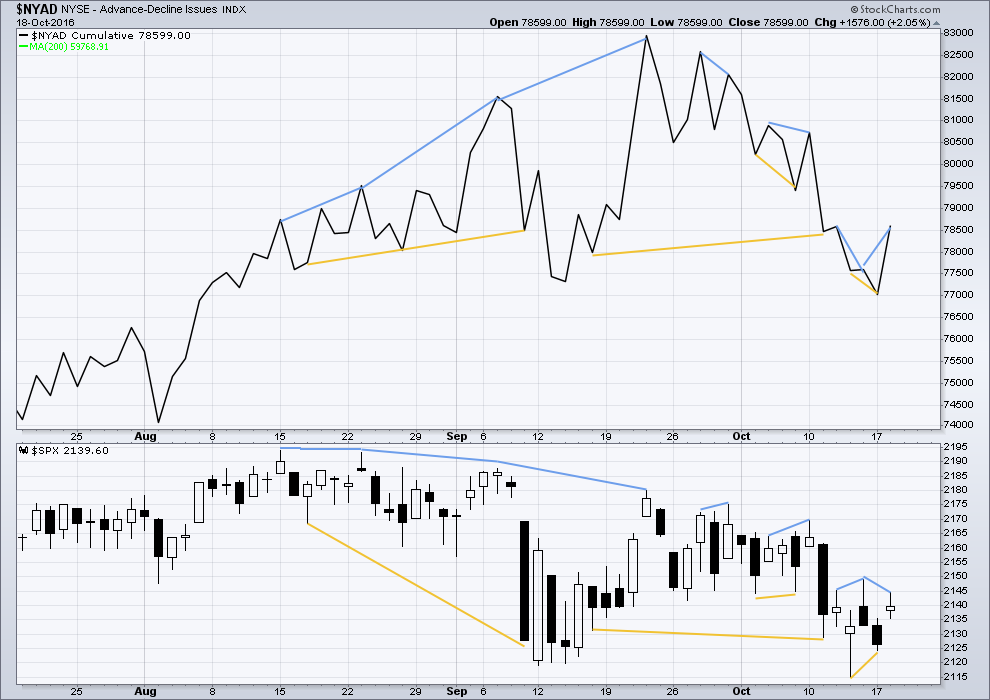
Short term bullish and bearish divergence is again working between price and the AD line to show the direction for the following one or two days.
Bullish short term divergence noted yesterday between price and the AD line has now been followed by one day of overall upwards movement. This divergence may now be resolved as new divergence is again noted.
The AD line today made a higher high above the prior high three sessions ago on the 14th of October, but price has made a lower high. This divergence is bearish and indicates weakness in price. One or two days of downwards movement may be expected.
DOW THEORY
Major lows within the old bull market:
DJIA: 15,855.12 (15th October, 2014) – closed below on 25th August, 2015.
DJT: 7,700.49 (12th October, 2014) – closed below on 24th August, 2015.
S&P500: 1,821.61 (15th October, 2014) – has not closed below this point yet.
Nasdaq: 4,117.84 (15th October, 2014) – has not closed below this point yet.
Major highs within the bear market from November 2014:
DJIA: 17,977.85 (4th November, 2015) – closed above on 18th April, 2016.
DJT: 8,358.20 (20th November, 2015) – has not closed above this point yet.
S&P500: 2,116.48 (3rd November, 2015) – closed above this point on 8th June, 2016.
Nasdaq: 5,176.77 (2nd December, 2015) – closed above this point on 1st August, 2016.
Dow Theory Conclusion: Original Dow Theory still sees price in a bear market because the transportations have failed to confirm an end to that bear market. Modified Dow Theory (adding S&P and Nasdaq) has failed still to confirm an end to the old bull market, modified Dow Theory sees price still in a bull market.
This analysis is published @ 10:39 p.m. EST.
Well that divergence didn’t work this time.
And that folks right there is the crux of the problem with technical analysis. Signals, indicators, oscillators, techniques…. they work most of the time, but not all of the time.
There are always exceptions.
Now, if there weren’t and there was something (even just ONE thing) that did work all the time we’d all be multi millionaires, easily and quickly.
I wish 🙂
Also, just in case anyone misses it, here is a link to a cheat sheet about divergence.
I know it can be confusing.
I still actually refer to this fairly regularly, just to double check I’ve got my interpretation right.
I also think it through each time.
If we are in a fifth wave forming a long term top relatively speaking, I’d expect price to be weak. At the beginning of a bull rally, I’d expect price to be strong and then stronger in the third wave. But the fifth wave should show a tired market before it turns around and heads lower. This is what might be what we are seeing in the markets.
If we clear 2149 on the SPX today which looks likely, the next resistance is at 2176 to 2180.
The SPX 4 hour MACD has achieved a bullish cross over. It looks like the daily MACD is about to do the same. Both are showing a bullish divergence relative to the low in September. Needless to say, this supports the bullish prognosticators like me.
Hmm. I thought that bullish divergence with RSI is when price makes a new low but rsi does not. ??
If that’s correct then wouldn’t bearish divergence be when price makes a new high that isn’t confirmed by rsi making a new high.
I use the bullish rsi I describe to get out of a large proportion of shorts… when this is in conjunction with other indicators .
Interesting point. It is supposed to be a leading indicator…
Craig,
I too am sometimes confused by Lara’s analysis of divergences in RSI, VIX etc. It often seems to be different than what I am interpreting. For instance, Lara says the AD Line over the last few days exhibits price weakness. But I interpret the data as bullish. The AD Line made a high above a couple of days ago but price did not make a corresponding high. I see this as an indication that price will also follow, breadth is strong. Lara sees it a price weakness. We disagree and that is okay. But I am with you in that it is sometimes confusing.
However, this is the only area of Lara’s analysis that I struggle understanding. She articulates her analysis quite well. It is clear and as concise as can be. Having the video in once a week enhances her clarity.
This may help guys.
The divergence noted above for the AD line (for example) is Hidden Bearish Divergence; the oscillator (in this case not an oscillator, the AD line, but the principle is the same) made a higher high, but price made a lower high.
This cheat sheet is so good I still refer to it just to ensure I’ve got it right.
Maybe I should put a link for it on the sidebar? Maybe I’ll do my own table and publish it as an article for our reference….
woo hoo