
In yesterday’s analysis I noticed bearish divergence between price and VIX, so members were instructed to look out for a possible surprise to the downside.
Downwards movement breached the invalidation point on the main daily wave count, but not the weekly, so the main Elliott wave count is today changed.
Summary: An upwards swing is expected from here to about 2,240 in eight days. If this target is wrong, it may be too high. Price is at support and Stochastics is close to oversold. The long lower wick on today’s green doji is bullish.
Last monthly chart for the main wave count is here.
New updates to this analysis are in bold.
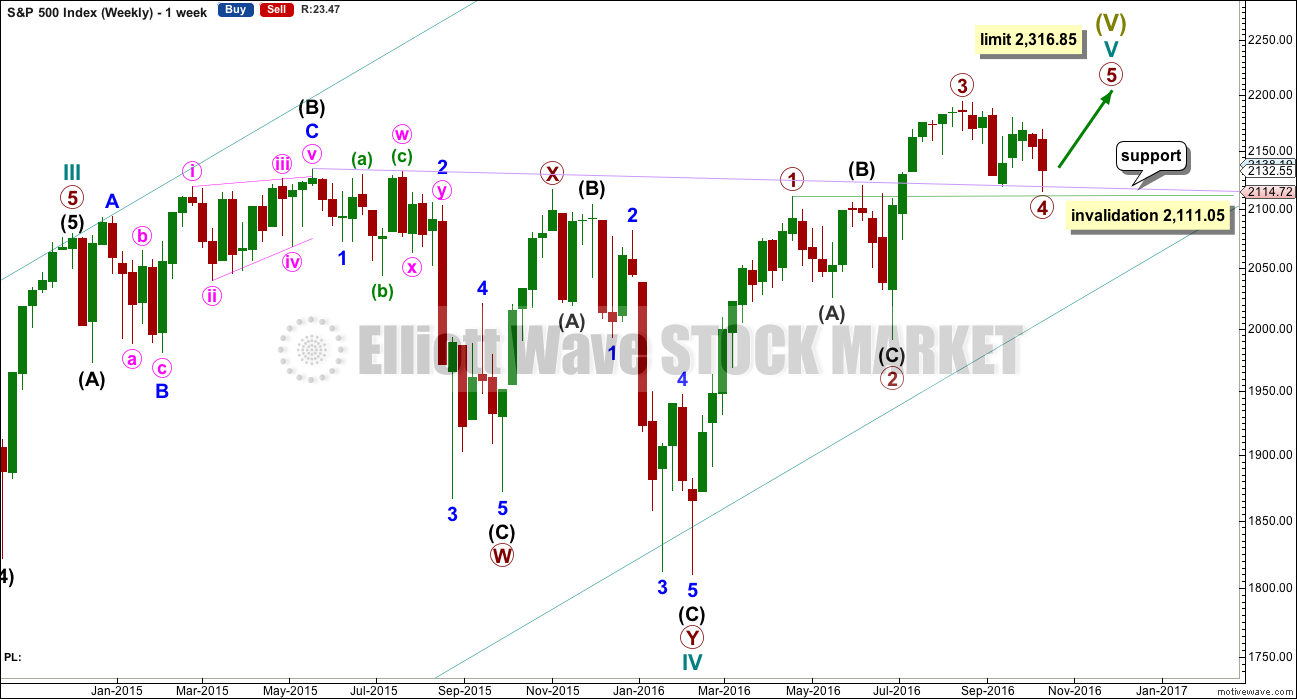
MAIN WAVE COUNT
WEEKLY CHART
Click chart to enlarge.
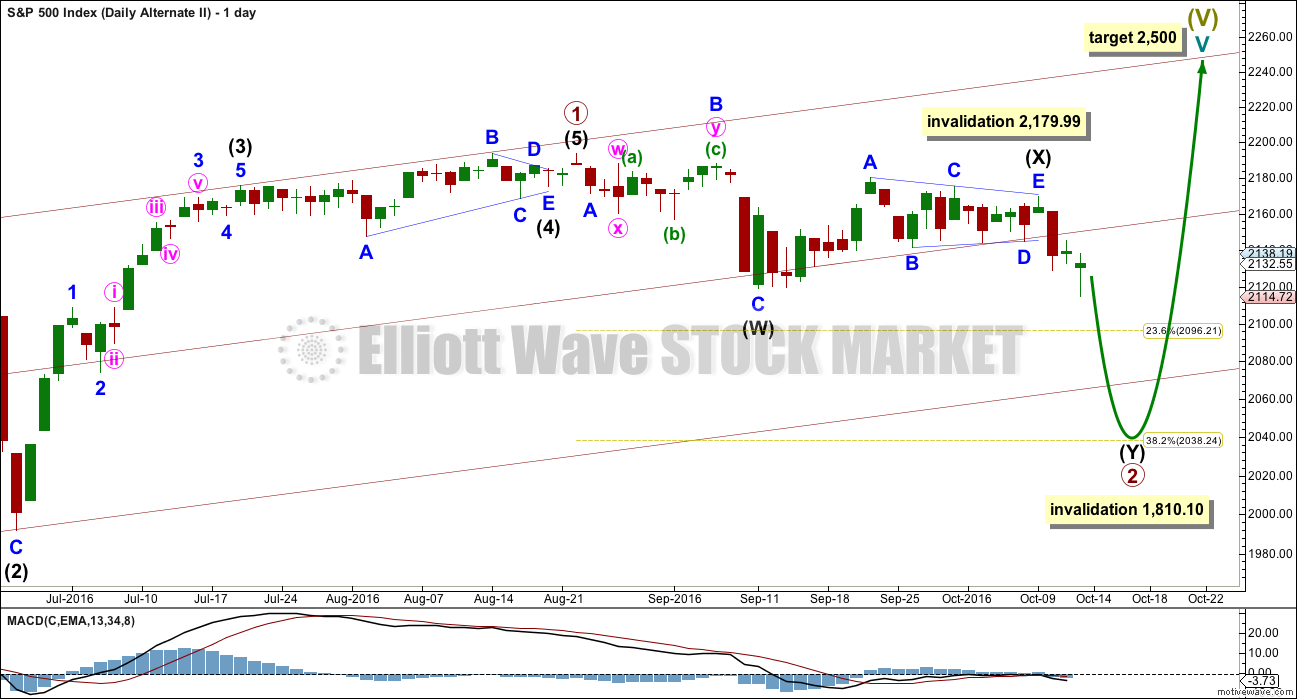
Cycle wave V must subdivide as a five wave structure. I have two wave counts for upwards movement of cycle wave V. This main wave count is presented first only because we should assume the trend remains the same until proven otherwise. Assume that downwards movement is a correction within the upwards trend, until proven it is not.
Primary wave 3 is shorter than primary wave 1, but shows stronger momentum and volume as a third wave normally does. Because primary wave 3 is shorter than primary wave 1 this will limit primary wave 5 to no longer than equality in length with primary wave 3, so that the core Elliott wave rule stating a third wave may not be the shortest is met. Primary wave 5 has a limit at 2,316.85.
Primary wave 2 was a shallow 0.40 expanded flat correction. Primary wave 4 may have ended today as a shallow 0.39 double zigzag. There is no alternation in depth, but there is good alternation in structure.
Primary wave 4 may not move into primary wave 1 price territory below 2,111.05.
It is also possible to move the degree of labelling within cycle wave V all down one degree. It may be only primary wave 1 unfolding. The invalidation point for this idea is at 1,810.10. That chart will not be published at this time in order to keep the number of charts manageable. The probability that this upwards impulse is only primary wave 1 is even with the probability that it is cycle wave V in its entirety.
When the five wave structure upwards labelled primary wave 5 is complete, then my main wave count will move the labelling within cycle wave V all down one degree and expect that only primary wave 1 may be complete. The labelling as it is here will become an alternate wave count. This is because we should always assume the trend remains the same until proven otherwise. We should always assume that a counter trend movement is a correction, until price tells us it’s not.
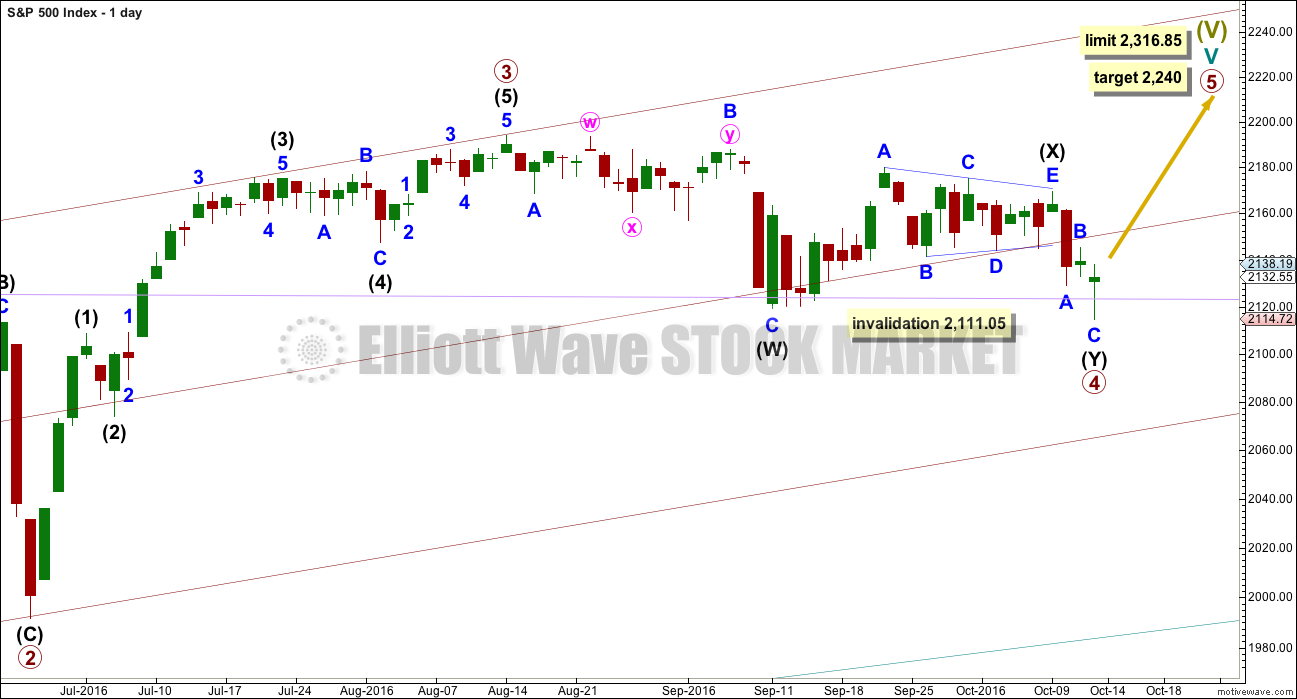
DAILY CHART
Click chart to enlarge.
Primary wave 3 is moved to the last all time high. If it ended there, then this is where primary wave 4 has begun.
Primary wave 3 is 16.14 points longer than 0.618 the length of primary wave 1. This is a reasonable difference. But as it is less than 10% the length of primary wave 3, it is my judgement that it is close enough to say these waves exhibit a Fibonacci ratio to each other.
If this pattern continues, then about 2,240 primary wave 5 would reach 0.618 the length of primary wave 3. If this target is wrong, it may be too high. When intermediate waves (1) through to (4) are complete, then the target may be changed as it may be calculated at a second degree.
There is good proportion for this wave count. Primary wave 1 lasted 46 days, primary wave 2 lasted 47 days, primary wave 3 lasted a Fibonacci 34 days, and primary wave 4 lasted 42 days so far.
Primary wave 4 fits perfectly as a double zigzag. The second zigzag in the double should have ended today, with a small overshoot of the lilac trend line. This line should provide very strong support. There is almost no room left for primary wave 4 to move into.
If primary wave 4 continues any further, it may not move into primary wave 1 price territory below 2,111.05.
Primary wave 5 must be a five wave structure, so it is most likely to be a simple impulse. It may be relatively quick, and would be very likely to make at least a slight new high above the end of primary wave 3 at 2,193.81 to avoid a truncation.
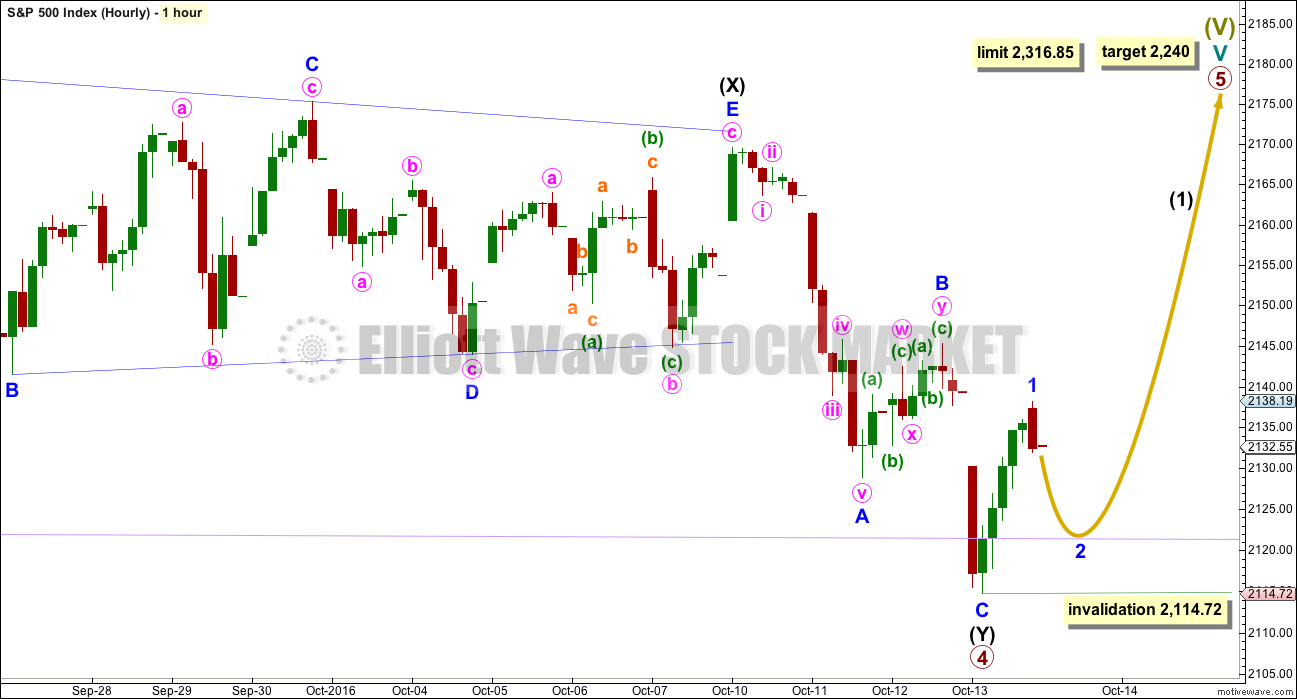
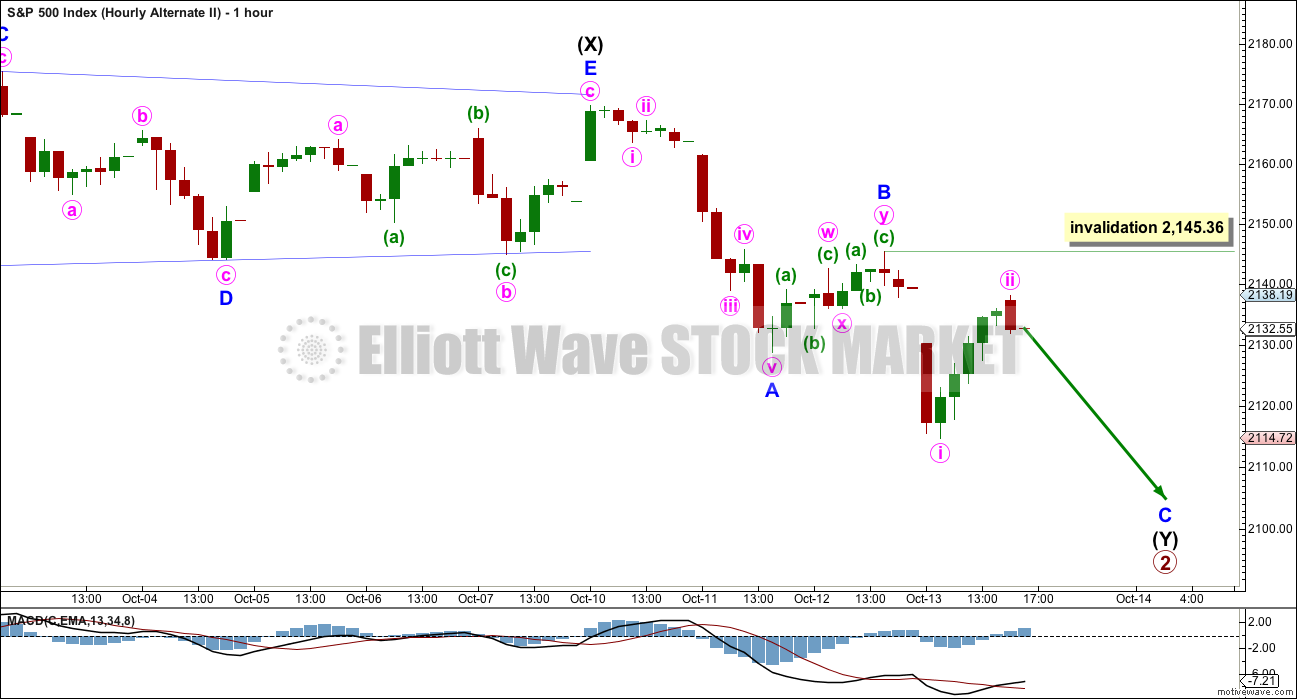
HOURLY CHART
Click chart to enlarge.
If primary wave 4 has ended today with a slight overshoot of the lilac trend line, then price should move upwards tomorrow.
Minor wave 1 may be complete. Minor wave 2 may not move beyond the start of minor wave 1 below 2,114.72.
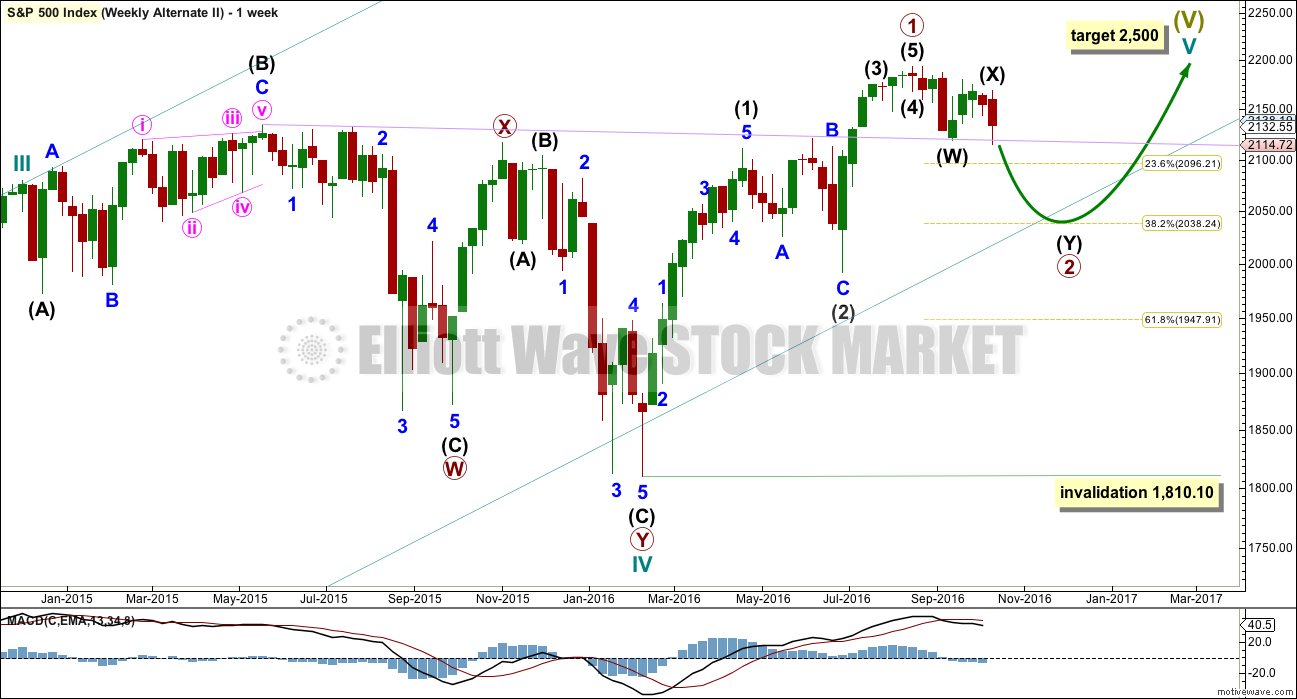
ALTERNATE WAVE COUNT
WEEKLY CHART
Click chart to enlarge.
What if an impulse upwards is complete? The implications are important. If this is possible, then primary wave 1 within cycle wave V may be complete.
With downwards movement from the high of primary wave 1 now clearly a three and not a five, the possibility that cycle wave V and Super Cycle wave (V) are over has substantially reduced. This possibility would be eliminated if price can make a new all time high above 2,193.81.
If an impulse upwards is complete, then a second wave correction may be unfolding for primary wave 2. Expectations on how deep primary wave 2 is likely to be are now adjusted. It may be expected now to more likely only reach the 0.382 Fibonacci ratio about 2,038.
At this stage, it looks like price has found strong support at the lilac trend line.
Primary wave 2 may not move beyond the start of primary wave 1 below 1,810.10.
DAILY CHART
Click chart to enlarge.
If an impulse upwards is complete, then how may it subdivide and are proportions good?
Intermediate wave (1) was an impulse lasting 47 days. Intermediate wave (2) was an expanded flat lasting 47 days. Intermediate wave (3) fits as an impulse lasting 16 days, and it is 2.04 points short of 0.618 the length of intermediate wave (1). So far this alternate wave count is identical to the main wave count (with the exception of the degree of labelling, but here it may also be moved up one degree).
Intermediate wave (4) may have been a running contracting triangle lasting 22 days and very shallow at only 0.0027 the depth of intermediate wave (3). At its end it effected only a 0.5 point retracement. There is perfect alternation between the deeper expanded flat of intermediate wave (2) and the very shallow triangle of intermediate wave (4). All subdivisions fit and the proportion is good.
Intermediate wave (5) would be very brief at only 18.29 points. Intermediate wave (5) is 1.43 points longer than 0.056 the length of intermediate wave (1).
At this stage, primary wave 2 now has a completed zigzag downwards that did not reach the 0.236 Fibonacci ratio. It is very unlikely for this wave count that primary wave 2 is over there; the correction is too brief and shallow. Upwards movement labelled intermediate wave (X) is so far less than 0.9 the length of the prior wave down labelled intermediate wave (W). The minimum for a flat correction has not been met. Primary wave 2 may continue lower as a double zigzag. A second zigzag in the double may be required to deepen the correction closer to the 0.382 Fibonacci ratio.
Intermediate wave (W) lasted a Fibonacci 13 sessions. Intermediate wave (X) is now changed today to see a triangle unfolding sideways. X waves may subdivide as any corrective structure (including multiples), and a triangle is possible here.
If minor wave C within the triangle for intermediate wave (X) moves any higher, then it may not move beyond the end of minor wave A above 2,179.99. It is possible today that the triangle for intermediate wave (X) is over and the breakout downwards may come quickly.
Primary wave 2 may not move beyond the start of primary wave 1 below 1,810.10. A new low below this point would see the degree of labelling within cycle wave V moved up one degree. At that stage, a trend change at Super Cycle degree would be expected and a new bear market to span several years would be confirmed.
HOURLY CHART
Click chart to enlarge.
Intermediate wave (X) will fit as a regular contracting triangle. Intermediate wave (Y) should subdivide as a zigzag to deepen the correction. Within intermediate wave (Y), the correction for minor wave B may not move beyond the start of minor wave A above 2,169.60.
While it is possible that intermediate wave (Y) is a complete zigzag, it is also possible that it may continue lower to deepen the correction for primary wave 2.
Within the zigzag of intermediate wave (Y), minor waves A and B may be complete. Within minor wave C, the correction for minute wave ii may not move beyond the start of minute wave i above 2,145.36.
TECHNICAL ANALYSIS
WEEKLY CHART
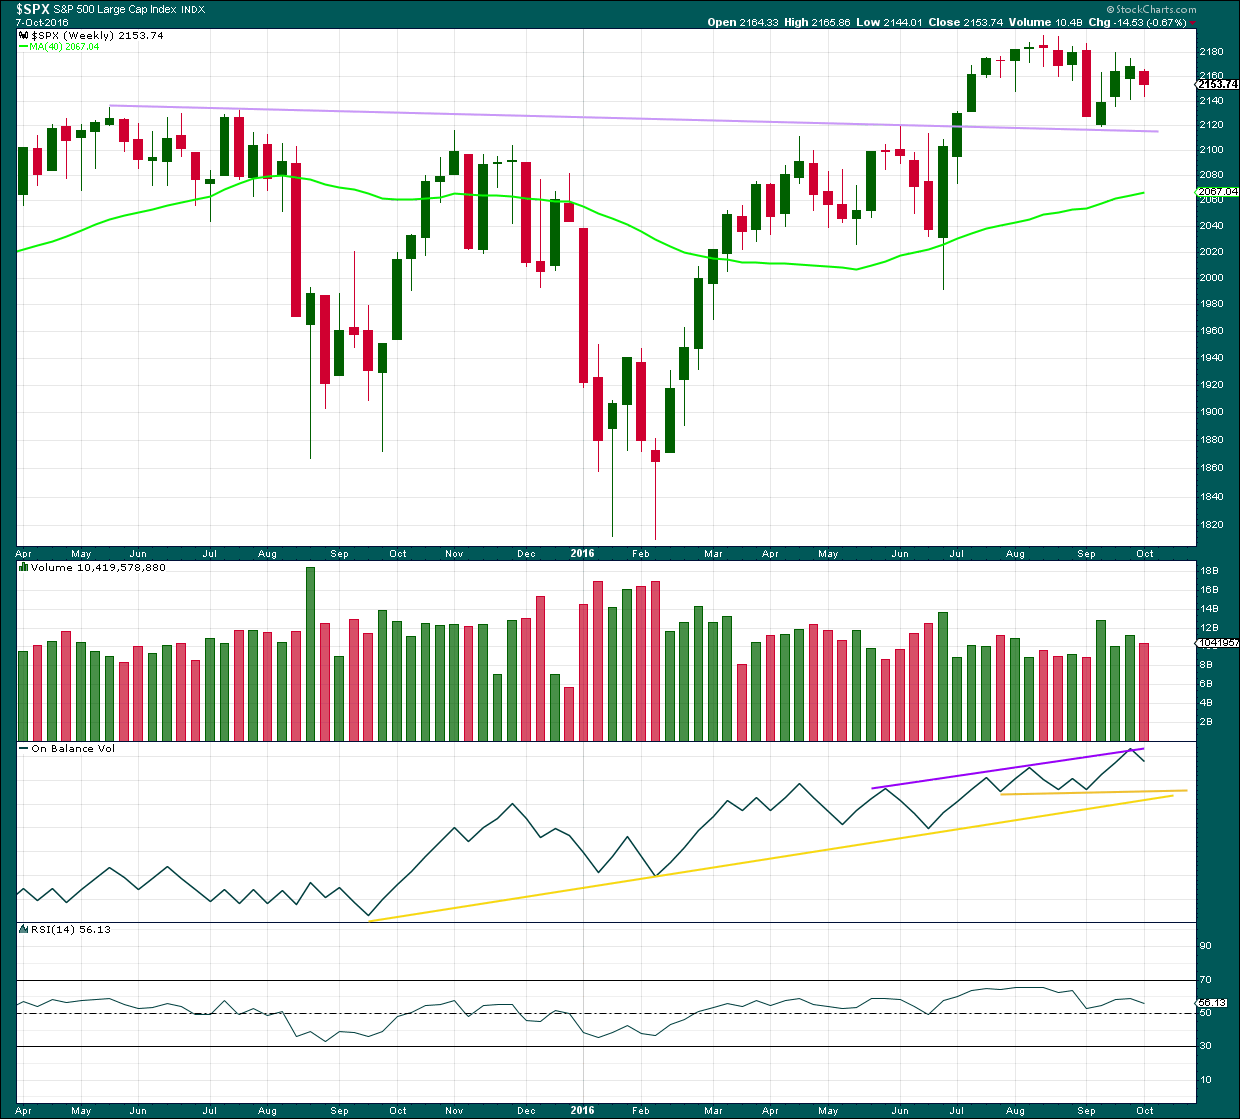
Click chart to enlarge. Chart courtesy of StockCharts.com.
The lilac trend line has strong technical significance. Price has broken through resistance, turned down to test support, and is now moving up and away from this line. It is reasonable to conclude that a new all time high is a likely consequence of this typical behaviour.
The week before last closed green and has some support from volume. A further rise in price overall would be expected to follow. Last week is an inside week and closes red on lighter volume. The decline in price was not as well supported as the prior rise in price. This supports a bullish outlook for the mid term at least.
On Balance Volume the week before last came up to touch the purple trend line. It has found resistance and moved down from there. A break above the purple line would be a reasonably strong bullish signal. If OBV moves lower, it should find support at the yellow lines.
RSI is not extreme and exhibits no divergence at the weekly chart level to indicate weakness in price. There is room for price to rise further.
DAILY CHART
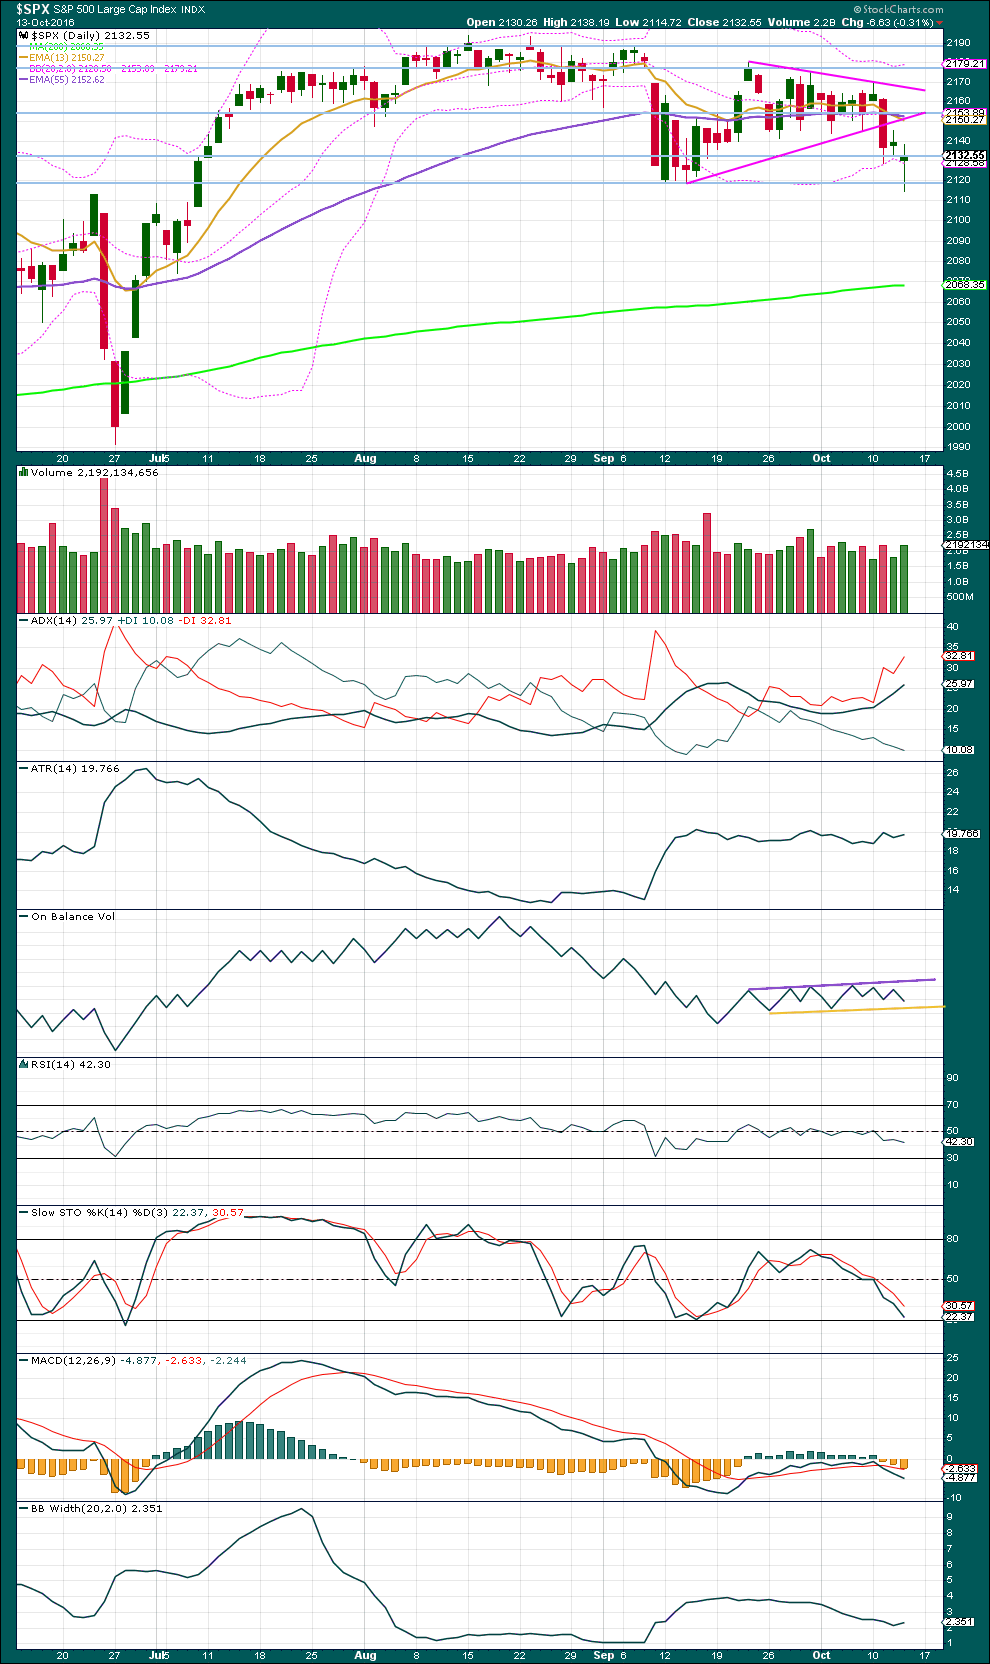
Click chart to enlarge. Chart courtesy of StockCharts.com.
The long lower wick on this Doji candlestick today is bullish. A slight increase in volume for today’s overall upwards session is also slightly bullish.
ADX is still increasing, indicating price is trending downwards. However, ATR is still overall flat and Bollinger Bands are still overall contracting. A downwards trend is not clear and this may more likely be a counter trend movement.
On Balance Volume remains constrained within its two trend lines. It may break out before price does. If so, it would provide a strong signal for the next direction for price.
RSI is still reasonably close to neutral. There is plenty of room for price to rise or fall.
Stochastics is almost oversold and price is at support. If recent behaviour continues, then an upwards swing should start about here.
VOLATILITY – INVERTED VIX CHART
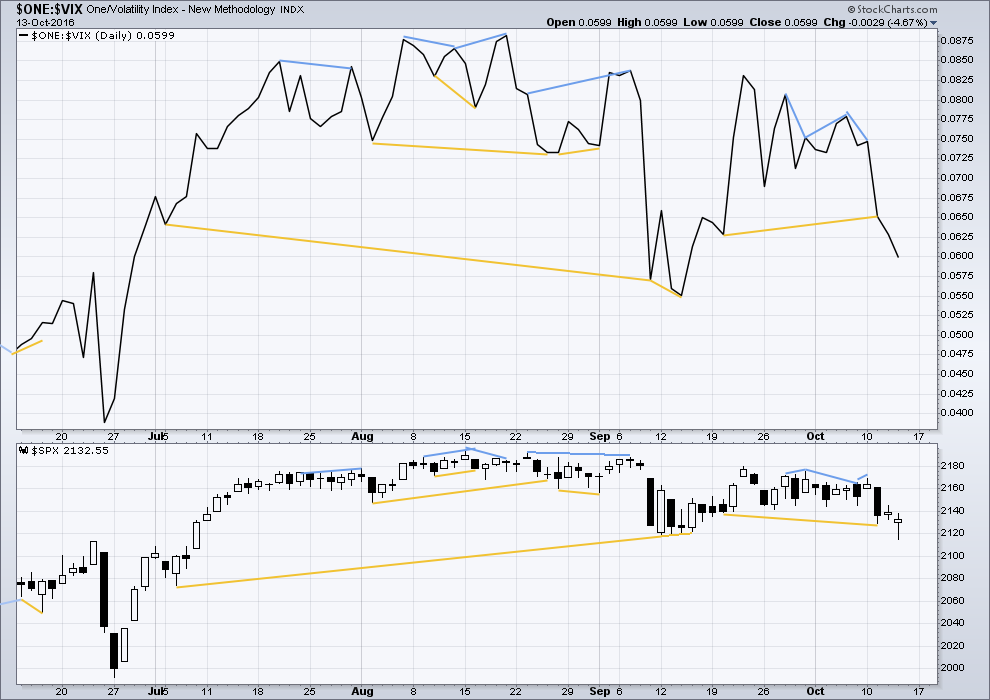
Click chart to enlarge. Chart courtesy of StockCharts.com.
There are a few instances of multi day divergence between price and inverted VIX noted here. Bearish divergence is blue. Bullish divergence is yellow. It appears so far that divergence between inverted VIX and price is again working to indicate short term movements spanning one or two days.
Price today had a lower low and a lower high. Although the session closed green, overall it was downwards. Inverted VIX has moved lower today, so no divergence is noted today between price and inverted VIX.
BREADTH – AD LINE
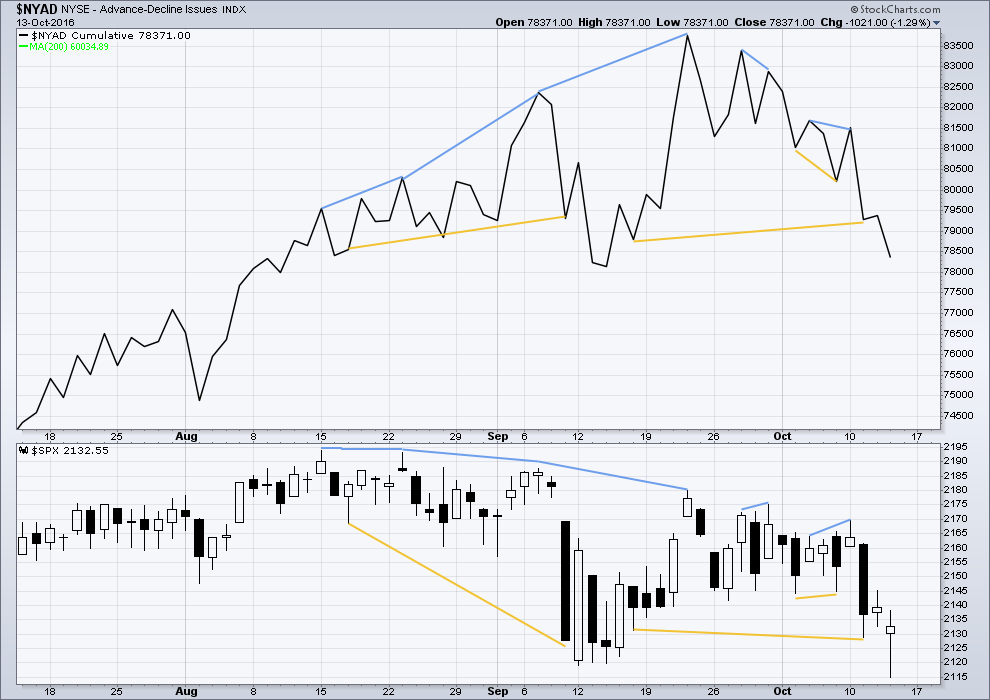
Click chart to enlarge. Chart courtesy of StockCharts.com.
There is support from market breadth as price is rising.
Short term bullish and bearish divergence is again working between price and the AD line to show the direction for the following one or two days.
There is no new divergence noted today between price and the AD line. Price moved overall lower as it made a lower low and a lower high beyond the prior session. The AD line also moved lower.
DOW THEORY
Major lows within the old bull market:
DJIA: 15,855.12 (15th October, 2014) – closed below on 25th August, 2015.
DJT: 7,700.49 (12th October, 2014) – closed below on 24th August, 2015.
S&P500: 1,821.61 (15th October, 2014) – has not closed below this point yet.
Nasdaq: 4,117.84 (15th October, 2014) – has not closed below this point yet.
Major highs within the bear market from November 2014:
DJIA: 17,977.85 (4th November, 2015) – closed above on 18th April, 2016.
DJT: 8,358.20 (20th November, 2015) – has not closed above this point yet.
S&P500: 2,116.48 (3rd November, 2015) – closed above this point on 8th June, 2016.
Nasdaq: 5,176.77 (2nd December, 2015) – closed above this point on 1st August, 2016.
Dow Theory Conclusion: Original Dow Theory still sees price in a bear market because the transportations have failed to confirm an end to that bear market. Modified Dow Theory (adding S&P and Nasdaq) has failed still to confirm an end to the old bull market, modified Dow Theory sees price still in a bull market.
This analysis is published @ 10:00 p.m. EST.
Well it does look as if they will end the day with a moral victory of sorts since even though they could not hold the highs of the day, they also prevented the bears from closing that gap from this morning. We will have to wait until next week to see the resolution of the current wrestling match it appears.
Have a great and restful week-end all! Cheerio!
It is really quite remarkable how all this thrashing around by the “B” boys is taking place with little or no selling pressure from the bears. Volume continues to be tepid for the session…interesting!
Well you certainly have to give the banksters a “D” for determination…! 🙂
We are almost there. Rubber meets the road.
Does anybody else dig Steely Dan?
Enjoying the whimsical strains of “Deacon Blues”….as I wait for Mr. Market to make up my mind (as Radar from M.A.S.H. would say)
I assume you’re still not sold on all time highs are coming?
Oh I do think they are coming for one or two indices, but perhaps not quite just yet… 🙂
?
Looking at VIX, I am expecting to see at least one more blow off top before the run for the final high. There just still seems to me to be too much ebullience in the markets right now…
best guitar solo by Larry Carlton on Kid Charlemain, Steely Dan wore out my eight track in my 1972 Blue Vega
I absolutely love Steely Dan. For a long time they were my favourite band. I like the accuracy and tight sound. I like the slight jazz sound.
I’ve seen them live once in Auckland. They were fabulous 🙂
https://www.youtube.com/watch?v=FCHDI9syvAw
Sold to open, IWM Nov 18 expiration 125/130 bearish call credit spread for 0.80 per contract.
For the alternate, minor B could have continued as an expanded flat, now minor C down required.
The invalidation point for this one now moves up to 2,169.60.
If that invalidation point on this hourly chart is breached I may decide to discard this alternate entirely. I don’t think it has a very good look any more anyway.
Main wave count, hourly chart updated. I’m leaving the invalidation point for the short term where it is. I’m with Rodney’s conclusion. Minor 1 ended at today’s high and minor 2 down is unfolding.
I think minor 2 is probably not complete. Maybe it will end close to the 0.618 Fibonacci ratio at 2,128.
Good morning every body. Yes, it is quiet in here lately.
If this stupid market ever figures out it’s run off the edge of the cliff already and there’s no strength beneath, then this forum will come alive.
TA is unpopular towards the end of bull markets. It becomes more popular in bear markets.
https://www.youtube.com/watch?v=Gq_bjaI0NTo
Your analysis is always popular with me…bull or bear! 🙂
I look at things very simple
Fed kept rates too low for too long while the FED &politicians ignored risks then rates increased at bubble levels popping sub prime borrowers
Fed has kept rates entirely too long in a seven year expansionary phase while the FED & politicians have ignored the risks. Now they are thinking of raising at the end of a cycle at full employment with declining productivity and negative corporate earnings
should we really have to guess how competent the FED is or what is going to happen eventually? This is 2 plus 2 math.
SPX 2132.55
Ricky don’t loose that number!
https://www.youtube.com/watch?v=EQjNHzaxfQc
Rage, rage…against the dying of the light…. 🙂
Ladies and gentlemen, we have the infamous Captain Quint on deck with his equally famous rendition of:
🙂
LOL
I had to look that one up Verne 🙂
Market volume today anemic for a possible third wave to the upside…
Look for Frau Yellen to try and jawbone the market to the upside…
It looks to me like the bears have every intention of filling that gap. If you are long the market and that happens, then it’s time to hedge your positions (if you have not done so already that is…)
Bernanke did change everything. The market is very difficult to trade now a days. I have only been here a week, and already like the info you put out. I normally don’t follow other traders trades, but I will definitely be watching the ones you post to see if I can learn from them and why you took it. I’m guessing you’re very valuable to this site.
You are most kind. Most traders keep their playbooks very close to the vest.
I have benefited from the generosity of a few traders myself and a great admirer of Lara so very happy to share what little I know with her members!
No problem and thank you. Hoping 1 day I can do this full time.
He is David. I think Verne is my most valuable member. And I look after him.
That’s what I thought. Thanks Lara, glad I found your site.
She certainly does! 🙂
If the bulls know what’s good for ’em, they had better keep that gap from this morning open cuz’ if they don’t, you-know-who is going to be having beef steaks for lunch (and dinner too!) 🙂
Well folks….need I say more? 🙂
This is the problem with highly distorted and manipulated markets- things are not always what they seem…
Boy the forum sure has been quiet of late!
Isn’t anyone else having fun with Mr. Market? 🙂
Watching that retrace back on the 4hr on spy for a position.
I just finished my second cup of coffee after a late night board meeting last evening. Then I went out dancing with Fankie Valli and the Four Seasons! So you are going to have to cut me some slack here.
I figure the first five wave impulse up completed this morning at 2148. We are now in a second wave that can take us all the way back to the start of wave 1, or 2115. A 61.8% retrace puts us at roughly 2128. That may prove to be a good entry point for long positions with only 15 SPX points or so of risk to the downside.
Exactly
Mind the gap people…! There is some serious growling going on ’round heah! 🙂
VIX futures issuing a cautionary note imo. UVXY filled its open gap from yesterday but just barely. You would normally see a much more robust retreat ahead of a serious move to the upside. I think it would be wise to remain very nimble with long side trades…
I actually considered a bearish call spread against UVXY but when I saw how that beast was trading…as poppy Bush said….”Not gonna do it!”
(He is some kinda Republican coming out for madam Hillary! ) 🙂
Top O’ the morning all. It does look as if that long lower wick and/or hammer continues to be an excellent reversal trigger. Too bad the overbought conditions and failure to close the gap yesterday spooked me out of my long positions. Oh well, win some, loose some and yesterday was a very good trading day so I cannot complain. Let’s see if this apparent kick-off of a third wave up sticks. The banksters have spend a humongous amount of capital defending the pivots. They must absolutely avoid a fade of this strong move up today or you can stick a fork in ’em. Closed out my short put of the straddle for a nice profit, long put will expire worthless, unless we get a gigantic fade…. 🙂
Hey V, do you like spreads (debit and credit) with Elliot Wave? I know I’ve had success selling spreads toward the end of wave 4’s. If you can’t elaborate, I understand, just like picking brains of successful traders of Elliott Wave.
I do. They are among the safest instruments you can trade because of the built in risk limits. They also make it harder for banksters to target your position with counter-trend ambushes. The thing I like the most about them is that you can quickly pivot on a trade if you are proven wrong and remain in the game by closing out the loosing leg.
Thankfully, the banksters have been leaving me be lately I am not sure why. They last came after me on a CBI bearish call credit spread and I stared ’em down…yeah baby!! 🙂
Great, thank you for the feedback. Good luck to you. You must trade massive amounts of contracts.
Thousands! 🙂
Wow, nice.
Hey David, you are the very first person to make a comment about contract sizes and I am curious as to what made you say that. I don’t generally talk about my position sizes.
For banksters to be watching you, I just figured you traded huge, that’s all. I’m on here to learn and try to keep up to where we are on Elliott Wave and maybe pick up another strategy.
Most retail traders and investors are at a serious disadvantage against the market makers and banksters. The sad thing is that so many traders are not even aware of the fact that they are frequently targeted. Every trader should spend some time trading with a posse of other traders, especially if you are trading a small or medium sized account. This is definitely one case in which the old adage about safety in numbers apply. I learned some incredibly valuable lessons when I was trading with Bryan Bottarelli’s group. It was really hilarious to watch the market makers go scrambling to buy the shares when the market got hit with a couple thousand in-the-money call options. Of course when they had to go out and buy the shares in case we took delivery the option contracts would go through the roof….!*sigh* Man those days were fun…and then the Bernanke Put came along and changed everything!! 🙂
I suspect Verne that the amount of money one is trading is a very sensitive topic. We’re all guessing, but everyone’s too polite to ask. I’ve figured out it must be massive 🙂
🙂
Elliott Wavers are always having to adjust and it’s tough. Like Verne said a few days back, find the bread and butter trades and attack. I appreciate Lara’s analysis everyday as she seems to be pretty spot on, but not perfect, who is (only signed up for 1 week trial), but I will become a regular member today. Alot of great input on here also.
hellooo again
Wassup Doc? 🙂 🙂 🙂