
A red daily candlestick was expected for Friday, which is what happened.
The short term triangle on the Elliott wave count remains valid.
Summary: In the short term, Monday may print a green daily candlestick, or possibly a doji. Overall sideways movement Monday may complete a triangle, which should break out downwards for a short sharp thrust to end in a range from 2,140 to 2,131 on Tuesday. Thereafter, price should turn up to make a new high above 2,179.58.
Last monthly chart for the main wave count is here.
New updates to this analysis are in bold.
MAIN WAVE COUNT
WEEKLY CHART
Click chart to enlarge.
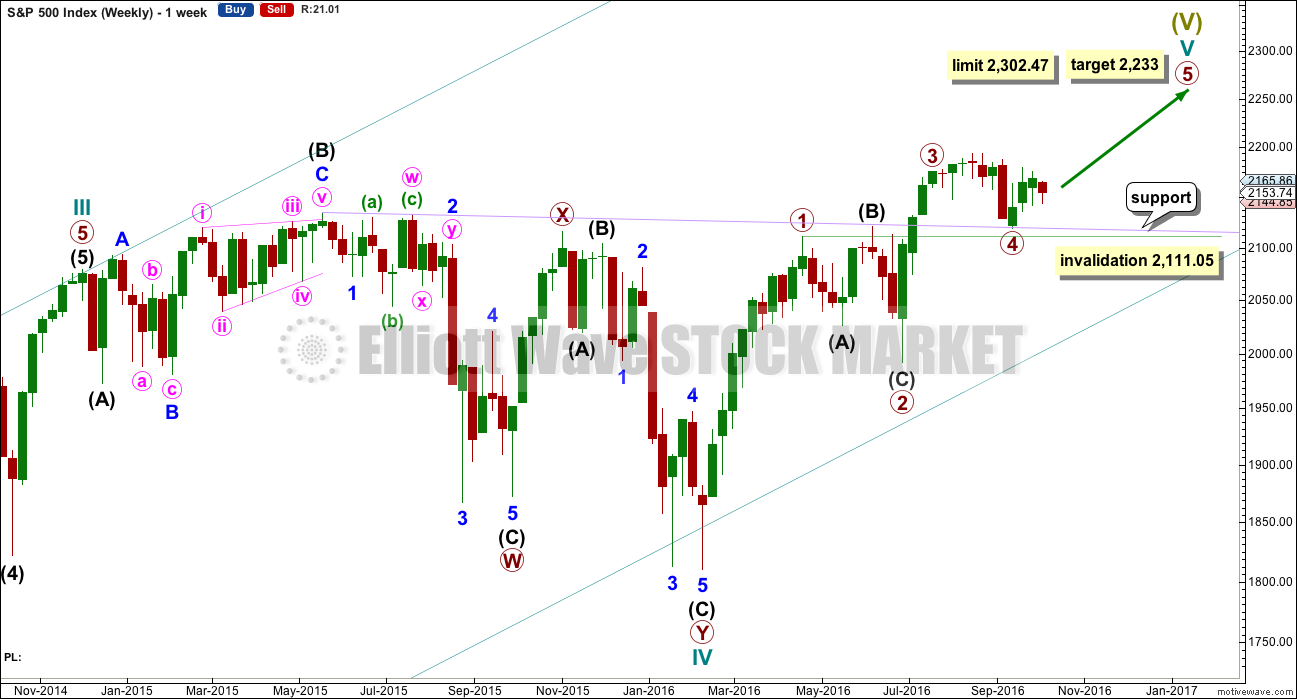
Cycle wave V must subdivide as a five wave structure. I have two wave counts for upwards movement of cycle wave V. This main wave count is presented first only because we should assume the trend remains the same until proven otherwise. Assume that downwards movement is a correction within the upwards trend, until proven it is not.
Primary wave 3 is shorter than primary wave 1, but shows stronger momentum and volume as a third wave normally does. Because primary wave 3 is shorter than primary wave 1 this will limit primary wave 5 to no longer than equality in length with primary wave 3, so that the core Elliott wave rule stating a third wave may not be the shortest is met. Primary wave 5 has a limit at 2,302.47.
Primary wave 2 was a shallow 0.40 expanded flat correction. Primary wave 4 may be exhibiting alternation as a more shallow combination.
Primary wave 4 may not move into primary wave 1 price territory below 2,111.05.
It is also possible to move the degree of labelling within cycle wave V all down one degree. It may be only primary wave 1 unfolding. The invalidation point for this idea is at 1,810.10. That chart will not be published at this time in order to keep the number of charts manageable. The probability that this upwards impulse is only primary wave 1 is even with the probability that it is cycle wave V in its entirety.
When the five wave structure upwards labelled primary wave 5 is complete, then my main wave count will move the labelling within cycle wave V all down one degree and expect that only primary wave 1 may be complete. The labelling as it is here will become an alternate wave count. This is because we should always assume the trend remains the same until proven otherwise. We should always assume that a counter trend movement is a correction, until price tells us it’s not.
DAILY CHART
Click chart to enlarge.
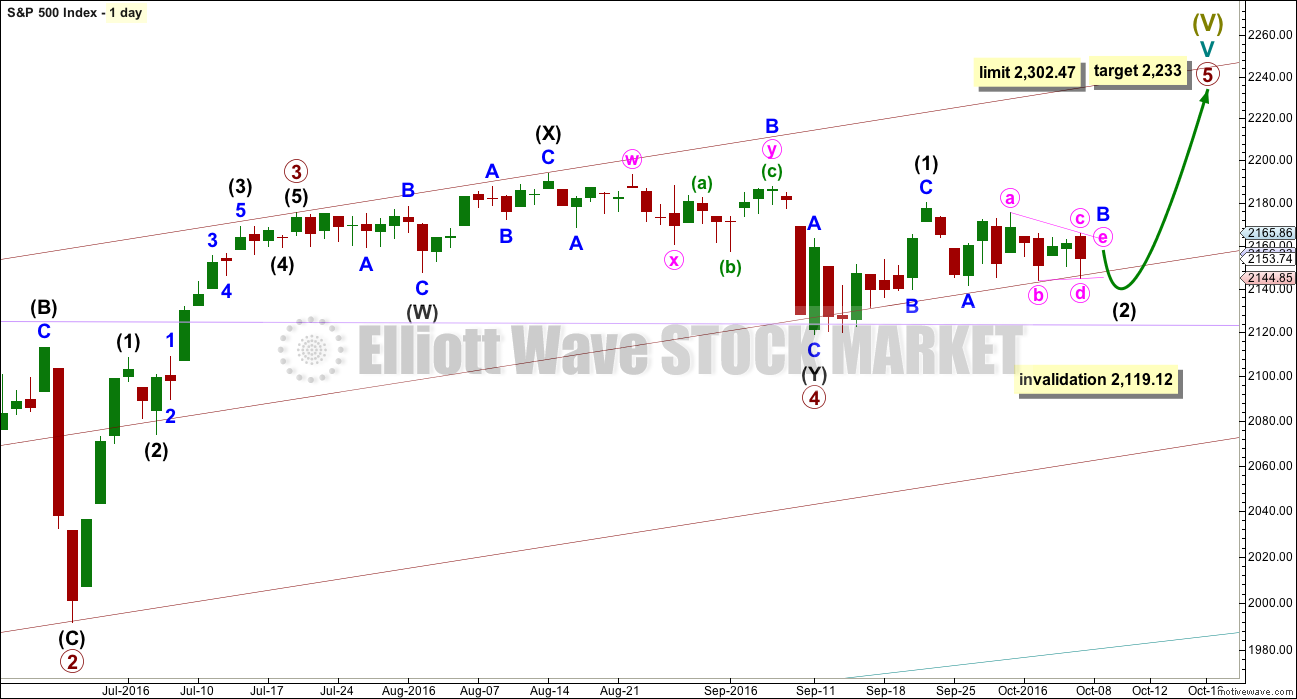
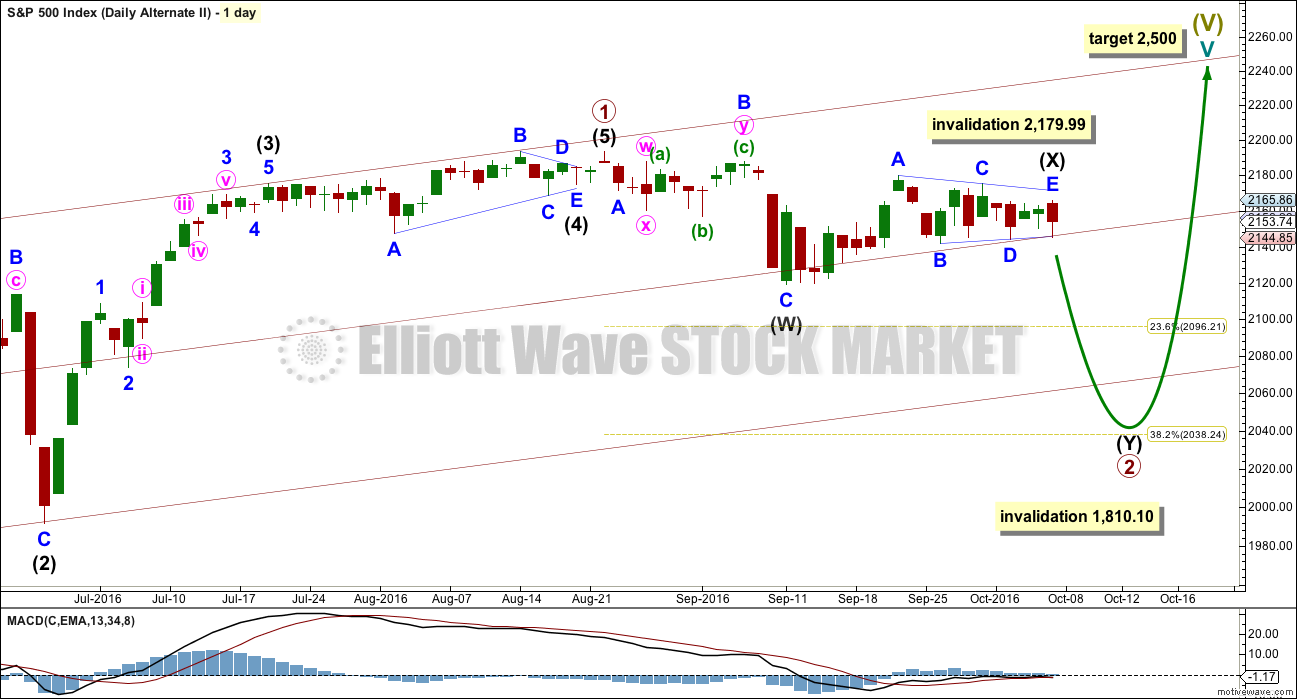
Primary wave 4 may be now complete as a double combination.
It is possible now that primary wave 4 could continue further as a triple, but because triples are very rare the probability of this is very low. If it is over here, then the proportion with primary wave 2 looks right. Within primary wave 5, no second wave correction may move beyond the start of its first wave below 2,119.12.
Primary wave 1 lasted 47 days, primary wave 2 was even in duration at 47 days, primary wave 3 lasted 16 days, and primary wave 4 has lasted 37 days. The proportions between these waves are acceptable.
If primary wave 5 has begun here, then at 2,233 it would reach 0.618 the length of primary wave 1.
At this stage, an impulse for primary wave 5 looks unlikely with invalidation of that idea at the hourly chart level. An ending diagonal now looks more likely for primary wave 5. Ending diagonals are choppy overlapping structures. The classic technical analysis equivalent is a rising wedge. They are terminal structures, doomed to full retracement at their end.
Ending diagonals require all sub-waves to subdivide as zigzags. Intermediate wave (1) fits as a zigzag and looks like a zigzag. Intermediate wave (2) will not fit as a completed zigzag, so the conclusion must be it will move lower. At this stage, it looks like a triangle is unfolding sideways, which may be minor wave B within a zigzag.
If primary wave 5 comes up to touch the upper edge of the maroon channel, it may end there.
HOURLY CHART
Click chart to enlarge.
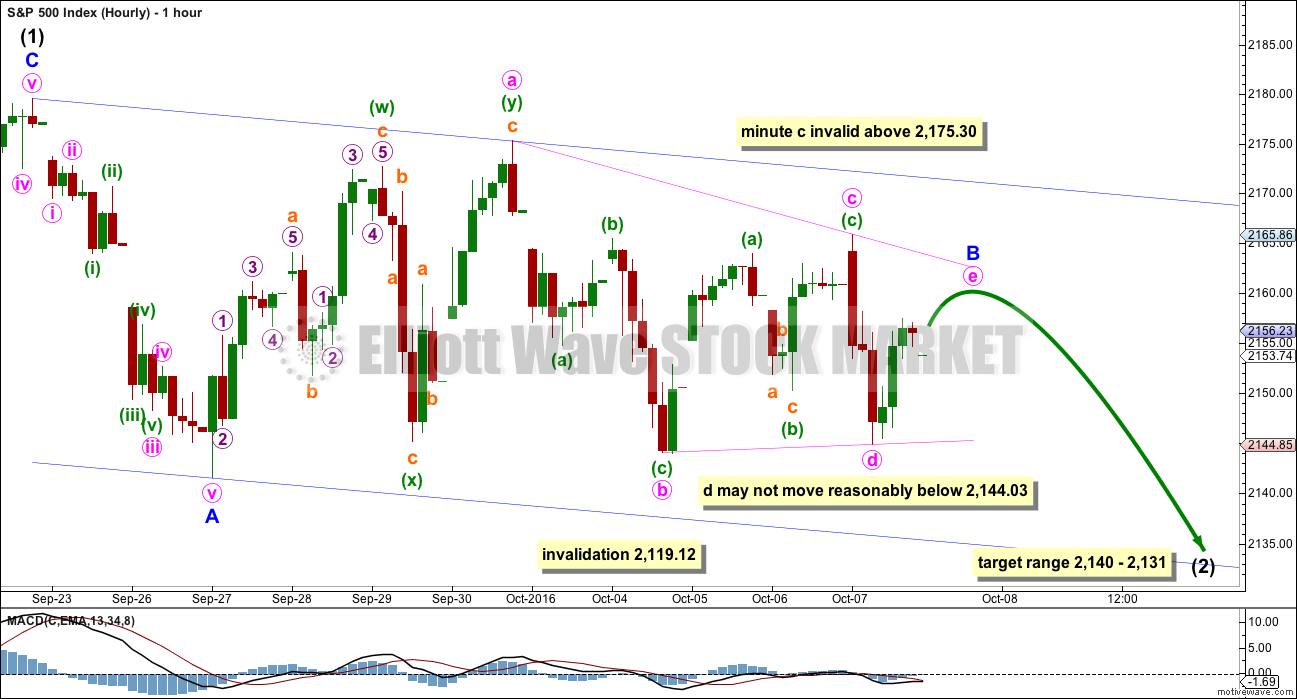
Second and fourth waves within diagonals have a normal depth of from 0.66 to 0.81 the prior wave. This gives a target range for intermediate wave (2) from 2,140 to 2,131.
Intermediate wave (2) must subdivide as a zigzag. It may not move beyond the start of intermediate wave (1) below 2,119.12.
Intermediate wave (1) lasted a Fibonacci eight days. Intermediate wave (2) has so far lasted eleven days. The next Fibonacci number in the sequence would see it continue for two more days to total a Fibonacci thirteen. If that is the case, then the triangle may need one day to complete, and minor wave C downwards may complete in just one day.
At this stage, price is moving sideways and MACD is hovering close to the zero line. It looks like a triangle is forming. The direction of entry into the triangle was down for minor wave A, so the breakout should be downwards in the same direction.
Within the triangle of minor wave B, minute wave c may not move beyond the end of minute wave a above 2,175.30. Minute wave d may not move reasonably below the end of minute wave b at 2,144.03. The final wave for minute wave e is likely to fall short of the a-c trend line and may not move beyond the end of minute wave d.
It is just possible at the end of this week that the triangle could be complete. If I have labelled the start of it correctly, then look out for a short sharp downwards thrust for minor wave C out of the triangle.
It is still possible that minute wave c within the triangle is incomplete, so I am leaving the invalidation point for the triangle at 2,175.30. It is possible that only minuette wave (b) within minute wave c ended at Friday’s low, and that a few more days of slow sideways movement may yet unfold as the triangle continues.
Minor wave C downwards should be a short brief movement ending at least below the end of minor wave A at 2,141.55, so that a truncation is avoided.
At this stage, after more sideways movement, the alternate hourly chart in last analysis looks wrong. It will no longer be published.
ALTERNATE WAVE COUNT
WEEKLY CHART
Click chart to enlarge.
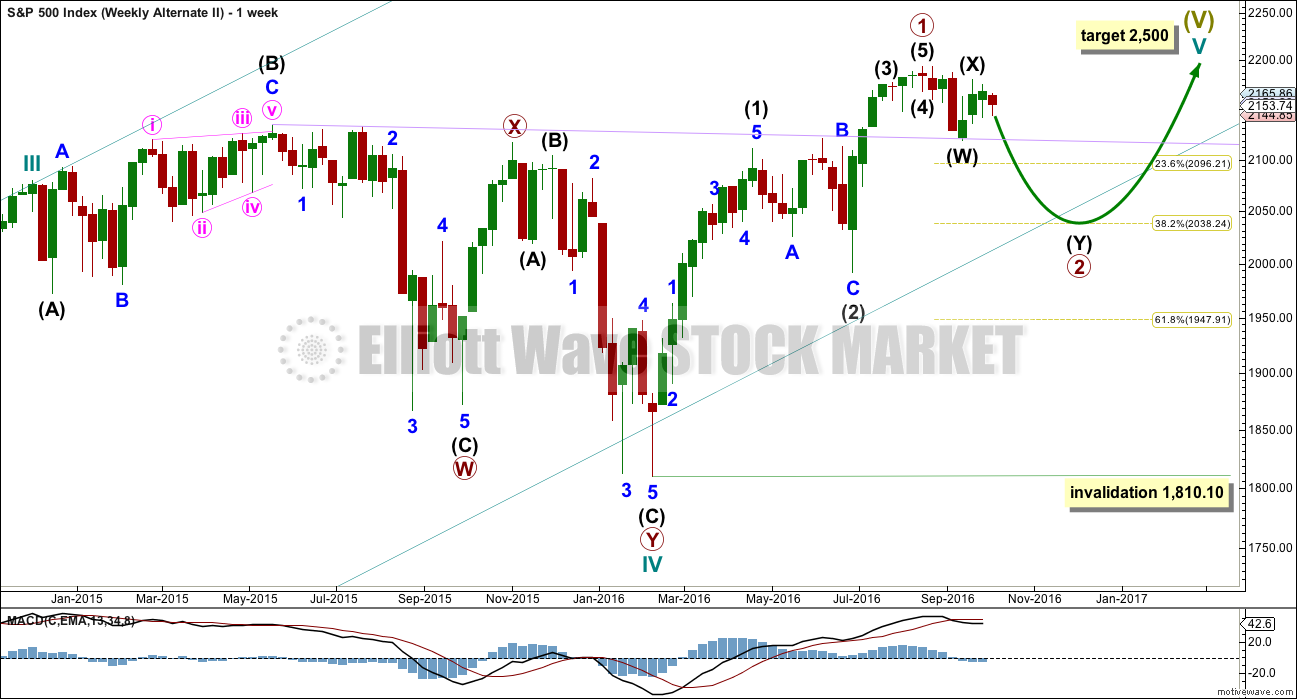
What if an impulse upwards is complete? The implications are important. If this is possible, then primary wave 1 within cycle wave V may be complete.
With downwards movement from the high of primary wave 1 now clearly a three and not a five, the possibility that cycle wave V and Super Cycle wave (V) are over has substantially reduced. This possibility would be eliminated if price can make a new all time high above 2,193.81.
If an impulse upwards is complete, then a second wave correction may be unfolding for primary wave 2. Expectations on how deep primary wave 2 is likely to be are now adjusted. It may be expected now to more likely only reach the 0.382 Fibonacci ratio about 2,038.
At this stage, it looks like price has found strong support at the lilac trend line.
Primary wave 2 may not move beyond the start of primary wave 1 below 1,810.10.
DAILY CHART
Click chart to enlarge.
If an impulse upwards is complete, then how may it subdivide and are proportions good?
Intermediate wave (1) was an impulse lasting 47 days. Intermediate wave (2) was an expanded flat lasting 47 days. Intermediate wave (3) fits as an impulse lasting 16 days, and it is 2.04 points short of 0.618 the length of intermediate wave (1). So far this alternate wave count is identical to the main wave count (with the exception of the degree of labelling, but here it may also be moved up one degree).
Intermediate wave (4) may have been a running contracting triangle lasting 22 days and very shallow at only 0.0027 the depth of intermediate wave (3). At its end it effected only a 0.5 point retracement. There is perfect alternation between the deeper expanded flat of intermediate wave (2) and the very shallow triangle of intermediate wave (4). All subdivisions fit and the proportion is good.
Intermediate wave (5) would be very brief at only 18.29 points. Intermediate wave (5) is 1.43 points longer than 0.056 the length of intermediate wave (1).
At this stage, primary wave 2 now has a completed zigzag downwards that did not reach the 0.236 Fibonacci ratio. It is very unlikely for this wave count that primary wave 2 is over there; the correction is too brief and shallow. Upwards movement labelled intermediate wave (X) is so far less than 0.9 the length of the prior wave down labelled intermediate wave (W). The minimum for a flat correction has not been met. Primary wave 2 may continue lower as a double zigzag. A second zigzag in the double may be required to deepen the correction closer to the 0.382 Fibonacci ratio.
Intermediate wave (W) lasted a Fibonacci 13 sessions. Intermediate wave (X) is now changed today to see a triangle unfolding sideways. X waves may subdivide as any corrective structure (including multiples), and a triangle is possible here.
If minor wave C within the triangle for intermediate wave (X) moves any higher, then it may not move beyond the end of minor wave A above 2,179.99. It is possible today that the triangle for intermediate wave (X) is over and the breakout downwards may come quickly.
Primary wave 2 may not move beyond the start of primary wave 1 below 1,810.10. A new low below this point would see the degree of labelling within cycle wave V moved up one degree. At that stage, a trend change at Super Cycle degree would be expected and a new bear market to span several years would be confirmed.
I will not publish an hourly chart for this alternate. The double zigzag of primary wave 2 is not looking right, so I do not have reasonable confidence in this wave count. Publication of an hourly chart for it would give it too much weight. At this stage, because price is not moving strongly lower out of this possibly complete triangle for intermediate wave (X), this wave count is looking less and less likely each day. I may soon choose to stop publishing it if it does not redeem itself.
TECHNICAL ANALYSIS
WEEKLY CHART
Click chart to enlarge. Chart courtesy of StockCharts.com.
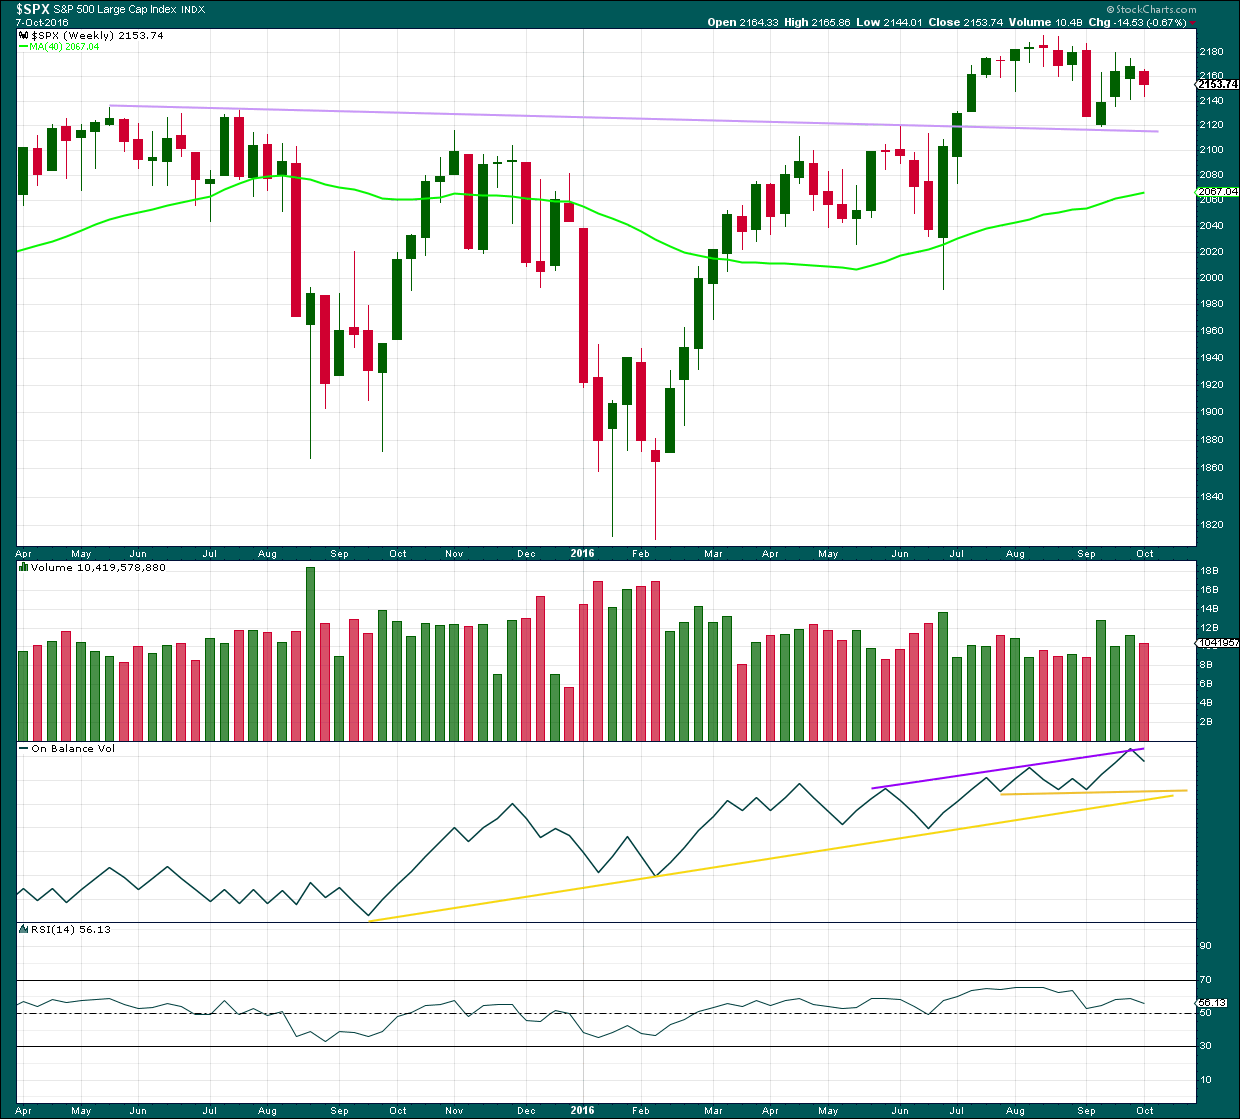
The lilac trend line has strong technical significance. Price has broken through resistance, turned down to test support, and is now moving up and away from this line. It is reasonable to conclude that a new all time high is a likely consequence of this typical behaviour.
Last week closed green and has some support from volume. A further rise in price overall would be expected to follow. This week is an inside week and closes red on lighter volume. The decline in price was not as well supported as the prior rise in price. This supports a bullish outlook for the mid term at least.
On Balance Volume last week came up to touch the purple trend line. It has found resistance and moved down from there. A break above the purple line would be a reasonably strong bullish signal. If OBV moves lower, it should find support at the yellow lines.
RSI is not extreme and exhibits no divergence at the weekly chart level to indicate weakness in price. There is room for price to rise further.
DAILY CHART
Click chart to enlarge. Chart courtesy of StockCharts.com.
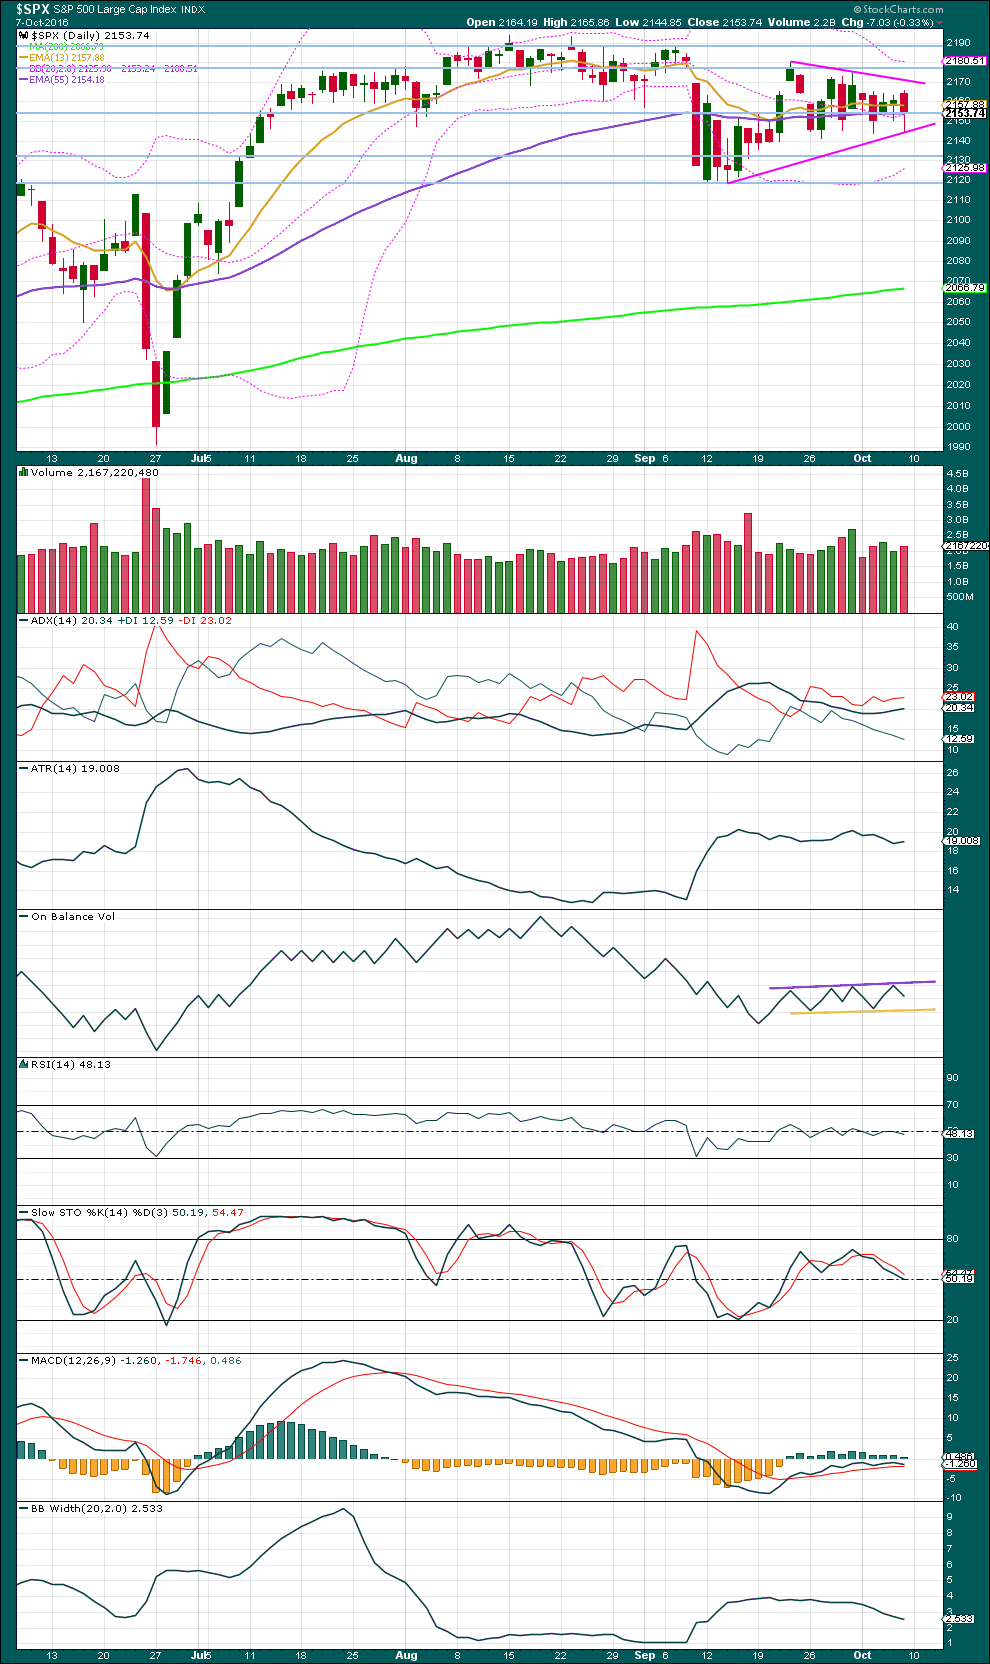
A triangle pattern is forming, delineated by pink lines. A break above or below the borders of the triangle on a day with an increase in volume would indicate a potential trend returning finally to this market.
Downwards movement for Friday has some support from volume, so it is reasonable to expect at least some more downwards movement next week, possibly on Monday.
The long lower wick of Friday’s candlestick is slightly bullish.
ADX is above 15 and increasing, indicating a downwards trend is in place. The -DX line is above the +DX line. ATR and Bollinger Bands strongly disagree that this market is trending though, so ADX should be approached with skepticism today. ATR is declining and Bollinger Bands are contracting. With declining range and volatility, the idea of a triangle consolidating is more likely.
On Balance Volume now has a small sideways range reasonably clear, so the trend lines about it are redrawn at the end of this week. A break above the purple line would be bullish and may precede a movement from price. A break below the yellow line would be bearish and may precede a movement from price. OBV tends to work well with trend lines.
RSI is neutral. There is plenty of room for price to rise or fall.
Stochastics is rolling over before reaching overbought. It has not been able to reach extremes lately; expectations for it may currently be narrowed. It may be now indicating a small downwards swing.
MAC is indicating a small upwards trend, in opposition to ADX. Disagreement between these two during a consolidating market would be reasonable.
VOLATILITY – INVERTED VIX CHART
Click chart to enlarge. Chart courtesy of StockCharts.com.
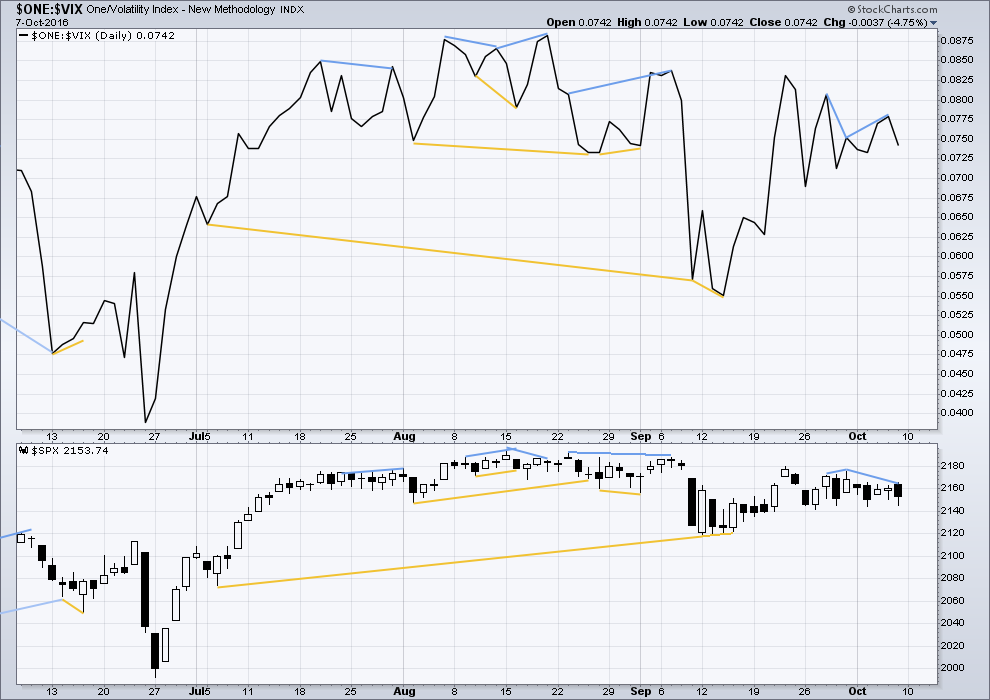
There are a few instances of multi day divergence between price and inverted VIX noted here. Bearish divergence is blue. Bullish divergence is yellow. It appears so far that divergence between inverted VIX and price is again working to indicate short term movements spanning one or two days.
Short term bearish divergence was noted in last analysis between price and inverted VIX. This has now been followed by one day of reasonable downwards movement. This divergence may now be resolved, or it may still need one more day of downwards movement to resolve it.
BREADTH – AD LINE
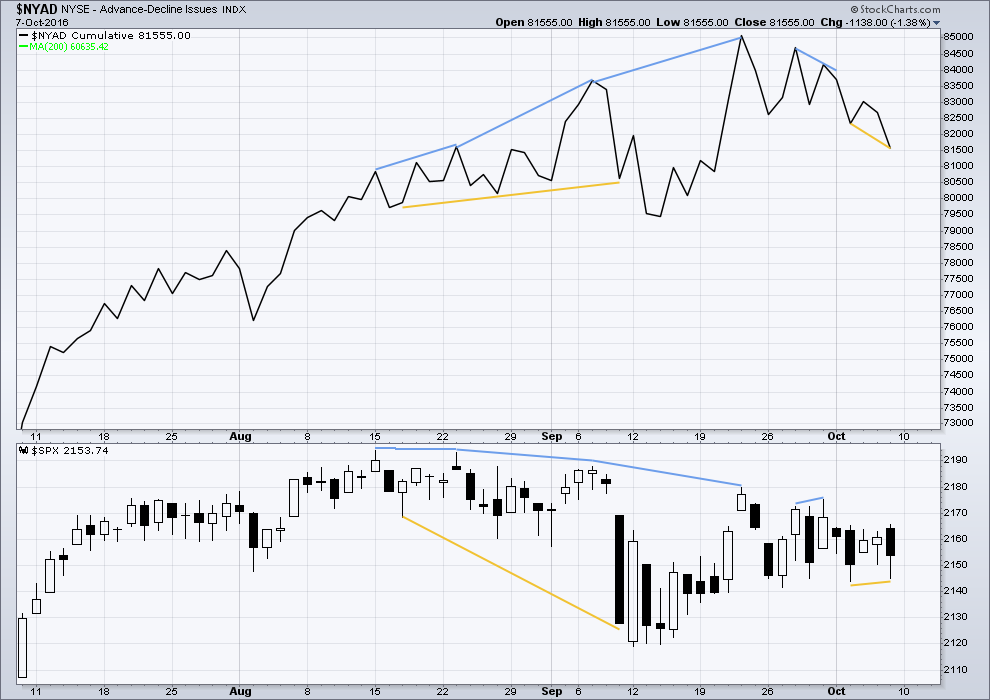
Click chart to enlarge. Chart courtesy of StockCharts.com.
There is support from market breadth as price is rising.
Short term bullish and bearish divergence is again working between price and the AD line to show the direction for the following one or two days.
There is short term divergence after Friday’s session between price and the AD line: price made a slightly higher low beyond the prior session three days ago, but the AD line has made a lower low. This divergence is bullish and indicates weakness in price. It may be expected to be followed by one or two days of overall upwards movement to resolve it.
DOW THEORY
Major lows within the old bull market:
DJIA: 15,855.12 (15th October, 2014) – closed below on 25th August, 2015.
DJT: 7,700.49 (12th October, 2014) – closed below on 24th August, 2015.
S&P500: 1,821.61 (15th October, 2014) – has not closed below this point yet.
Nasdaq: 4,117.84 (15th October, 2014) – has not closed below this point yet.
Major highs within the bear market from November 2014:
DJIA: 17,977.85 (4th November, 2015) – closed above on 18th April, 2016.
DJT: 8,358.20 (20th November, 2015) – has not closed above this point yet.
S&P500: 2,116.48 (3rd November, 2015) – closed above this point on 8th June, 2016.
Nasdaq: 5,176.77 (2nd December, 2015) – closed above this point on 1st August, 2016.
Dow Theory Conclusion: Original Dow Theory still sees price in a bear market because the transportations have failed to confirm an end to that bear market. Modified Dow Theory (adding S&P and Nasdaq) has failed still to confirm an end to the old bull market, modified Dow Theory sees price still in a bull market.
This analysis is published @ 05:15 p.m. EST on 8th October, 2016.
It looks like the triangle is going to continue for another one or two days. Minute c moved higher today.
Minute d should end at the lower pink trend line, triangles normally adhere well to their lines so with two points to draw this line across I expect this is where it should sit.
Adam Lass of Bottarelli Research is a master chartist. He is noting four previous failed attempts to penetrate resistance of the “Price Diamond” and thinks it is facing the final test at the moment, which result in either a break-out or a break-down. This is very much in keeping with Lara’s triangle count. Of course we think the final test will be the E wave of the triangle to be followed by a sharp thrust to the downside. Lass also sees a 2110 area as a likely target.
http://www.bottarelliresearch.com/charts/2016/10/10/normally-wouldnt-share-unusual-chart
Adding to VIX 10.00 strike calls expiring next week with intention to take assignment.
Selling DIA 185/187 bearish call spread expiring next week for limit credit of .30, 1/4 full position. Will add another 1/4 when this morning’s gap is filled. Final half when Friday’s low is taken out. We are now probably in final wave E of triangle. Hard stop above DJI 18,450.00
Bloomberg is reporting accelerating outflows from money market funds. We are now looking at a figure below 500 billion for the first time since they started keeping track and there is no signs things are slowing. We know baby boomers have been retiring and for the retail investor there has been a net negative flow of money into equities but this seems to be something entirely different going on.
If you see or hear even a whisper about money market funds attempts to stall or halt these withdrawals…well, need I say more? Apparently not everyone is drinking the kool-aid.
The MMs and banksters know everyone is watching the developing triangle so they’re are off to the races with the head-fake to the upside based on the price action in futures. Y’all know what to do! 🙂
I think the coming global collapse is beginning to take shape as to exactly how it will be triggered. Forget FED QE and/or interest rate hikes, forget company stock buy-backs, and most definitely forget Brexit. All eyes should be on Italy.
Italians are hopping mad over the way they were financially raped during the last bail-in. The society was in absolute shock as several pensioners committed suicide over the theft of their life savings and they are not waiting around for a repeat performance. Although not widely reported, there is a silent but relentless run on Italian banks taking place which is exacerbating their already perilous situation so far as their available capital is concerned. The fact of the matter is they cannot survive unless they once again raid their depositors. They will totally collapse without another bail-in. This presents a remarkable Faustian choice for Renzi. Save the banks, further ignite the wrath of the Italian people, and make a near certainty of the Dec 4 referendum to leave the EU an inevitability, or allow the system to collapse, basically triggering a global financial catastrophic event. It is a no-win situation. I simply cannot believe all the talking-head geniuses do not see this coming. Perhaps they do and hope that you don’t! Cheers!
Lara,
I am a new subscriber and just wanted to tell you that these videos are incredibly helpful as I continue to learn about and follow EWT. I have just started reading Elliott Wave Principal and the book combined with your videos is helping my learning progress.
From the comments below, can you explain what an “inside week” is? Thanks. -Dan
Hi Daniel, thank you.
An inside week is a week in which the high and low of the week is within the range of the prior week. It is “inside” the prior week.
Thanks Lara.
If I am correct, we have complete inside weekly candles two weeks in a row. This brings with it some risk as the last two times this happened (a bit before the 2001 and 2008 peaks) it was followed by a bear market. There appears to be some significant time lapse between the double inside weekly candles and the start of the bear market. And that is what the main count now indicates. This is saying 2017 may not be a very good year for the US equity markets.
“Here’s a looksie at all double inside weeks in the S&P 500 over the past 20 years.” Sentiment Trader – October 7, 2016
https://twitter.com/sentimentrader/status/784512611853357056
Thanks for the link Philip.
If we see the same pattern again then we shall see a new high, to be quickly followed by a bear market. That’s exactly what the wave count expects.
Boy does that 20 year chart bring back some memories. Prechter was all over the news waves talking about how certain he was the markets were putting in a historic head and shoulders pattern back in 2011 and that 2012 would be the top. The banksters and buybacks were able to negate the pattern. What rabbit will they attempt to pull out of the hat this time around, I wonder…? I myself was sure the RSI swing failure we saw last year meant it was all over as that had been the signal back in 2000 and 2007, yet here we are! 🙂
Great link!
Thank you for the description of an inside week and for the additional comments. Appreciate it. -Dan