
Sideways movement was expected for Thursday’s session, which is essentially what has happened.
Summary: In the short term, tomorrow may print a red daily candlestick. Overall sideways movement for tomorrow and the day after may complete a triangle, which should break out downwards for a short sharp thrust to end in a range from 2,140 to 2,131. Thereafter, price should turn up to make a new high above 2,179.58.
Last monthly chart for the main wave count is here.
New updates to this analysis are in bold.
MAIN WAVE COUNT
WEEKLY CHART
Click chart to enlarge.
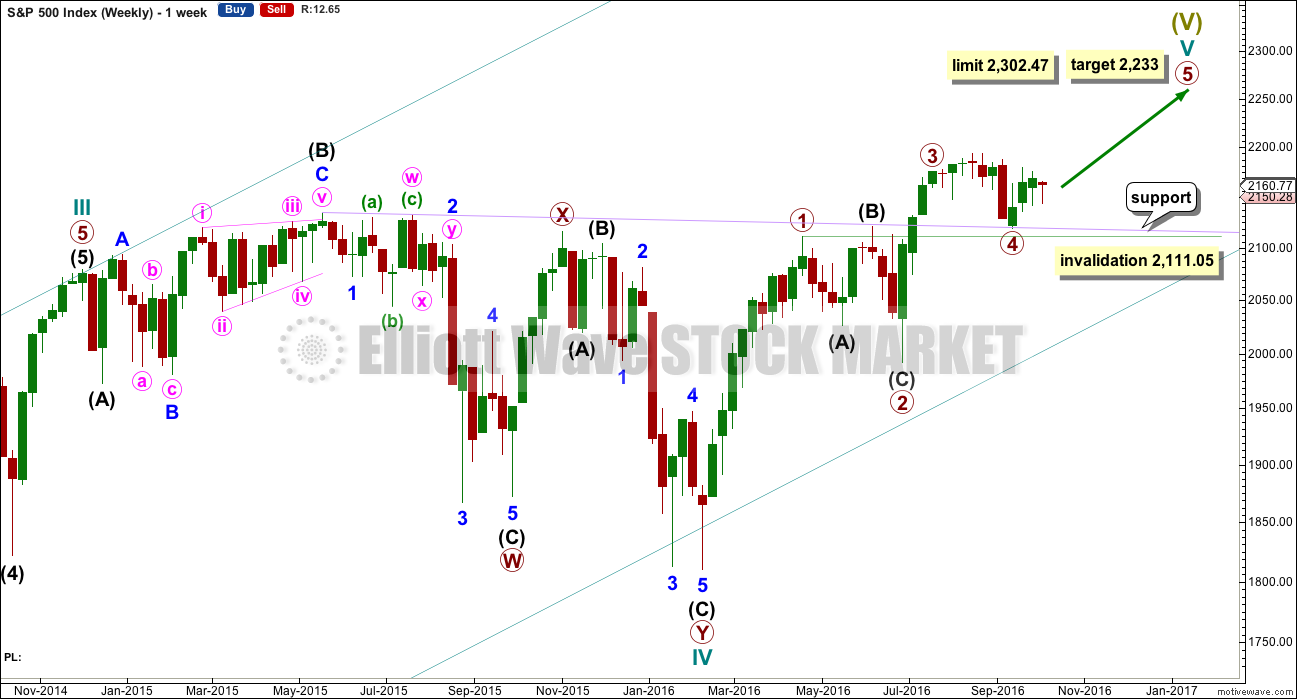
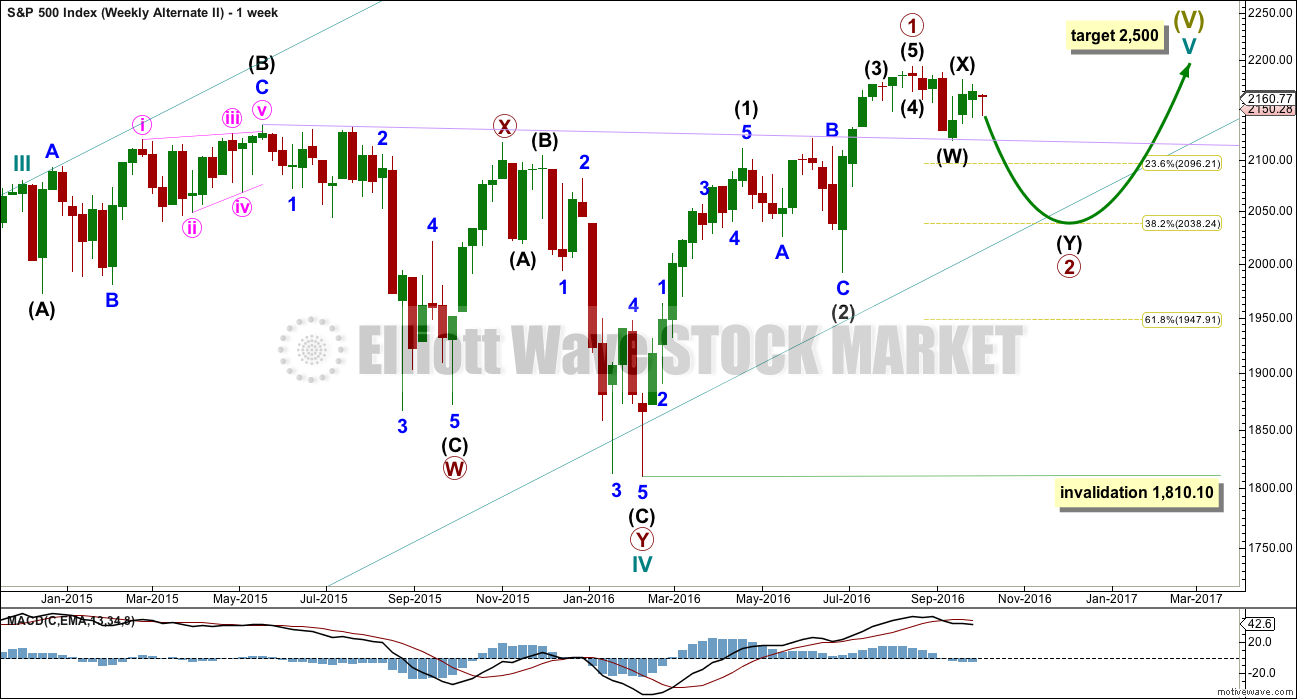
Cycle wave V must subdivide as a five wave structure. I have two wave counts for upwards movement of cycle wave V. This main wave count is presented first only because we should assume the trend remains the same until proven otherwise. Assume that downwards movement is a correction within the upwards trend, until proven it is not.
Primary wave 3 is shorter than primary wave 1, but shows stronger momentum and volume as a third wave normally does. Because primary wave 3 is shorter than primary wave 1 this will limit primary wave 5 to no longer than equality in length with primary wave 3, so that the core Elliott wave rule stating a third wave may not be the shortest is met. Primary wave 5 has a limit at 2,302.47.
Primary wave 2 was a shallow 0.40 expanded flat correction. Primary wave 4 may be exhibiting alternation as a more shallow combination.
Primary wave 4 may not move into primary wave 1 price territory below 2,111.05.
It is also possible to move the degree of labelling within cycle wave V all down one degree. It may be only primary wave 1 unfolding. The invalidation point for this idea is at 1,810.10. That chart will not be published at this time in order to keep the number of charts manageable. The probability that this upwards impulse is only primary wave 1 is even with the probability that it is cycle wave V in its entirety.
When the five wave structure upwards labelled primary wave 5 is complete, then my main wave count will move the labelling within cycle wave V all down one degree and expect that only primary wave 1 may be complete. The labelling as it is here will become an alternate wave count. This is because we should always assume the trend remains the same until proven otherwise. We should always assume that a counter trend movement is a correction, until price tells us it’s not.
DAILY CHART
Click chart to enlarge.
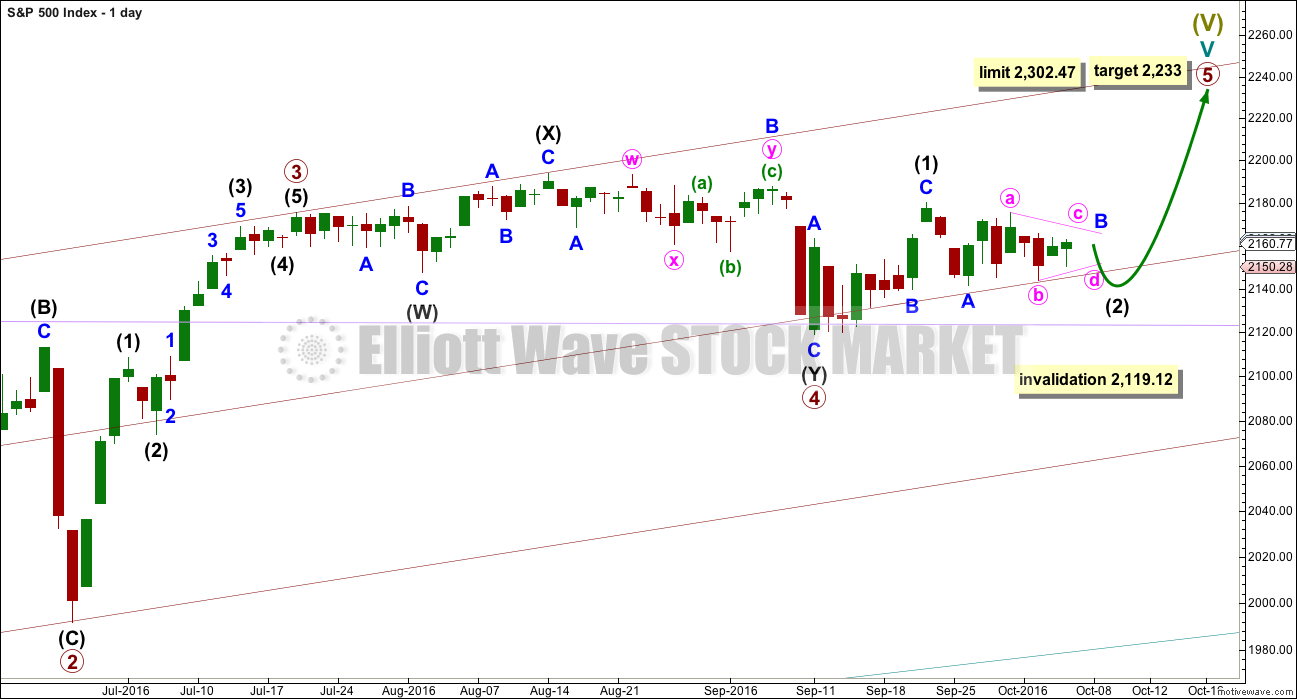
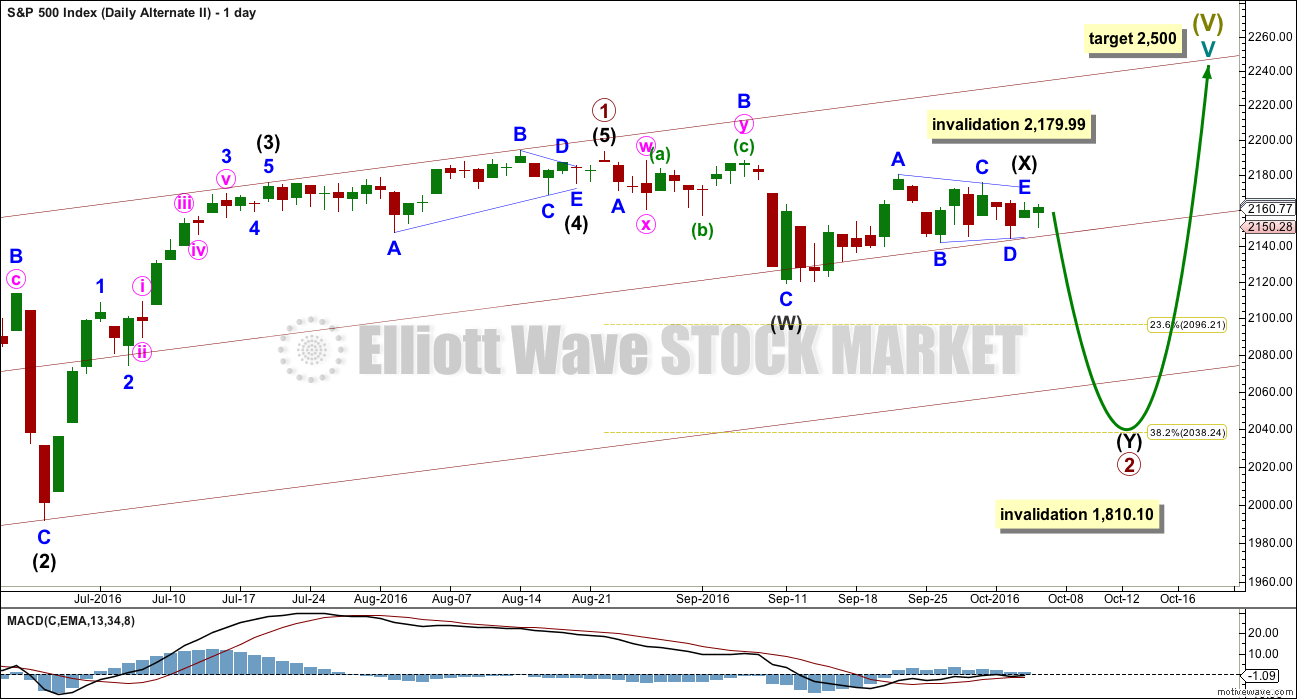
Primary wave 4 may be now complete as a double combination.
It is possible now that primary wave 4 could continue further as a triple, but because triples are very rare the probability of this is very low. If it is over here, then the proportion with primary wave 2 looks right. Within primary wave 5, no second wave correction may move beyond the start of its first wave below 2,119.12.
Primary wave 1 lasted 47 days, primary wave 2 was even in duration at 47 days, primary wave 3 lasted 16 days, and primary wave 4 has lasted 37 days. The proportions between these waves are acceptable.
If primary wave 5 has begun here, then at 2,233 it would reach 0.618 the length of primary wave 1.
At this stage, an impulse for primary wave 5 looks unlikely with invalidation of that idea at the hourly chart level. An ending diagonal now looks more likely for primary wave 5. Ending diagonals are choppy overlapping structures. The classic technical analysis equivalent is a rising wedge. They are terminal structures, doomed to full retracement at their end.
Ending diagonals require all sub-waves to subdivide as zigzags. Intermediate wave (1) fits as a zigzag and looks like a zigzag. Intermediate wave (2) will not fit as a completed zigzag, so the conclusion must be it will move lower. At this stage, it looks like a triangle is unfolding sideways, which may be minor wave B within a zigzag.
If primary wave 5 comes up to touch the upper edge of the maroon channel, it may end there.
HOURLY CHART
Click chart to enlarge.
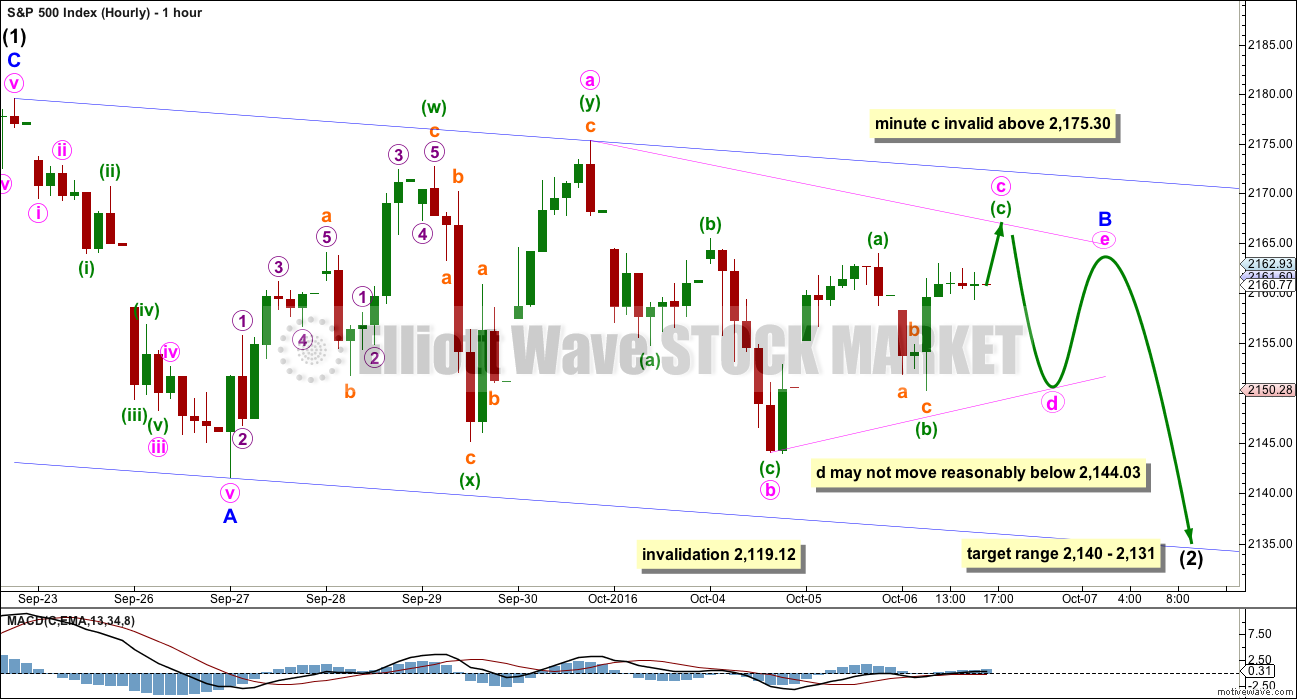
Second and fourth waves within diagonals have a normal depth of from 0.66 to 0.81 the prior wave. This gives a target range for intermediate wave (2) from 2,140 to 2,131.
Intermediate wave (2) must subdivide as a zigzag. It may not move beyond the start of intermediate wave (1) below 2,119.12.
Intermediate wave (1) lasted a Fibonacci eight days. Intermediate wave (2) has so far lasted ten days. The next Fibonacci number in the sequence would see it continue for three more days to total a Fibonacci thirteen. If that is the case, then the triangle may need two more days to complete, and minor wave C downwards may complete in just one day.
At this stage, price is moving sideways and MACD is hovering close to the zero line. It looks like a triangle is forming. The direction of entry into the triangle was down for minor wave A, so the breakout should be downwards in the same direction.
Within the triangle of minor wave B, minute wave c may not move beyond the end of minute wave a above 2,175.30. When minute wave c is complete, then minute wave d may not move reasonably below the end of minute wave b at 2,144.03. The final wave for minute wave e is likely to fall short of the a-c trend line and may not move beyond the end of minute wave d.
When the triangle is complete, then minor wave C downwards should be a short brief movement ending at least below the end of minor wave A at 2,141.55, so that a truncation is avoided.
ALTERNATE HOURLY CHART
Click chart to enlarge.
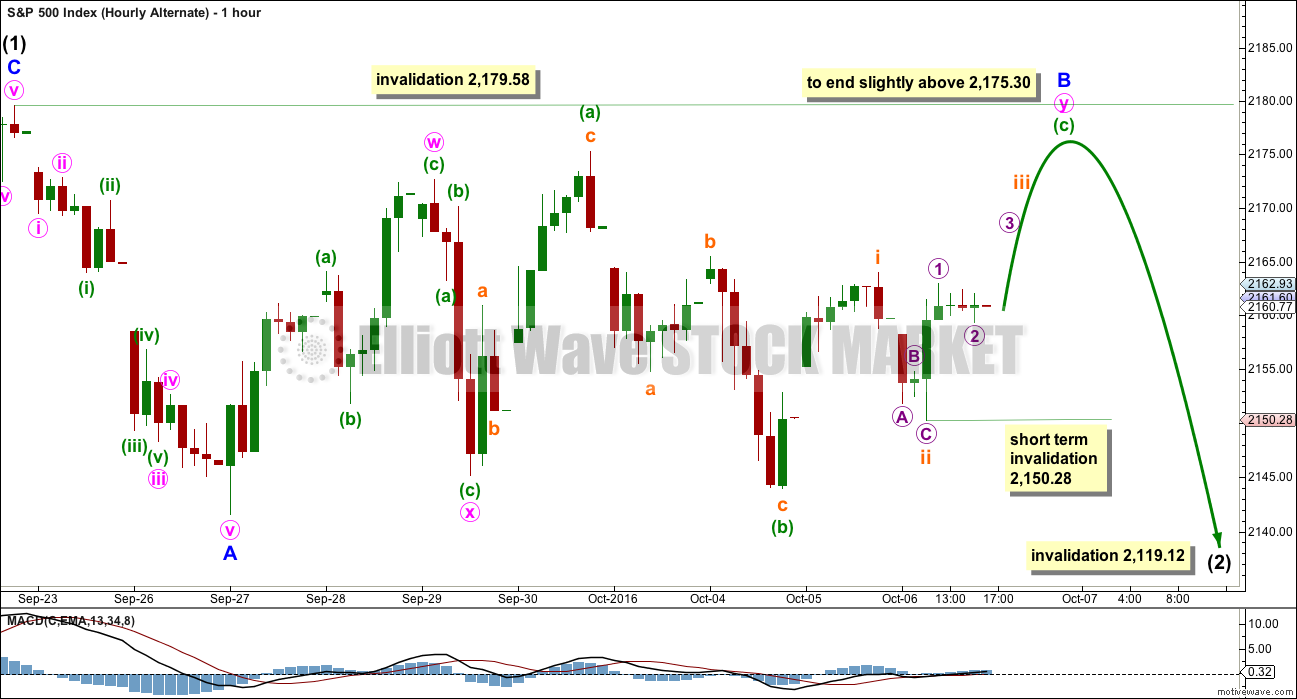
It is important when a triangle looks like it is unfolding to always consider alternates. At this stage, this is the best alternate I can see.
Minor wave B may not be a triangle. It may be moving further sideways as a double combination. The first structure in the combination may be a zigzag labelled minute wave w. The double may be joined by a quick deep zigzag in the opposite direction labelled minute wave x. The second structure in the double combination may be a flat labelled minute wave y, which would be incomplete.
Within minute wave y, the correction for minuette wave (b) is a 1.04 length of minuette wave (a). Minute wave y would be classified as a regular flat correction. These normally have C waves which move only slightly beyond the end of the A wave. Minuette wave (c) should end slightly above the end of minuette wave (a) at 2,175.30 to avoid a truncation, but minor wave B may not move beyond the start of minor wave A above 2,179.58.
The structure of minuette wave (c) would be incomplete. Within minuette wave (c), subminuette waves i and ii would be complete. Within subminuette wave iii, the correction for micro wave 2 may not move beyond the start of micro wave 1 below 2,150.28. In the short term, a new low below this point would invalidate this alternate wave count giving a little more confidence to the triangle on the main hourly wave count.
In the unlikely event that price invalidates both these hourly wave counts with a move very soon above 2,179.58, then my analysis for both hourly charts would be wrong and intermediate wave (3) upwards would be underway.
ALTERNATE WAVE COUNT
WEEKLY CHART
Click chart to enlarge.
What if an impulse upwards is complete? The implications are important. If this is possible, then primary wave 1 within cycle wave V may be complete.
With downwards movement from the high of primary wave 1 now clearly a three and not a five, the possibility that cycle wave V and Super Cycle wave (V) are over has substantially reduced. This possibility would be eliminated if price can make a new all time high above 2,193.81.
If an impulse upwards is complete, then a second wave correction may be unfolding for primary wave 2. Expectations on how deep primary wave 2 is likely to be are now adjusted. It may be expected now to more likely only reach the 0.382 Fibonacci ratio about 2,038.
At this stage, it looks like price has found strong support at the lilac trend line.
Primary wave 2 may not move beyond the start of primary wave 1 below 1,810.10.
DAILY CHART
Click chart to enlarge.
If an impulse upwards is complete, then how may it subdivide and are proportions good?
Intermediate wave (1) was an impulse lasting 47 days. Intermediate wave (2) was an expanded flat lasting 47 days. Intermediate wave (3) fits as an impulse lasting 16 days, and it is 2.04 points short of 0.618 the length of intermediate wave (1). So far this alternate wave count is identical to the main wave count (with the exception of the degree of labelling, but here it may also be moved up one degree).
Intermediate wave (4) may have been a running contracting triangle lasting 22 days and very shallow at only 0.0027 the depth of intermediate wave (3). At its end it effected only a 0.5 point retracement. There is perfect alternation between the deeper expanded flat of intermediate wave (2) and the very shallow triangle of intermediate wave (4). All subdivisions fit and the proportion is good.
Intermediate wave (5) would be very brief at only 18.29 points. Intermediate wave (5) is 1.43 points longer than 0.056 the length of intermediate wave (1).
At this stage, primary wave 2 now has a completed zigzag downwards that did not reach the 0.236 Fibonacci ratio. It is very unlikely for this wave count that primary wave 2 is over there; the correction is too brief and shallow. Upwards movement labelled intermediate wave (X) is so far less than 0.9 the length of the prior wave down labelled intermediate wave (W). The minimum for a flat correction has not been met. Primary wave 2 may continue lower as a double zigzag. A second zigzag in the double may be required to deepen the correction closer to the 0.382 Fibonacci ratio.
Intermediate wave (W) lasted a Fibonacci 13 sessions. Intermediate wave (X) is now changed today to see a triangle unfolding sideways. X waves may subdivide as any corrective structure (including multiples), and a triangle is possible here.
If minor wave C within the triangle for intermediate wave (X) moves any higher, then it may not move beyond the end of minor wave A above 2,179.99. It is possible today that the triangle for intermediate wave (X) is over and the breakout downwards may come quickly.
Primary wave 2 may not move beyond the start of primary wave 1 below 1,810.10. A new low below this point would see the degree of labelling within cycle wave V moved up one degree. At that stage, a trend change at Super Cycle degree would be expected and a new bear market to span several years would be confirmed.
I will not publish an hourly chart for this alternate. The double zigzag of primary wave 2 is not looking right, so I do not have reasonable confidence in this wave count. Publication of an hourly chart for it would give it too much weight. At this stage, because price is not moving strongly lower out of this possibly complete triangle for intermediate wave (X), this wave count is looking less and less likely each day. I may soon choose to stop publishing it if it does not redeem itself.
TECHNICAL ANALYSIS
WEEKLY CHART
Click chart to enlarge. Chart courtesy of StockCharts.com.
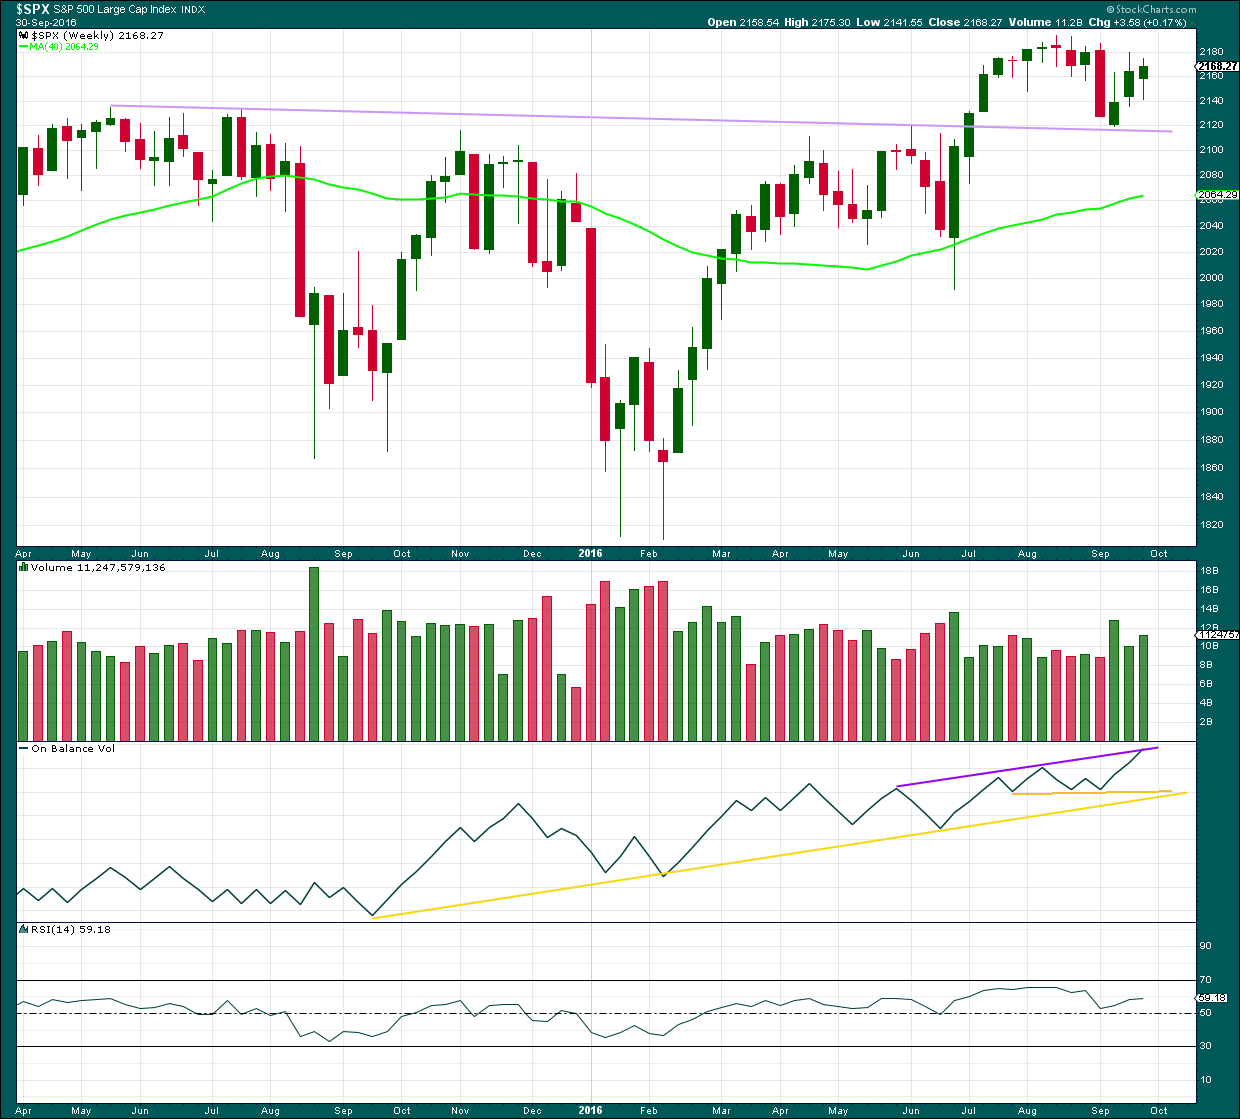
The lilac trend line has strong technical significance. Price has broken through resistance, turned down to test support, and is now moving up and away from this line. It is reasonable to conclude that a new all time high is a likely consequence of this typical behaviour.
Last week closed green and has some support from volume. A further rise in price overall would be expected to follow.
On Balance Volume last week came up to touch the purple trend line. It may find some resistance there. A break above this line would be a weak bullish signal. There is divergence with the high last week and the prior high seven weeks ago: OBV has made a higher high but price has made a lower high. This divergence is bearish and indicates weakness in price. This old bull market continues to show internal weakness.
RSI is not extreme and exhibits no divergence at the weekly chart level to indicate weakness in price. There is room for price to rise further.
DAILY CHART
Click chart to enlarge. Chart courtesy of StockCharts.com.
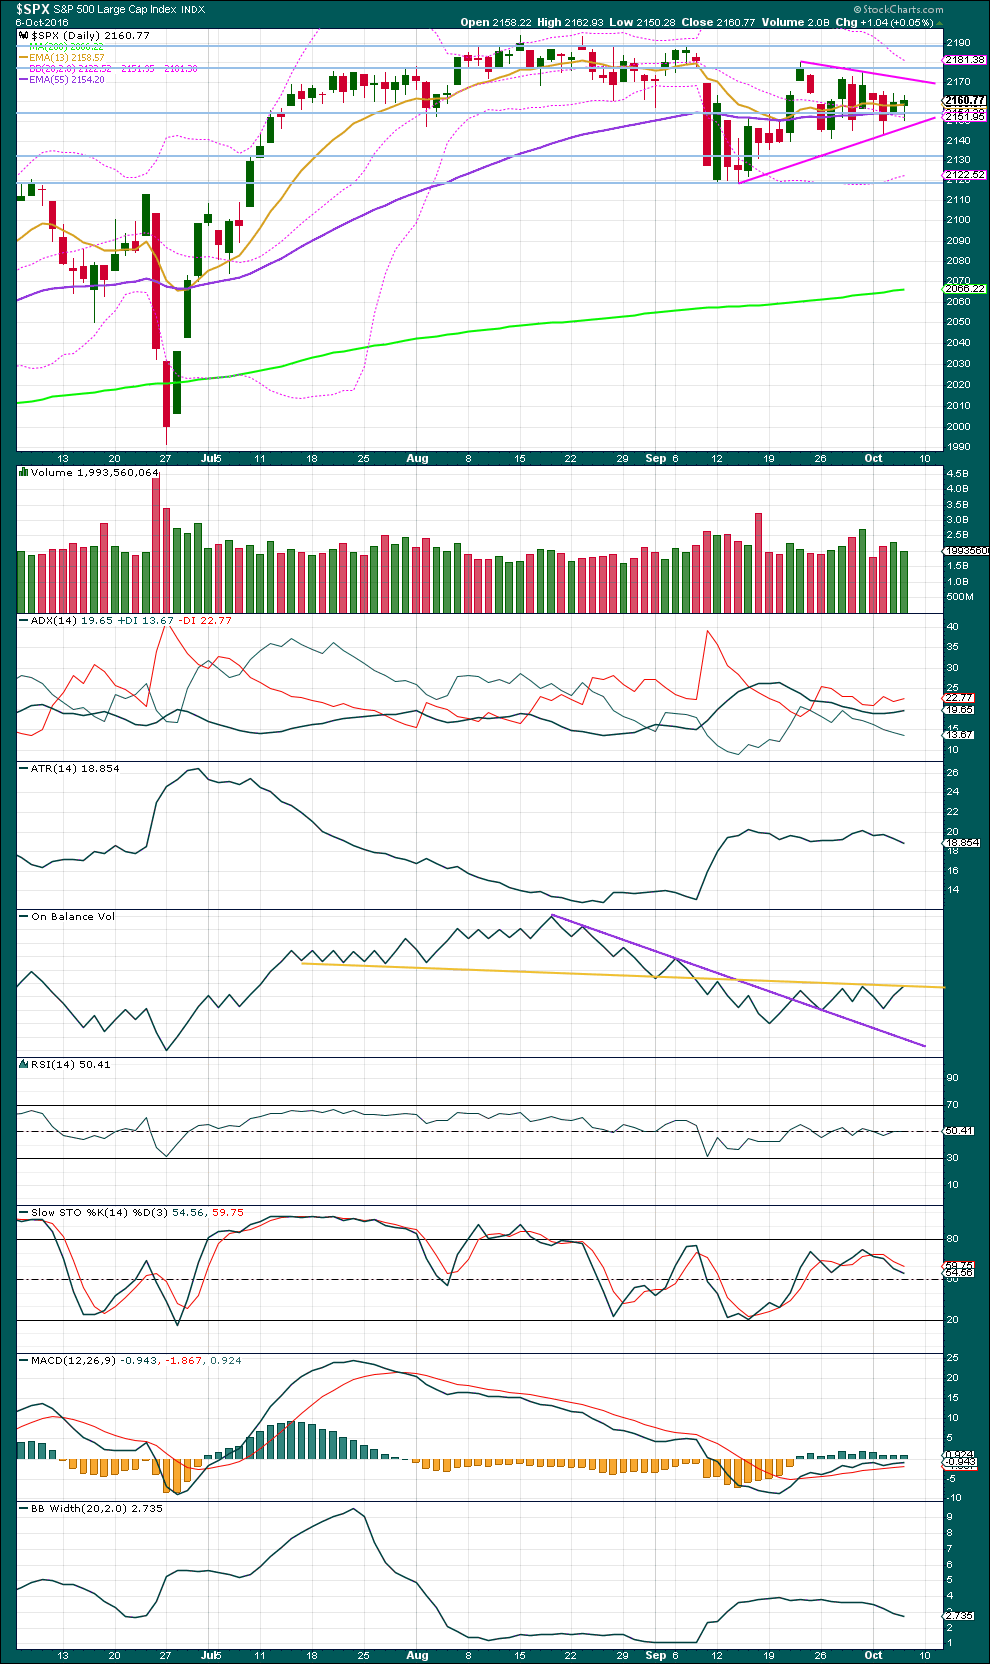
A triangle pattern is forming, delineated by pink lines. A break above or below the borders of the triangle on a day with an increase in volume would indicate a potential trend returning finally to this market.
Upwards movement today does not have support from volume. Volume should decline further as the triangle continues further. If this happens, that would offer confidence to the triangle.
ADX today is above 15 and increasing, indicating an upwards trend is in place. ATR and Bollinger Bands strongly disagree that this market is trending though, so ADX should be approached with skepticism today. ATR is declining and Bollinger Bands are contracting. With declining range and volatility, the idea of a triangle consolidating is more likely.
The yellow trend line on On Balance Volume is today very slightly adjusted to be conservative. There is some leeway in exactly how this line is drawn. OBV may find some resistance here. Resistance at this yellow line along with a decline in volume today suggest a downwards day tomorrow.
RSI is neutral. There is plenty of room for price to rise or fall.
Stochastics is rolling over before reaching overbought. It has not been able to reach extremes lately; expectations for it may currently be narrowed. It may be now indicating a small downwards swing.
MAC is indicating a small upwards trend, in opposition to ADX. Disagreement between these two during a consolidating market would be reasonable.
VOLATILITY – INVERTED VIX CHART
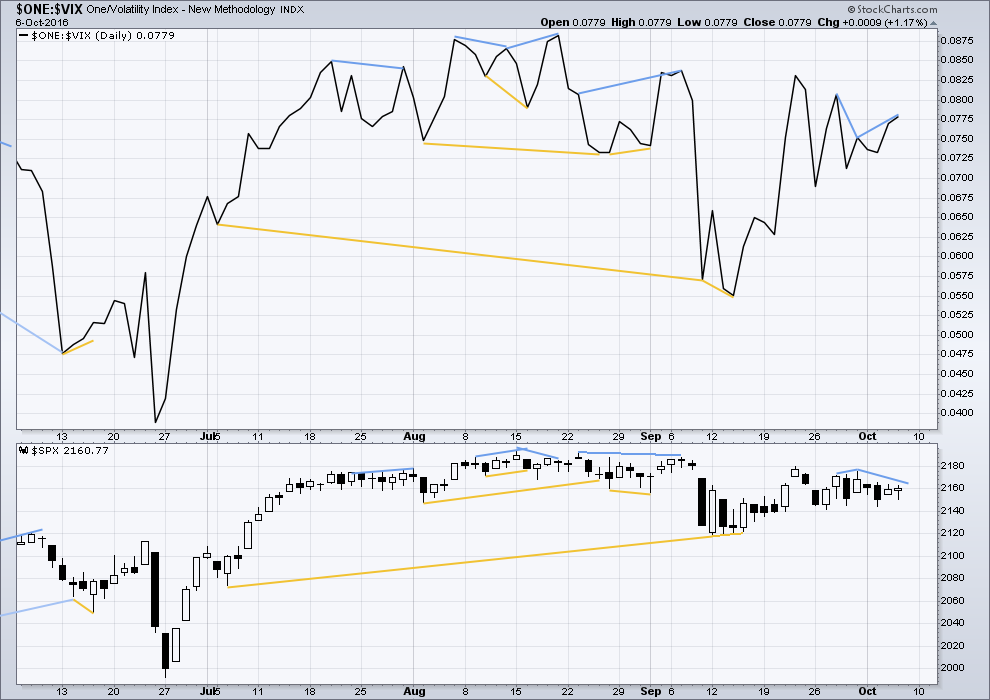
Click chart to enlarge. Chart courtesy of StockCharts.com.
There are a few instances of multi day divergence between price and inverted VIX noted here. Bearish divergence is blue. Bullish divergence is yellow. It appears so far that divergence between inverted VIX and price is again working to indicate short term movements spanning one or two days.
There is now double short term divergence between price and VIX. The divergence is clear and not slight. Inverted VIX moved higher again today, above the point it reached yesterday and also four days ago. Price has not made a corresponding new high. This divergence is bearish and indicates weakness today for upwards movement from price. It may be followed by one or two downwards days from price.
BREADTH – AD LINE
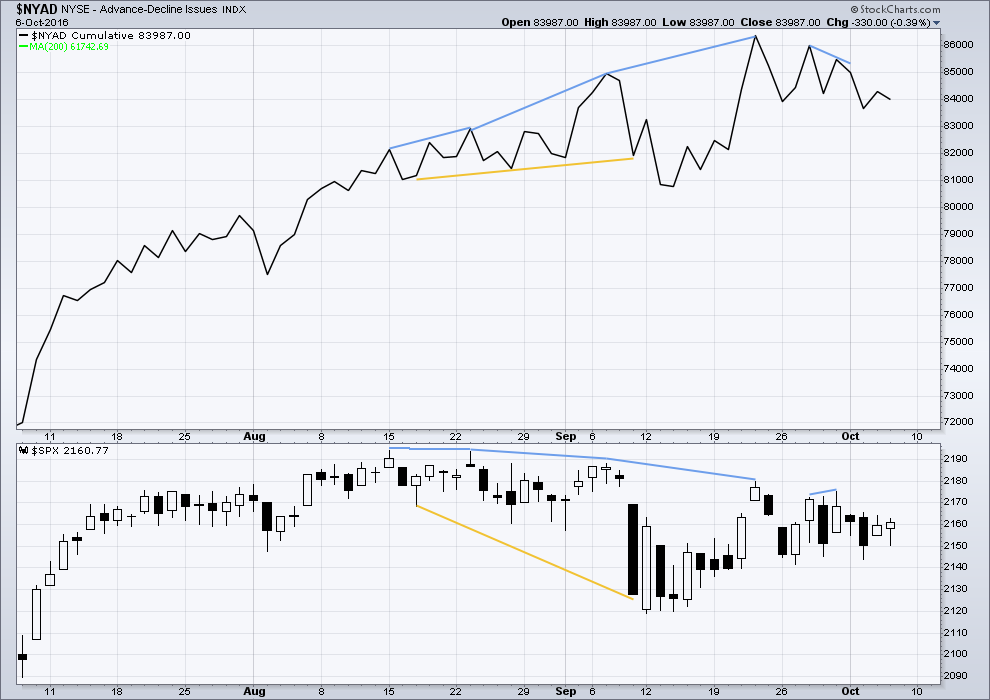
Click chart to enlarge. Chart courtesy of StockCharts.com.
There is support from market breadth as price is rising.
Short term bullish and bearish divergence is again working between price and the AD line to show the direction for the following one or two days.
There is no new short term divergence today between price and the AD line to indicate weakness.
DOW THEORY
Major lows within the old bull market:
DJIA: 15,855.12 (15th October, 2014) – closed below on 25th August, 2015.
DJT: 7,700.49 (12th October, 2014) – closed below on 24th August, 2015.
S&P500: 1,821.61 (15th October, 2014) – has not closed below this point yet.
Nasdaq: 4,117.84 (15th October, 2014) – has not closed below this point yet.
Major highs within the bear market from November 2014:
DJIA: 17,977.85 (4th November, 2015) – closed above on 18th April, 2016.
DJT: 8,358.20 (20th November, 2015) – has not closed above this point yet.
S&P500: 2,116.48 (3rd November, 2015) – closed above this point on 8th June, 2016.
Nasdaq: 5,176.77 (2nd December, 2015) – closed above this point on 1st August, 2016.
Dow Theory Conclusion: Original Dow Theory still sees price in a bear market because the transportations have failed to confirm an end to that bear market. Modified Dow Theory (adding S&P and Nasdaq) has failed still to confirm an end to the old bull market, modified Dow Theory sees price still in a bull market.
This analysis is published @ 10:35 p.m. EST.
Peter Temple of WCI is also seeing a b wave triangle in the current set-up. His overall count is somewhat different from Lara’s as he sees the current wave as four of five of an ending diagonal.
Remember EDs at their conclusion generally swiftly retrace to their point of origin. This implies quite a ride to the downside for the next move if that is what we are seeing. A rose by any other name…. 🙂
One of the things I learned from some very able traders was to build an arsenal of what they called “bread and butter” trades. These are particular set-ups, trading vehicles (like spreads for example) and/or wave structures with which one becomes very familiar over time, and offer favorable risk/reward ratios as a result of being fairly consistent in the way they play out. One great advantage of mastering a few set-ups is that you can trade somewhat larger lots with confidence and fewer sleepless nights (in my case usually hours! ). Triangles (and we have been seeing quite a few of those lately) are a great “bread and butter” trade as they are so predictable. The only problem is that you can never be absolutely certain which way they are going to break. You can be fairly certain however, that the break is going to be violent. They also tend to be continuation patterns, meaning the break is likely to continue the trend from which the triangle was entered. They are also typically the next to the last (penultimate) move in a wave structure, so usually show up in b and fourth waves.
Since the move out of the triangle is generally violent, even a conservative play like a straddle can still generate a good profit. In many instances, you can actually score a double whammy with a straddle( if you are nimble and attentive to the possibility), as the initial move will be a head-fake which is quickly reversed. Another great thing about triangles is that the next wave being the final wave in the movement, alerts you to getting ready for a trade on the impending trend change. What’s not to like?
Mr. Market is tossing us a nice fat triangle right over home plate. Hit it people! 🙂
Great post, and so true.
Hey Lara, I’m new here and wanted to ask if they’re was a trading strategy (spreads, options, futures, shares) that should be used? Also, is there a particular point in your analysis that we should start looking to enter trades? Thanks, love your analysis already.
I’m hesitant to offer trading advice very often. When I see what I consider a low risk high reward set up I’ll point it out.
If your preferred tool is futures then you’ll be needing the analysis to move along and reach targets within a specific time frame. My word of caution about that: I can try and make price predictions based on the EW count, but time is much harder. Waves don’t always have good proportions, and don’t always exhibit Fibonacci durations. Time is really quite a bit of guess work. So keep that in mind if trading futures.
I’m trading CFD’s on the S&P cash market, offered by my New Zealand broker. Most members here are trading futures. A few regularly hedge, and a few such as Verne are kind enough to share their trades real time.
At this stage I may choose to enter a small long position when intermediate (2) is over, if it unfolds as I expect. I’ll look to exit close to a new all time high. Then I’ll be looking to go short.
Great, thanks for the feedback. I appreciate your time and input. I will sit back and watch for now.
The triangle continues to meander sideways.
Now, if my labelling of this is wrong it may be that minute c still isn’t over. It may yet move higher. So to acknowledge that I’m leaving the upper triangle invalidation point at 2,175.30. That’s black and white, not grey there.
It’s possible today that minute c and d are over, that only a small zigzag up for minute e is required to complete the triangle. That could take one day, Monday, then Tuesday down for minor C to complete a big time consuming zigzag for intermediate (2).
If this is how it plays out (particularly the spike down for minor C) then I’ll have a good amount of confidence in this wave count.
The most common type of diagonal is contracting. So intermediate (3) should be shorter in both price and time than intermediate (1).
Then intermediate (4) should be shorter in both price and time than (2).
And finally a short zigzag up to complete intermediate (5) the shortest of all… then whomp.
I’m counting up the trading days left in October and thinking maybe this can end during this month. That’s a good month historically for big turns. And because many may be taking about it, I expect it will be completely rubbished as an idea by the mainstream.
But I’m getting a bit ahead of myself there….
I just had to turn the volume down on my TV as this cretin from Blackrock (Hildebrandt) corrected Tom Keene’s absolutely correct description of the artificially low interest rates being imposed on depositors by EU banks as “Financial Repression”. This swamp dweller insisted that negative interest rates were justified by “Excess Savings” which was leading to “under-investment” Excuse me??!!
In a world where global debt now exceed (by a lot) global GDP this moron is talking about “excess savings”???!! You mean to tell me all that liquidity that central banks dumped on wall street was not enough so that these thugs have to now resort to stealing from depositors? These people are worst than despicable. I simply cannot wait to see the whole stinking rotting mess go up in flames. BLK looks to me like a good short candidate. That doji printed on September 22 forms a perfect twin of the high on August 8 for a classic double top. It’s free money folk, and no wonder, with creatures like this at the helm…
ROTFL
“cretin”. Yep. That’s pretty much spot on isn’t it Verne.
I have an image of you now ranting at your TV…. and if I were there I suspect I’d be ranting right along side you.
I saw some discussion recently (on a local NZ website) of savers being redefined as “hoarders”, in part of a larger conversation about our property market bubble (which of course, isn’t a bubble because prices never go down you know).
I ranted at my computer over that one 🙂
Anybody noticing that monster opening bearish engulfing candle on the 15 min chart?
Look at the UNIT on that guy!! 🙂 🙂 🙂
LOL
Yep, that’s a big unit there.
Everyone is focused on Brexit and ignoring the real potential black swan of the EU, namely Italy. The Italians have figured out that they have been royally scammed by the Euro and will never be able to compete with Germany under a single currency. I would not be at all surprised if they formally leave the EU before the Brits do. Let’s see how the banksters deal with that!
It Doesn’t Matter… Bad News Doesn’t Matter! Bearish Engulfing Candle Doesn’t Matter! End of Wave V’s at all degrees Doesn’t Matter! Nothing Matters!
Equity Markets will continue to go higher forever… especially the US Markets! As per the Below reasoning!
The wave V ends have been extended multiple of times in the last 4 years or morphed into something else. Have they Not??? and you can make a case further back on that.
It sounds to me like you think EW analysis is dead…. 🙂
I am giving it one more month… then I am cancelling EWI & other stuff I subscribe to (I can throw darts as well & don’t need to pay for this stuff). I will only keep Lara active going forward into the future. That is because nobody else is as detailed at explaining this stuff on a day in & day out basis.
But you have to be honest… absolutely nothing is working or makes any sense anymore + that has been going on for a few years now. So 1st few days of Nov I cancel all.
I suspect at the end of a major bull market, turning into a bear, that we should see extreme underlying weakness. Which may look like nothing’s working.
But I don’t think the market is broken. I just think we need to be flexible in how we read it, and what used to be reliable signals will be so again.
This is an extreme top if my big picture EW analysis is correct; a fifth wave at cycle degree, within a fifth wave at Super Cycle degree, that’s huge.
That’s a once in a lifetime trend change. So things should look… really extreme. In this case, extremely wrong.
After great thought and analysis, I have reached a conclusion that the Equity Markets will continue to go higher forever… especially the US Markets!
This conclusion is NOT based on fundamentals or technical analysis… it’s based purely on the fact that the powers that be (Fed, Central Banks, US Govt., World Govts., the de-facto one world society government, etc., etc.) will use every means possible to continue to prop up equity markets forever with no more than 5% or so pull backs. That’s the reason why we continue to get these low volume slow grinds sideways to higher over time.
It will continue forever! The biggest PONZZI scheme ever … The Greater Fool Theory! … We live in a world with Billions of Fools who have yet to be drawn in. But they will and that is why Equity Markets will continue to go higher forever!
Bears are a thing of the past… now in hibernation permanently! The new dinosaurs!
Follow the above at your own risk! Another one of my vents!
At moment it certainly feels that way, we could be told the world is ending in a week and the market would rocket. There certainly seems a triangle is forming and when it breaks upwards seems the way it will go. Money is cheap and staying cheap and is being thrown at the markets because no one wants the carpet to be pulled under their watch. At some point reality has to hit and when it does the Bears will roar like they have never roared before. Will follow the analysis and ride as much of the trend up as I feel conformable and then just sit on the side lines. When it comes there will be plenty of time to join.
Sometimes doing nothing is the hardest thing
“At some point reality has to hit and when it does the Bears will roar like they have never roared before. ”
I have been making that play/bet for the last 4 Years now! It WON”T EVER HAPPEN!
Bears are a thing of the past… now in hibernation permanently! The new dinosaurs!
Equity Markets will continue to go higher forever… especially the US Markets! As per the above reasoning!
Paresh,
Completely agree. No sense fighting this trend. Join in, trade in and out, make some money and then wait to join again. I would be stinking rich if I got a dollar for every time experts and traders said that we are crashing. One thing we need to keep in mind is that the central banks may be close to running out of bullets but they can extend this by having fiscal stimulus. Global fiscal stimulus talks are happening and even the doom and gloom candidate Trump wants to double down on fiscal stimulus.
My suspicion is that although you may feel that way right now, deep down you don’t actually believe the market can or will go up in perpetuity, and I think I can prove it.
If you actually really and truly believed that, you would have gone out and liquidated everything you own and plowed the proceeds in the market for that would be the most logical course of action. I have a sneaking suspicion that you have done no such thing… 🙂
That is exactly how the majority feel at a top Joe.
Exactly.
The change from bull to bear is not usually clear. It’s the hardest shift to analyse. It often takes time. The S&P often forms slow rounding tops, and when the bear begins clearly it’s after a long slow topping process.
The length of that process is doing it’s job very well.
It’s job is to convince the vast majority of market participants that price will continue forever in the same direction.
I subscribe to the excellent Lowry’s service. They’ve been around for a very long time, they provide more accurate measurements of market breadth and strength.
They’re seeing what I’m seeing. A slow shift from an old bull market, into a new bear market.
But not yet. Selling pressure isn’t enough to begin a bear. There are some signs of short term strength (yes, weak relatively but improvement) to keep this thing going up for a while.
They could be wrong, it may be closer than we think. But at least we’re looking out for the change.
This bull market is very old and tired.
The BLS (Bureau of Lying Statistics) has a big problem. They have to publish an optimistic report to enhance Madam Hillary’s chances in November. This administration has turned lying into an art form so the numbers will continue to be “fantabulous”. It will however, put enormous pressure on the FED to raise rates if they publish a too positive, albeit entirely bogus jobs number. We also know very well what any hint of an impending rate is going to do to equities markets, and for all the reasons we have so frequently discussed here. Here’s hoping for a smashing jobs report!! 🙂 🙂 🙂
I know some of you are thinking about the one market maker that no one can defend against…yep!…the FED!
When you sell a naked put, you are obligated to buy the underlying asset if it is below the put’s strike price at expiration, hence, the infamous “Bernanke Put”, that kept an ever present bid under the market against any and all rational reasons for it not to tank. This is what traders and investors have been dealing with for the last seven years. If a market maker, in this case the FED, has virtually unlimited funds, no one can defend against an attack. The “Bernanke Put” has destroyed quite a few bears over the last seven years as the market continued to be irrational longer than they could be solvent. No wonder so many traders closed shop trying to trade a one-directional market. I have often wondered why some of these heavy hitters, once they figured out what was going on, did not simply go with the flow and stay long the market. If one had simply done that and walked away a few years ago you would be nicely in the green today, as opposed to imploding as so many hedge funds did. While some did adopt this strategy, hence BTFD, there were all kinds of technical and fundamental reasons to be suspicious of the market’s relentless advance, but here we are, more than seven years later, with social mood in the financial markets more than ever convinced of the invincibility of central banksters – despite all that is going on in the world, we are STILL very close to all time highs! Yet…nothing lasts forever…not even a “Bernanke Put”…! 🙂
So…after avoiding placing stops in the market, laddering into positions, and having a specific profit target for each trade and diligently ringing the register when it is hit, the final thing is defending a position under attack. Now just because you get stopped out of a trade does not mean a market maker or your brokerage is out to get you. There are things that suggest something fishy may be going on- sudden and unexpected spikes against a clearly established trend, especially when occurring close to options expiration, any move more than a few standard deviations from the trading range not clearly taking place at the beginning or end of an impulse wave, or any general movement in what you are trading that makes you go WTF!!!
What happened with the Euro on Wednesday was a classic example. I shorted the hell out of it as I knew exactly what those bottom feeders were up to. No doubt they ran quite a few stops as they thought short Euro was getting to be crowded trade.
To credibly defend trades you really need a good sized account (five figures at least and preferably six), so for some traders it won’t be something worth attempting.
I first stumbled on this entirely be serendipity. I later learned much more about it trading with Bryan Bottarelli’s group and witnessed some amazing dogfights with market makers in a fast options trading posse.
The serendipitous part was when a bear credit spread I was in all of a sudden just exploded in the wrong direction a few days just before expiration after being nicely in the green for weeks prior. Fortunately for me, I had been taught never to sell bearish spreads against an equity I was not willing to take assignment of if the trade went against me. This goes triply for selling naked puts which is an absolute “no – no” if you are not willing to be assigned the underlying asset. I was holding bearish credit spreads against a silver miner that I did not mind owning and so when the puts suddenly went deep into the money, I simply wired additional funds to my account in anticipation of being assigned the shares. To my utter amazement, whoever had shorted the stock (obvious in hindsight) sending those puts deep in the money covered in a hurry and “Viola!”, my spread was again instantly profitable. It was a stunning Eureka moment for me personally. This is why I like to ladder into trades. It will sometimes draw out some cretin trying to screw up the bid/ask and make it look like the trade has gone against you immediately. You get to the point where you can quickly spot this kind chicanery. Since I only sell spreads against stocks I don’t mind owning, when market makers attack the spread by trying to drive down the price I simply add to my position- again if it is clear that you are being ambushed. After you have burned ’em a few times when they pull that stunt they tend to leave your trades alone. More sophisticated traders will even use futures ( I don’t) in this strategy to keep their brokerages in line.
Another reason why a defense strategy must include a willingness to accept assignment is that sometimes even at the day of expiration market makers will offer ridiculous bids that in no way reflect the clear intrinsic value of the options. When you stun them by refusing to accept the candy-assed bid and take assignment instead they learn to respect your trades. They would do this to us a lot at Bottarelli Research and so we all started simply taking assignment and the market makers really cleaned up their act. This is clearly not for everyone, but if you have a reasonably sized account, you don’t always have to take the bull crap. Cheers! 🙂
Thank you very much Verne for this explanation!
I expect there may be a few members here who have accounts large enough to do this, and a few more who may one day also.
Most welcome!
Over the years a few master traders have generously shared a few tips and tricks and hopefully some of these ideas can help our members sharpen their skills. It’s a dangerous world out there… 🙂
woo hoo