
Upwards movement was expected for Wednesday’s session. This is what happened.
Summary: Classic technical analysis suggests more upwards movement tomorrow, but the preferred Elliott wave count requires downwards movement. If price makes a new high above 2,179.58, then expect upwards movement to continue to a target at 2,188. If price makes a new low tomorrow below 2,151.79, then expect downwards movement to continue to a target at 2,134.
Last monthly chart for the main wave count is here.
New updates to this analysis are in bold.
MAIN WAVE COUNT
WEEKLY CHART
Click chart to enlarge.
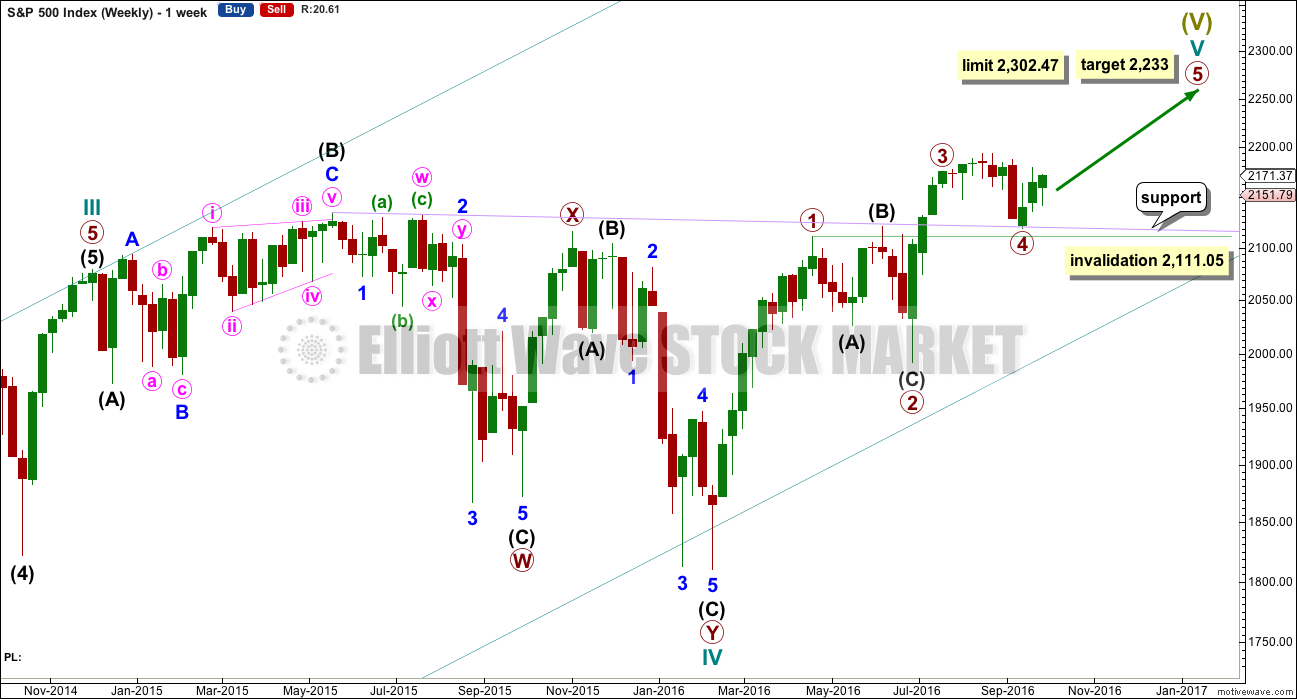
Cycle wave V must subdivide as a five wave structure. I have two wave counts for upwards movement of cycle wave V. This main wave count is presented first only because we should assume the trend remains the same until proven otherwise. Assume that downwards movement is a correction within the upwards trend, until proven it is not.
Primary wave 3 is shorter than primary wave 1, but shows stronger momentum and volume as a third wave normally does. Because primary wave 3 is shorter than primary wave 1 this will limit primary wave 5 to no longer than equality in length with primary wave 3, so that the core Elliott wave rule stating a third wave may not be the shortest is met. Primary wave 5 has a limit at 2,302.47.
Primary wave 2 was a shallow 0.40 expanded flat correction. Primary wave 4 may be exhibiting alternation as a more shallow combination.
Primary wave 4 may not move into primary wave 1 price territory below 2,111.05.
It is also possible to move the degree of labelling within cycle wave V all down one degree. It may be only primary wave 1 unfolding. The invalidation point for this idea is at 1,810.10. That chart will not be published at this time in order to keep the number of charts manageable. The probability that this upwards impulse is only primary wave 1 is even with the probability that it is cycle wave V in its entirety.
DAILY CHART
Click chart to enlarge.
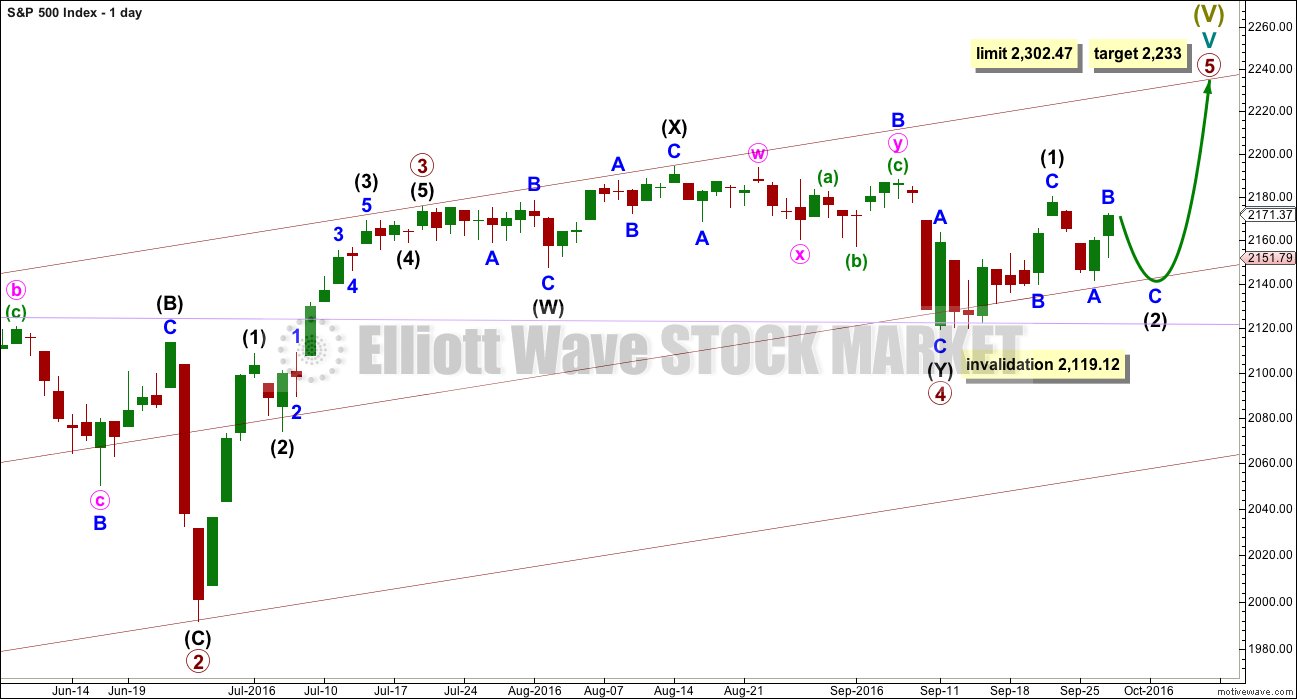
Primary wave 4 may be now complete as a double combination.
It is possible now that primary wave 4 could continue further as a triple, but because triples are very rare the probability of this is very low. If it is over here, then the proportion with primary wave 2 looks right. Within primary wave 5, no second wave correction may move beyond the start of its first wave below 2,119.12.
Primary wave 1 lasted 47 days, primary wave 2 was even in duration at 47 days, primary wave 3 lasted 16 days, and primary wave 4 has lasted 37 days. The proportions between these waves are acceptable.
If primary wave 5 has begun here, then at 2,233 it would reach 0.618 the length of primary wave 1.
At this stage, an impulse for primary wave 5 looks unlikely with invalidation of that idea at the hourly chart level. An ending diagonal now looks more likely for primary wave 5. Ending diagonals are choppy overlapping structures. The classic technical analysis equivalent is a rising wedge. They are terminal structures, doomed to full retracement at their end.
If primary wave 5 comes up to touch the upper edge of the maroon channel, it may end there.
HOURLY CHART
Click chart to enlarge.
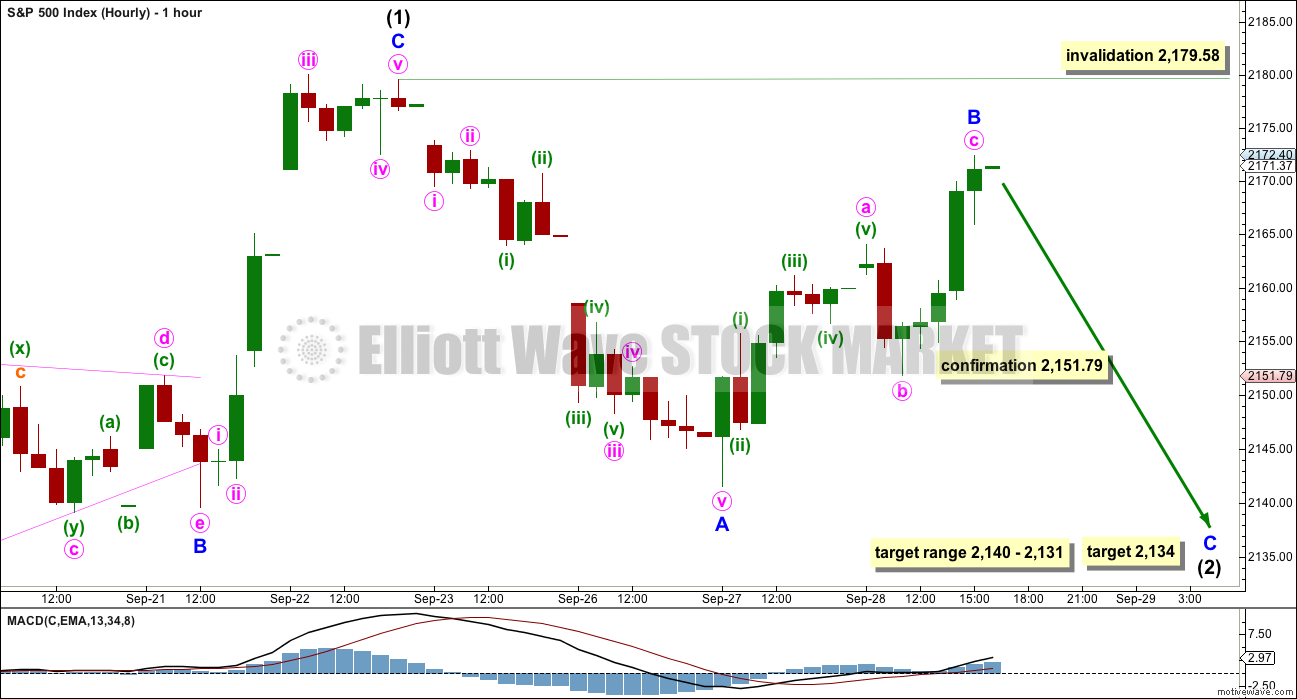
If primary wave 5 is subdividing as an ending diagonal, then all sub-waves must subdivide as zigzags. Intermediate wave (1) may be a completed zigzag.
Second and fourth waves within diagonals have a normal depth of from 0.66 to 0.81 the prior wave. This gives a target range for intermediate wave (2) from 2,140 to 2,131.
Intermediate wave (2) must subdivide as a zigzag. It may not move beyond the start of intermediate wave (1) below 2,119.12.
Intermediate wave (1) lasted a Fibonacci eight days.
Intermediate wave (2) may be just over half way through and has so far lasted four days. It may continue for another four if it is even in duration with intermediate wave (1) and exhibits a Fibonacci number of eight days.
Intermediate wave (2) should be expected to be a big obvious three wave structure. So far minor wave B shows at the daily chart level as two green daily candlesticks. Minor wave B may not move beyond the start of minor wave A above 2,179.58.
Minor wave B now looks like a completed zigzag. It is now most likely to be over here, if this hourly wave count is correct. Minute wave c is 1.8 points short of equality in length with minute wave a.
At 2,134 minor wave C would reach equality in length with minor wave A. This target is within the range of 2,140 – 2,131.
SECOND HOURLY CHART

Click chaIIrt to enlarge.
There was support today for upwards movement from volume, and this suggests another green daily candlestick tomorrow. If that happens, then what would the Elliott wave count look like and what is the probability?
It is possible that intermediate wave (1) ended at the high for 22nd of September and did not have a truncated fifth wave. This wave count avoids a truncation (which the first hourly chart has) which slightly increases its probability.
If intermediate wave (2) was over at the last swing low, then it will subdivide as a zigzag, but it does not look like a big obvious three wave structure at the daily chart level because it is too brief and straight. This reduces the probability by a reasonable amount.
Intermediate wave (2) would be just above the normal depth of 0.66 to 0.81 of intermediate wave (1), and it is only 0.63. This is not too far from normal, so it only reduces the probability of this idea by a little.
If the first hourly chart is invalidated tomorrow with a new high above 2,179.58, then this second idea may be considered confirmed. At that stage, intermediate wave (3) may be expected to be underway.
Within intermediate wave (3), at 2,188 minor wave C would reach 1.618 the length of minor wave A. This target would see intermediate wave (3) shorter than intermediate wave (1), so the diagonal would be contracting. Contracting diagonals are more common than expanding.
At 2,202.42 intermediate wave (3) would reach equality in length with intermediate wave (1). It is likely to end before this point because contracting diagonals are more common than expanding diagonals.
Within minor wave C, no second wave correction may move beyond the start of its first wave below 2,151.79.
ALTERNATE WAVE COUNT
WEEKLY CHART
Click chart to enlarge.
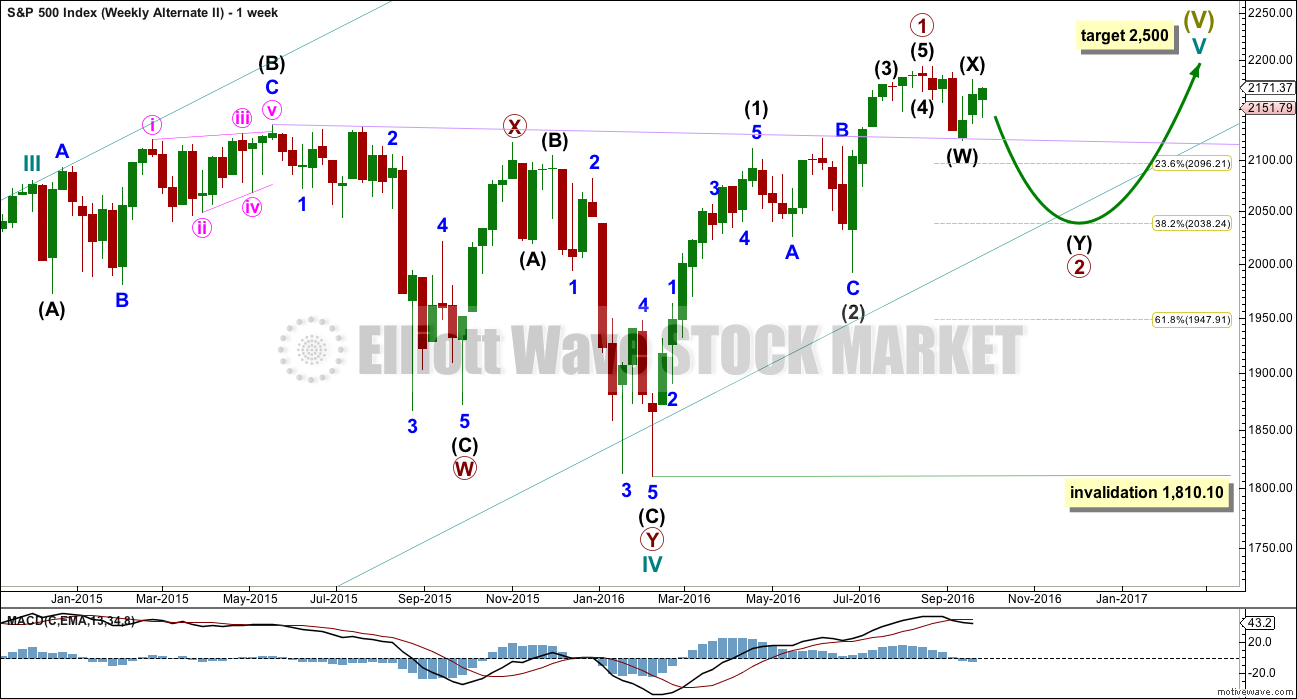
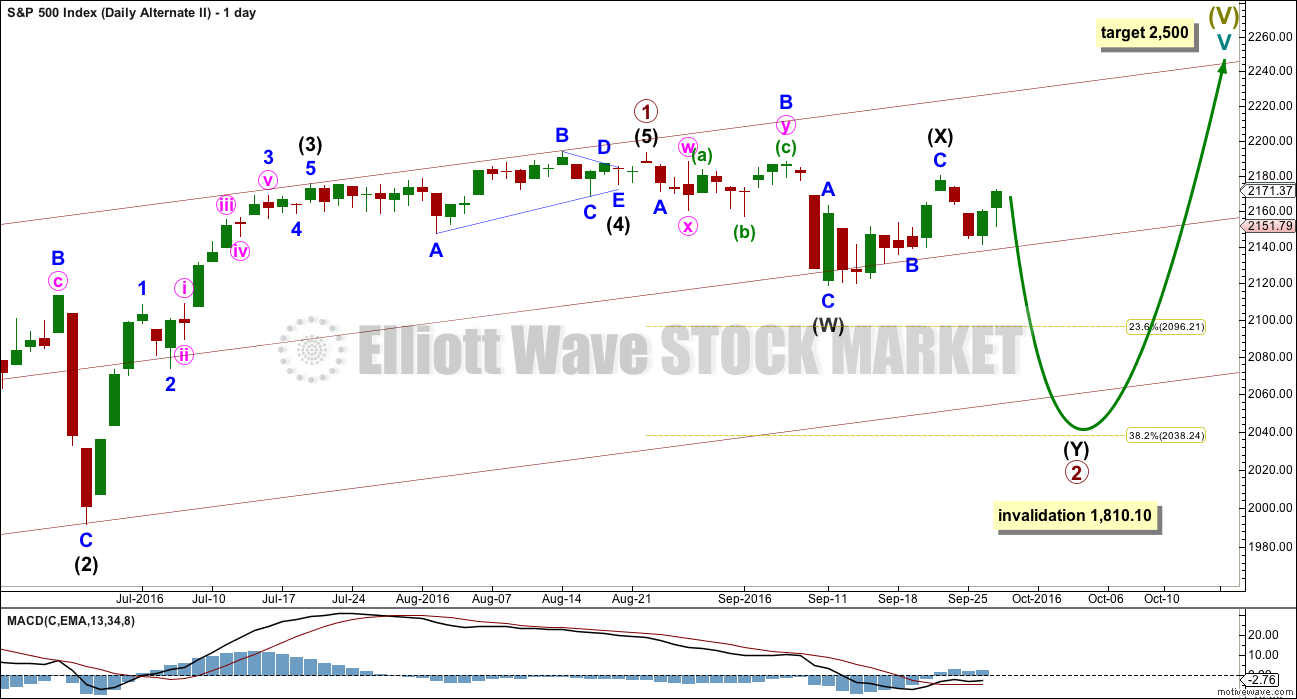
What if an impulse upwards is complete? The implications are important. If this is possible, then primary wave 1 within cycle wave V may be complete.
With downwards movement from the high of primary wave 1 now clearly a three and not a five, the possibility that cycle wave V and Super Cycle wave (V) are over has substantially reduced. This possibility would be eliminated if price can make a new all time high above 2,193.81.
If an impulse upwards is complete, then a second wave correction may be unfolding for primary wave 2. Expectations on how deep primary wave 2 is likely to be are now adjusted. It may be expected now to more likely only reach the 0.382 Fibonacci ratio about 2,038.
At this stage, it looks like price has found strong support at the lilac trend line.
Primary wave 2 may not move beyond the start of primary wave 1 below 1,810.10.
DAILY CHART
Click chart to enlarge.
If an impulse upwards is complete, then how may it subdivide and are proportions good?
Intermediate wave (1) was an impulse lasting 47 days. Intermediate wave (2) was an expanded flat lasting 47 days. Intermediate wave (3) fits as an impulse lasting 16 days, and it is 2.04 points short of 0.618 the length of intermediate wave (1). So far this alternate wave count is identical to the main wave count (with the exception of the degree of labelling, but here it may also be moved up one degree).
Intermediate wave (4) may have been a running contracting triangle lasting 22 days and very shallow at only 0.0027 the depth of intermediate wave (3). At its end it effected only a 0.5 point retracement. There is perfect alternation between the deeper expanded flat of intermediate wave (2) and the very shallow triangle of intermediate wave (4). All subdivisions fit and the proportion is good.
Intermediate wave (5) would be very brief at only 18.29 points. Intermediate wave (5) is 1.43 points longer than 0.056 the length of intermediate wave (1).
At this stage, primary wave 2 now has a completed zigzag downwards that did not reach the 0.236 Fibonacci ratio. It is very unlikely for this wave count that primary wave 2 is over there; the correction is too brief and shallow. Upwards movement labelled intermediate wave (X) is so far less than 0.9 the length of the prior wave down labelled intermediate wave (W). The minimum for a flat correction has not been met. Primary wave 2 may continue lower as a double zigzag. A second zigzag in the double may be required to deepen the correction closer to the 0.382 Fibonacci ratio.
Intermediate wave (W) lasted a Fibonacci 13 sessions. Intermediate wave (X) has now lasted a Fibonacci eight sessions. If intermediate wave (Y) is equal in duration with intermediate wave (W), that would give the wave count a satisfying look.
Primary wave 2 may not move beyond the start of primary wave 1 below 1,810.10. A new low below this point would see the degree of labelling within cycle wave V moved up one degree. At that stage, a trend change at Super Cycle degree would be expected and a new bear market to span several years would be confirmed.
HOURLY CHART
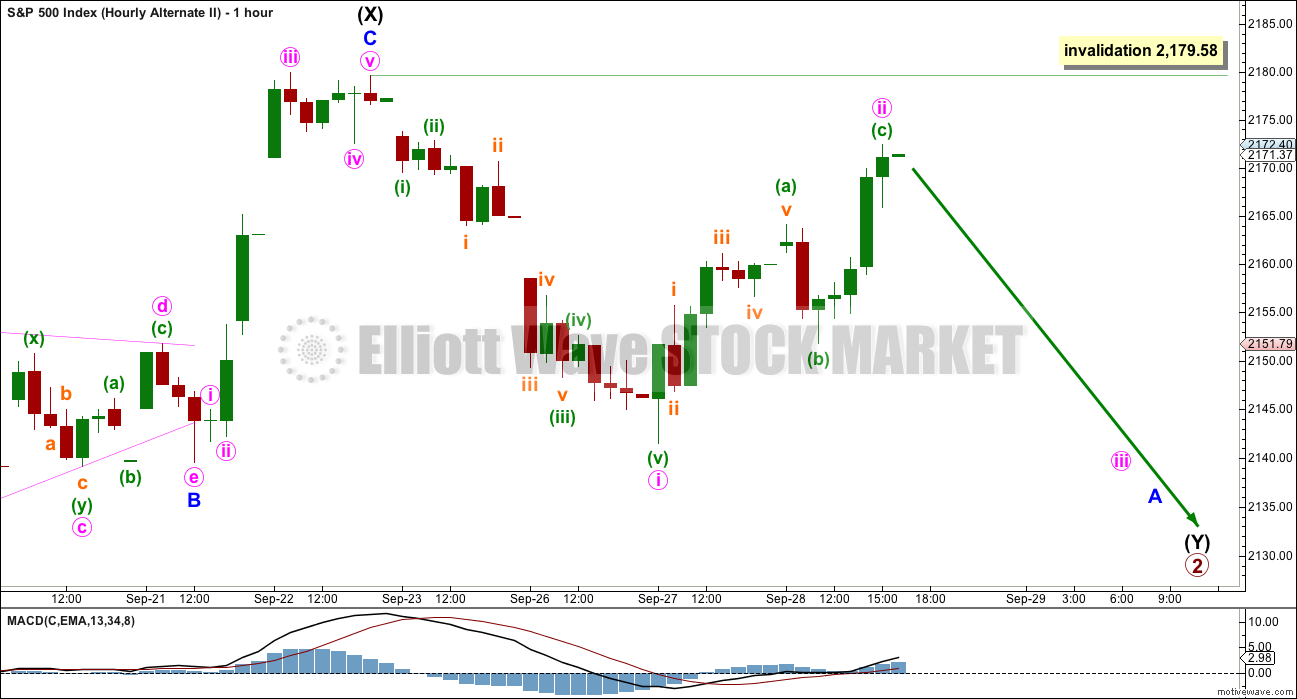
Click chart to enlarge.
This wave count now expects downwards movement for a Fibonacci 13 sessions overall most likely, to end about 2,038.
TECHNICAL ANALYSIS
WEEKLY CHART
Click chart to enlarge. Chart courtesy of StockCharts.com.
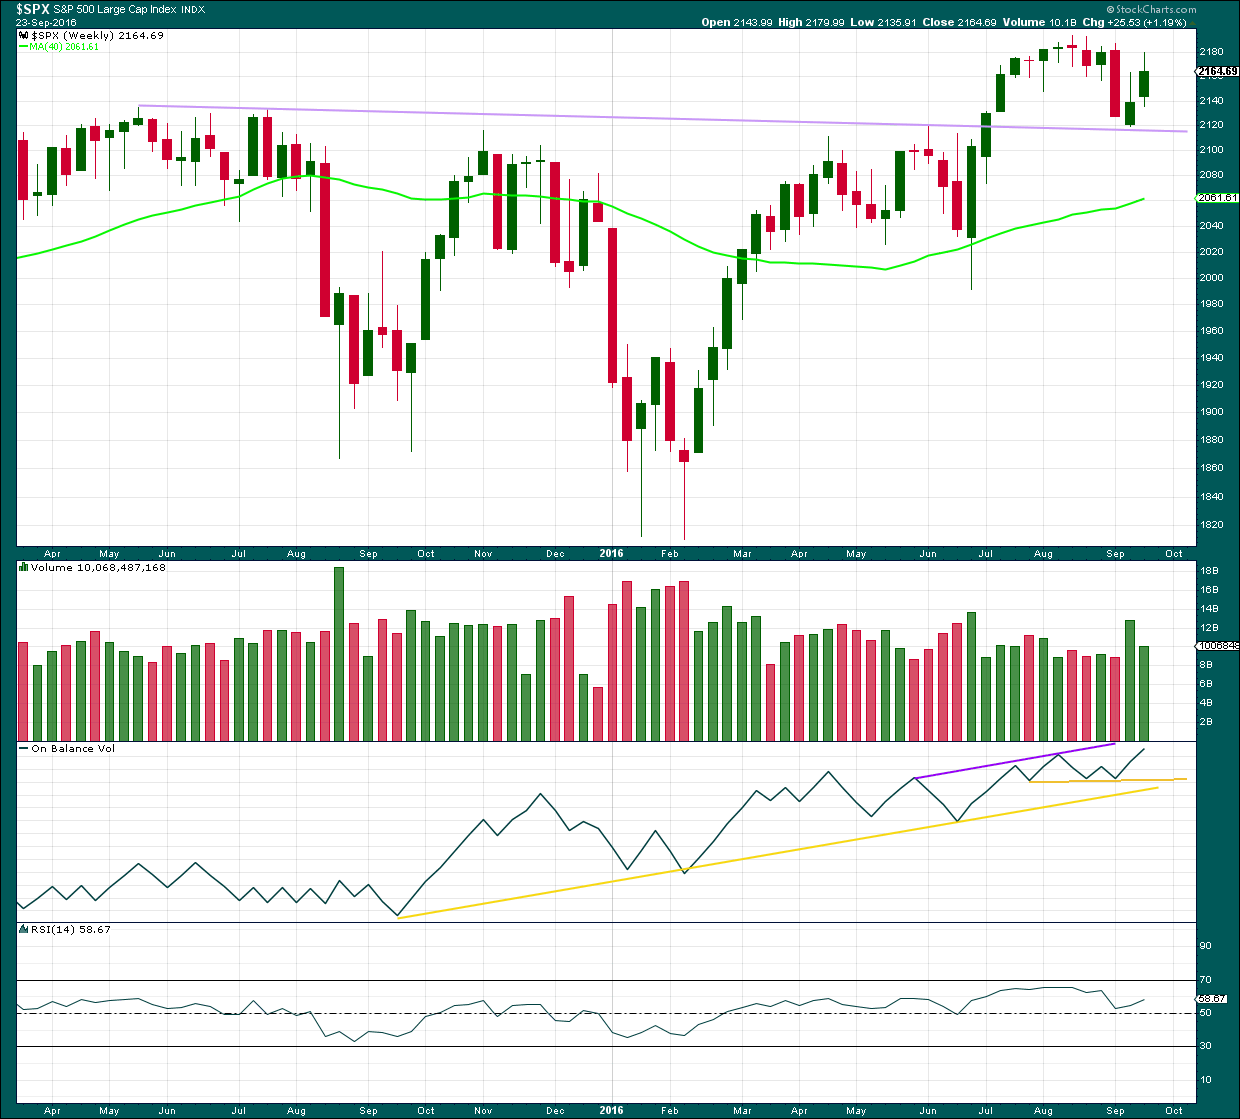
The lilac trend line has provided very strong support whereas previously provided strong resistance. The strength of this line is reinforced. If price turns down from here, it should be again expected to provide support. A break below it would be a strong bearish signal.
Price broke above the long term lilac trend line in July 2016. The low two weeks ago almost perfectly found support at this line, and now price is moving up and away from the line. This looks like a typical breakout followed by a back test for support. It is a reasonable conclusion that price will move further up and away from this line. This view is in alignment with the main Elliott wave count.
On Balance Volume has made a new high above the high for the week of the 6th of August, but price has failed to make a corresponding new high. This divergence is bearish and indicates weakness in price. It does not say that price must turn down from here, only that price is weak. The bull market is unhealthy.
RSI is not extreme. There is room for price to rise further. There is no divergence between RSI and price at the weekly chart level to indicate weakness.
DAILY CHART
Click chart to enlarge. Chart courtesy of StockCharts.com.
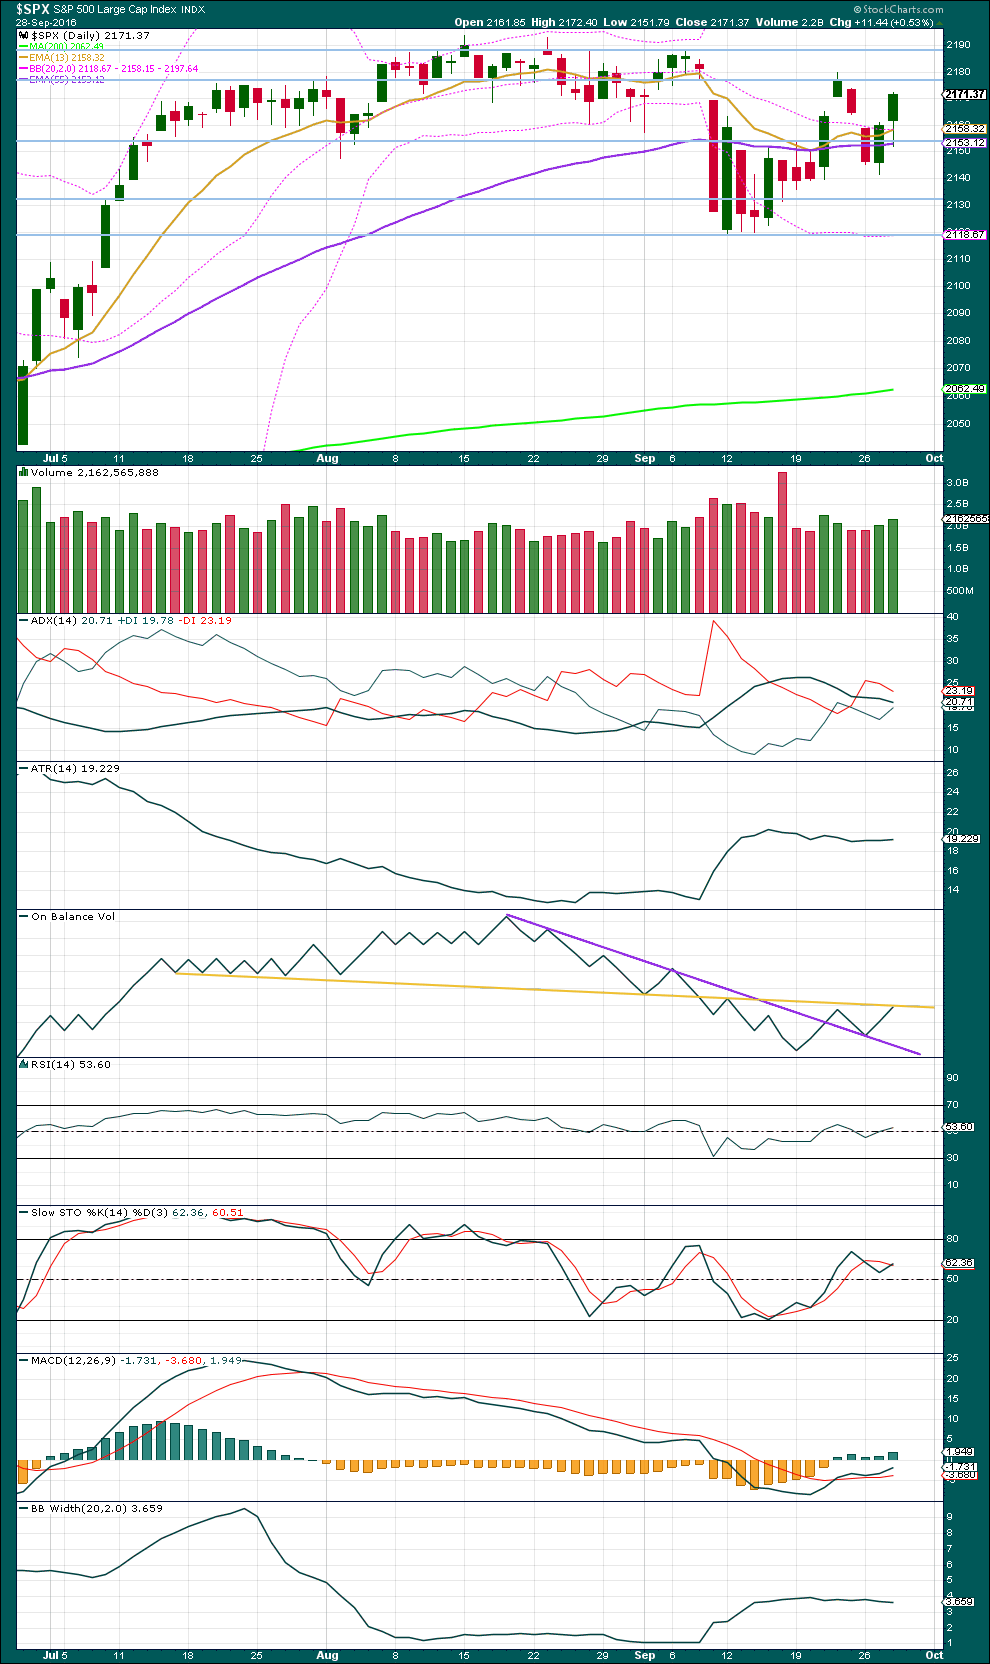
Price has moved higher on increasing volume for two days in a row now. Volume for these two upwards days is stronger than the prior two downwards days, so the rise in price is supported by volume. Wednesday’s long lower wick is bullish. This suggests that more upwards movement may follow, so another green daily candlestick would be a reasonable expectation here. This supports the second hourly Elliott wave chart and not the first.
ADX is declining, indicating the market is not trending. ATR is flat to declining, in agreement with ADX. Bollinger Bands have widened but are now remaining steady. This market is not trending. This market is consolidating.
Within this long consolidation, which began back on about 11th of July, it is three downwards days thay have strongest volume. This suggests a downwards breakout is more likely than upwards. This trick may or may not work for the S&P at this time. It is one piece of evidence to weigh up. This consolidation is bounded by resistance at 2,190 and support at 2,120.
On Balance Volume has now come up to touch the upper yellow resistance line. It may be expected to stop here, so this may halt the rise in price. This supports the first hourly Elliott wave chart over the second.
RSI is still close to neutral. There is plenty of room for price to rise or fall.
Stochastics has not yet reached overbought. Overall, a continuation of an upwards swing within this consolidation may be expected until price finds resistance and Stochastics reaches overbought at the same time.
There are three moving averages on this chart: a short term Fibonacci 13 days (gold), a mid term Fibonacci 55 days (purple), and a long term 200 days (lime). Both the mid and long term averages are still pointing up, and the mid term average is above the long term average. The longer term trend should be assumed to be up, until these averages prove it is not. The short term average has come down to kiss the mid term average and today it remains above the mid term average. The short term trend is fluctuating, exactly as expected within a consolidating market.
VOLATILITY – INVERTED VIX CHART
Click chart to enlarge. Chart courtesy of StockCharts.com.
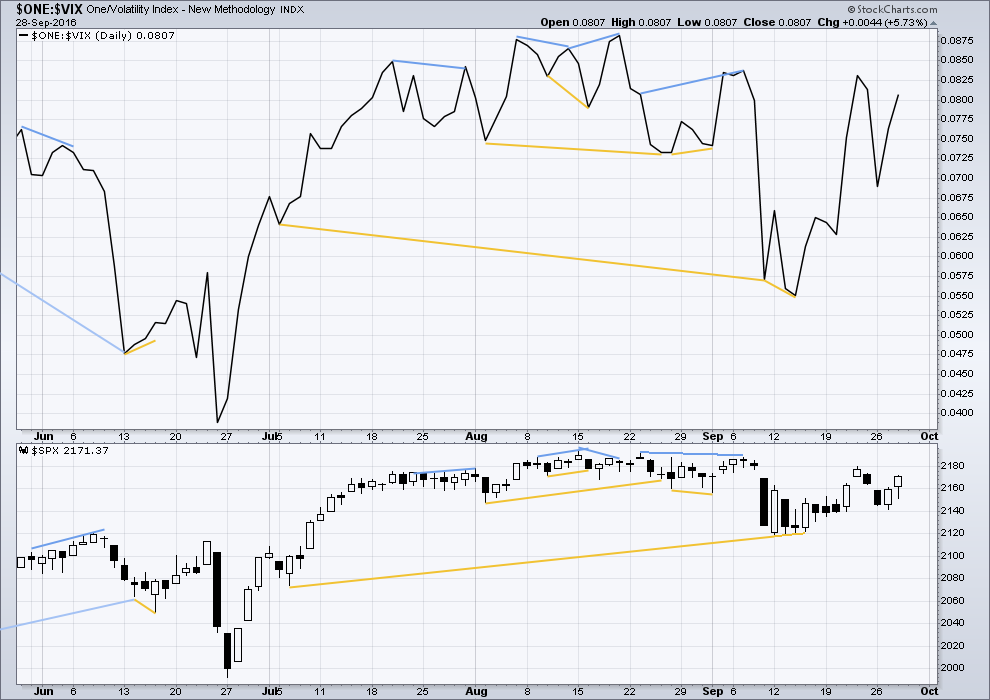
There are a few instances of multi day divergence between price and inverted VIX noted here. Bearish divergence is blue. Bullish divergence is yellow. It appears so far that divergence between inverted VIX and price is again working to indicate short term movements spanning one or two days.
At this stage, no further short term divergence is noted between price and VIX to indicate any weakness either way.
BREADTH – AD LINE
Click chart to enlarge. Chart courtesy of StockCharts.com.
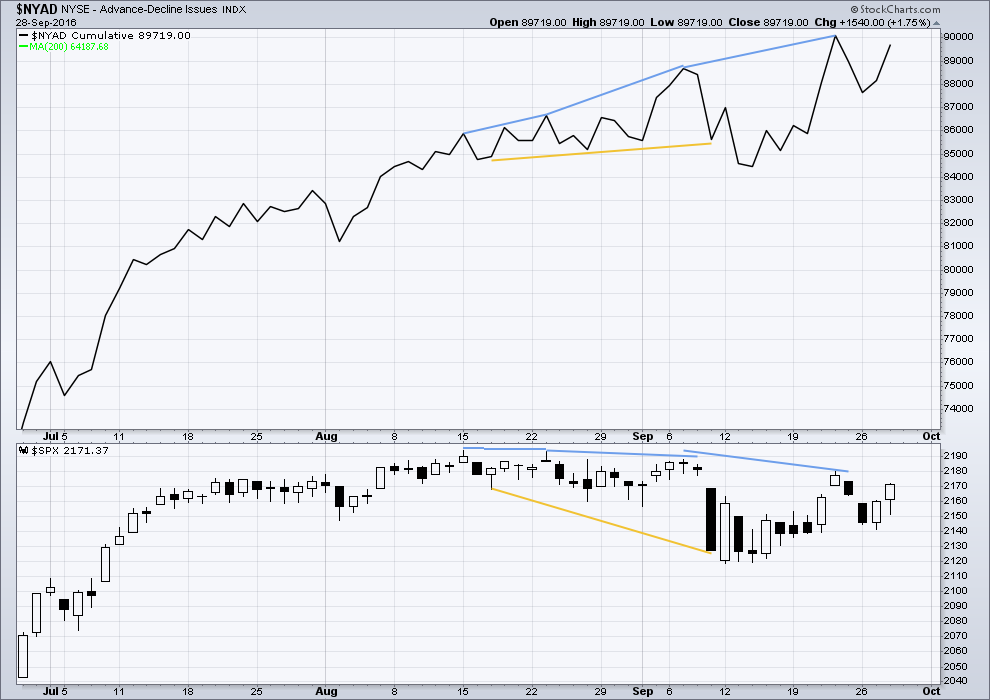
There is support from market breadth as price is rising.
Short term bullish and bearish divergence is again working between price and the AD line to show the direction for the following one or two days.
No short term divergence between price and the AD line is noted today.
DOW THEORY
Major lows within the old bull market:
DJIA: 15,855.12 (15th October, 2014) – closed below on 25th August, 2015.
DJT: 7,700.49 (12th October, 2014) – closed below on 24th August, 2015.
S&P500: 1,821.61 (15th October, 2014) – has not closed below this point yet.
Nasdaq: 4,117.84 (15th October, 2014) – has not closed below this point yet.
Major highs within the bear market from November 2014:
DJIA: 17,977.85 (4th November, 2015) – closed above on 18th April, 2016.
DJT: 8,358.20 (20th November, 2015) – has not closed above this point yet.
S&P500: 2,116.48 (3rd November, 2015) – closed above this point on 8th June, 2016.
Nasdaq: 5,176.77 (2nd December, 2015) – closed above this point on 1st August, 2016.
Dow Theory Conclusion: Original Dow Theory still sees price in a bear market because the transportations have failed to confirm an end to that bear market. Modified Dow Theory (adding S&P and Nasdaq) has failed still to confirm an end to the old bull market, modified Dow Theory sees price still in a bull market.
This analysis is published @ 09:55 p.m. EST.
[Note: Analysis is public today for promotional purposes. Member comments and discussion will remain private.]
Nice. The Elliott wave count was the guide, classic TA (daily volume anyway) not. Now if only that was always the case…. but nope. It’s not.
Now at least one more downwards day is expected. Maybe three if intermediate (2) is a Fibonacci 8 sessions.
I don’t want to get complacent here, so after some time staring at charts I’m going to try and come up with an alternate. What if I’m wrong? What else could be happening here?
So far this wave count is the last one standing. When that happens often I just stick with it, only to find it was wrong later on. I hate that. I prefer to be right 🙂
Second hourly count invalidated and trend down at least at minor degree confirmed. The pivots should in my opinion be tested and will probably hold to complete minor C of intermediate two of ED. If the pivots do not hold, it probably means the DB virus has begun to spread and will quickly consume the host…
Yes, it looks like a massive crash is just around the corner doesn’t it.
DB is crashing. That fear will spread, and when it does the banksters won’t be able to hold it back (LOL autocorrect keeps changing banksters to banisters)
Nice to see you back Verne! You were missed yesterday 🙂
Thanks Lara! Missed you guys as well. The next few weeks are going to be hectic with some family matters but will try to pop in now and then when things get exciting! 🙂
Okay, no worries. Thanks for letting me know, otherwise I may have become worried about you 🙂
Vern, you were wondering why there wasn’t a run on DB?
Well, it’s here, big time.
The size of DB dwarfs LEH, with much more international scope. Should be a heck of a crash.
Hedge Funds pulling assets and Cash out of Deutsche Bank… Counter Party Risk is rising!
The “Bubble ” is about to POP!
Several Cards pulled from the interior of the House of Cards!
What Counter Party of DB will POP 1st?
Hello everybody,
my last post has been placed on “waiting for moderation”.
This means that I probably posted something offending in the past, otherwise there wouldn’t be a “waiting for moderation” filter on my posts…
Should this has been the case, please accept my apologizes, I never ever wanted to offend someone. I tried, from my own perspective , to take part in this group, but I am probably considered not experienced enough to deserve the right to collaborate.
Therefore this is my last post, take care you all, has been nice (for me) to read all your comments.
Take great care , farewell
Posts with more than one link are automatically placed in moderation. It’s a standard filter to block spam.
No apologies needed Eric and please do keep posting. I so appreciate hearing another perspective and have read your posts with interest. Lara will occasionally edit or delete some comments she deems inappropriate but that should not be take at all personally. It rarely happens and the forum is egalitarian as they come.
Spillover from Deutsche Bank to globally systemically important banks: look at that chart…if DB breaks down…its a black hole effect…
http://www.cnbc.com/2016/09/28/deutsche-bank-crisis-explained.html
Lara,
What is difference between your first hourly chart and second hourly chart? They looks same picture.
Sorry David, my code was wrong.
It’s fixed now.
What was showing in the body of the analysis was the same. What you got if you clicked on it was different.