
Upwards movement was expected for Tuesday’s session. This is what happened.
Summary: The next two or three sessions may be very choppy and overlapping. Support from volume suggests overall upwards movement tomorrow. The target for the mid term remains at 2,233.
Last monthly chart for the main wave count is here.
New updates to this analysis are in bold.
MAIN WAVE COUNT
WEEKLY CHART
Click chart to enlarge.
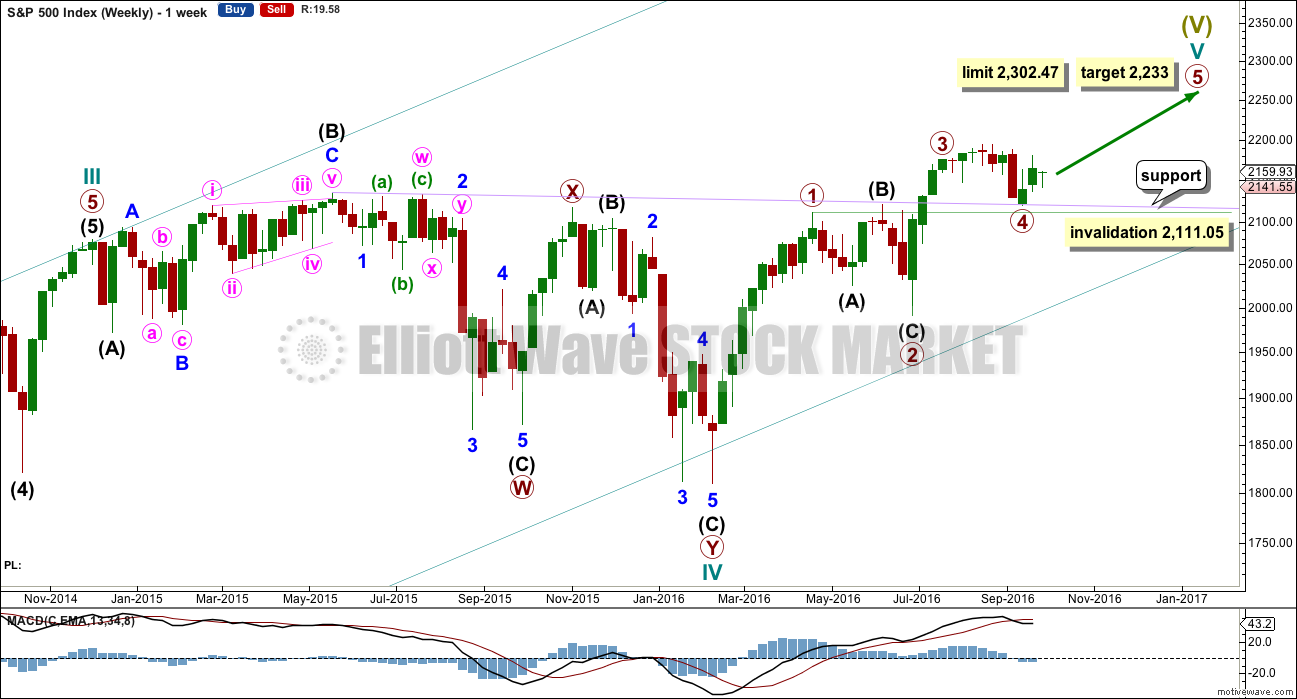
Cycle wave V must subdivide as a five wave structure. I have two wave counts for upwards movement of cycle wave V. This main wave count is presented first only because we should assume the trend remains the same until proven otherwise. Assume that downwards movement is a correction within the upwards trend, until proven it is not.
Primary wave 3 is shorter than primary wave 1, but shows stronger momentum and volume as a third wave normally does. Because primary wave 3 is shorter than primary wave 1 this will limit primary wave 5 to no longer than equality in length with primary wave 3, so that the core Elliott wave rule stating a third wave may not be the shortest is met. Primary wave 5 has a limit at 2,302.47.
Primary wave 2 was a shallow 0.40 expanded flat correction. Primary wave 4 may be exhibiting alternation as a more shallow combination.
Primary wave 4 may not move into primary wave 1 price territory below 2,111.05.
It is also possible to move the degree of labelling within cycle wave V all down one degree. It may be only primary wave 1 unfolding. The invalidation point for this idea is at 1,810.10. That chart will not be published at this time in order to keep the number of charts manageable. The probability that this upwards impulse is only primary wave 1 is even with the probability that it is cycle wave V in its entirety.
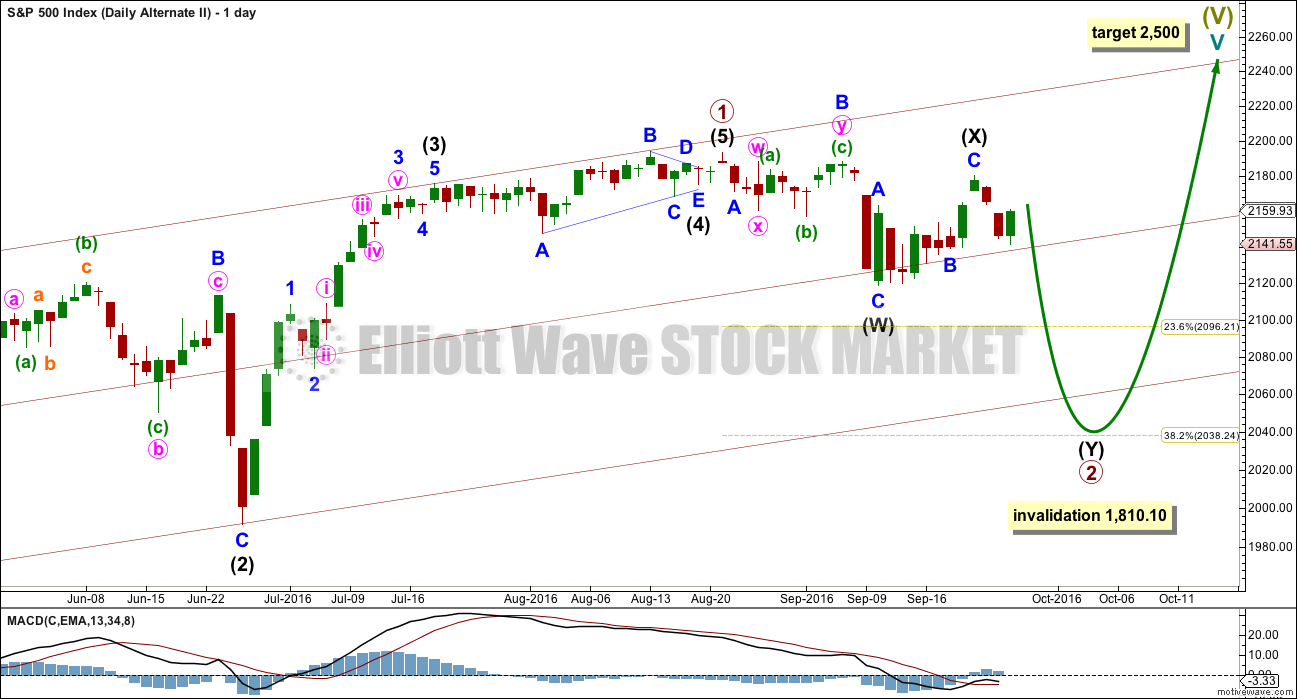
DAILY CHART
Click chart to enlarge.
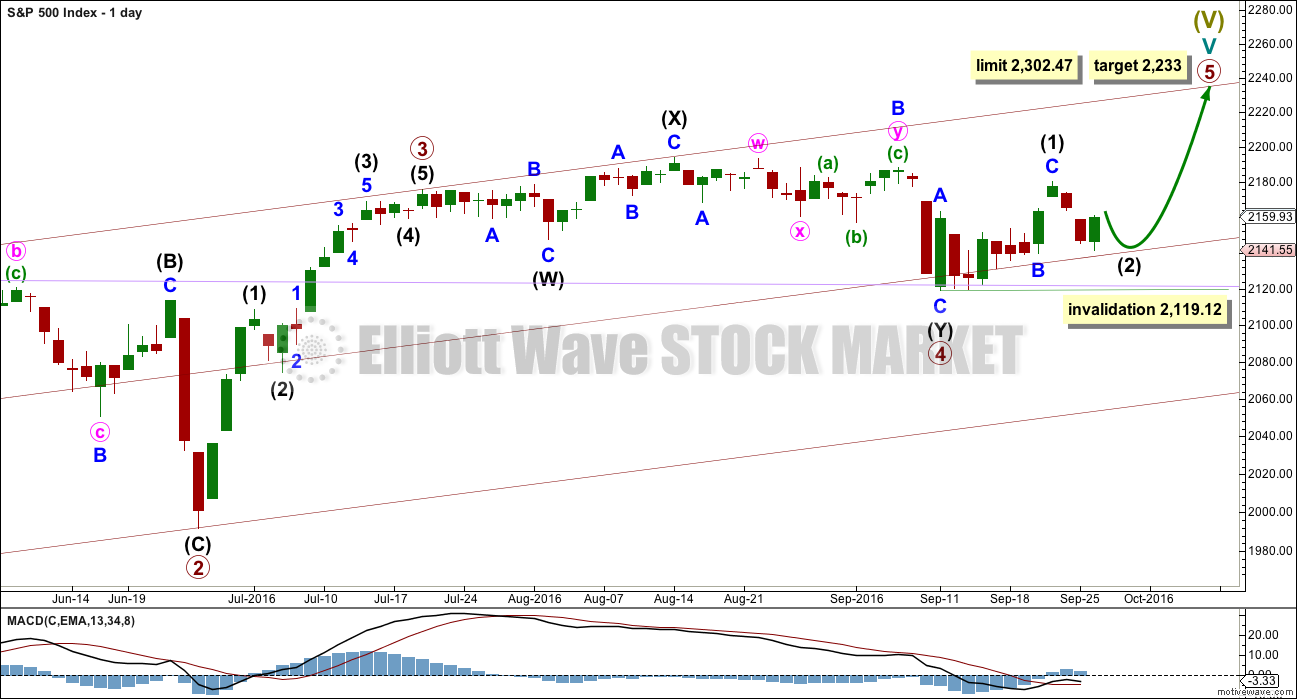
Primary wave 4 may be now complete as a double combination.
It is possible now that primary wave 4 could continue further as a triple, but because triples are very rare the probability of this is very low. If it is over here, then the proportion with primary wave 2 looks right. Within primary wave 5, no second wave correction may move beyond the start of its first wave below 2,119.12.
Primary wave 1 lasted 47 days, primary wave 2 was even in duration at 47 days, primary wave 3 lasted 16 days, and primary wave 4 has lasted 37 days. The proportions between these waves are acceptable.
If primary wave 5 has begun here, then at 2,233 it would reach 0.618 the length of primary wave 1.
At this stage, an impulse for primary wave 5 looks unlikely with invalidation of that idea at the hourly chart level. An ending diagonal now looks more likely for primary wave 5. Ending diagonals are choppy overlapping structures. The classic technical analysis equivalent is a rising wedge. They are terminal structures, doomed to full retracement at their end.
If primary wave 5 comes up to touch the upper edge of the maroon channel, it may end there.
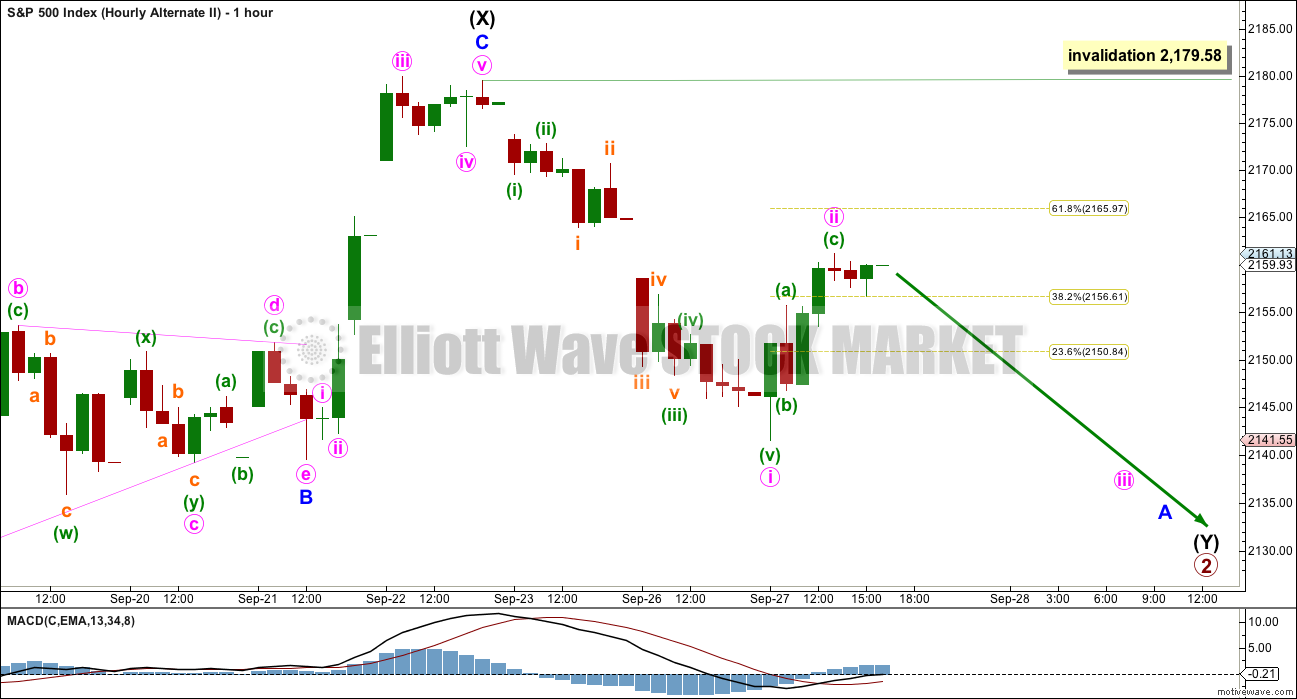
HOURLY CHART
Click chart to enlarge.
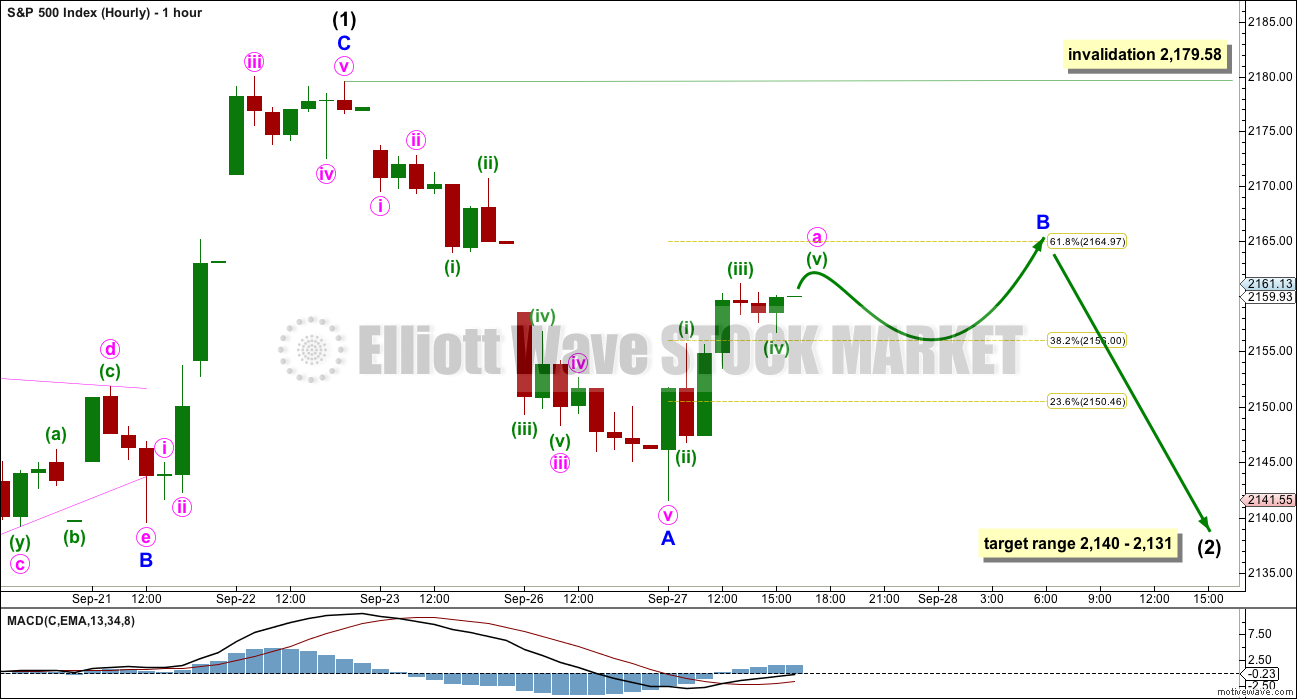
If primary wave 5 is subdividing as an ending diagonal, then all sub-waves must subdivide as zigzags. Intermediate wave (1) may be a completed zigzag.
Second and fourth waves within diagonals have a normal depth of from 0.66 to 0.81 the prior wave. This gives a target range for intermediate wave (2) from 2,140 to 2,131.
Intermediate wave (2) must subdivide as a zigzag. It may not move beyond the start of intermediate wave (1) below 2,119.12.
Intermediate wave (1) lasted a Fibonacci eight days.
Intermediate wave (2) may be expected to last either a Fibonacci five or eight days for the proportions of this wave count to have the right look, with five the first expectation. So far it has lasted three, so it may end in two more sessions or six more sessions.
Intermediate wave (2) should be expected to be a big obvious three wave structure. So far minor wave B shows at the daily chart level as one green daily candlestick. Minor wave B may not move beyond the start of minor wave A above 2,179.58.
Minor wave B may be any one of more than 23 possible corrective structures.
So far, within minor wave B, it looks like a five up may be almost complete. This may be minute wave a of a larger zigzag. Minute wave b may unfold tomorrow. Minute wave b may be any one of more than 23 possible corrective structures, and B waves within B waves are commonly complicated and sometimes quite time consuming. When minute wave b is complete, then minute wave c upwards may unfold to complete minor wave B if it is a zigzag.
Alternatively, minor wave B may be unfolding as a flat correction. A three up may be complete and tomorrow may see a deep wave down for minute wave b.
Minor wave B may also be unfolding as a combination. The first structure may be a complete zigzag. The second structure may unfold as a sideways flat or triangle.
Finally, it is possible that minor wave B is over as a quick sharp zigzag that ended at today’s high. This is possible, but for the wave count to have better proportions it is my judgement that the probability is lower than minor wave B continuing further.
When minor wave B is complete, then minor wave C downwards should unfold ending within the target range. When minor wave B is complete and the start of minor wave C is known, then the ratio between minor waves A and C may be used to calculate a target within the zone. That cannot be done yet.
ALTERNATE WAVE COUNT
WEEKLY CHART
Click chart to enlarge.
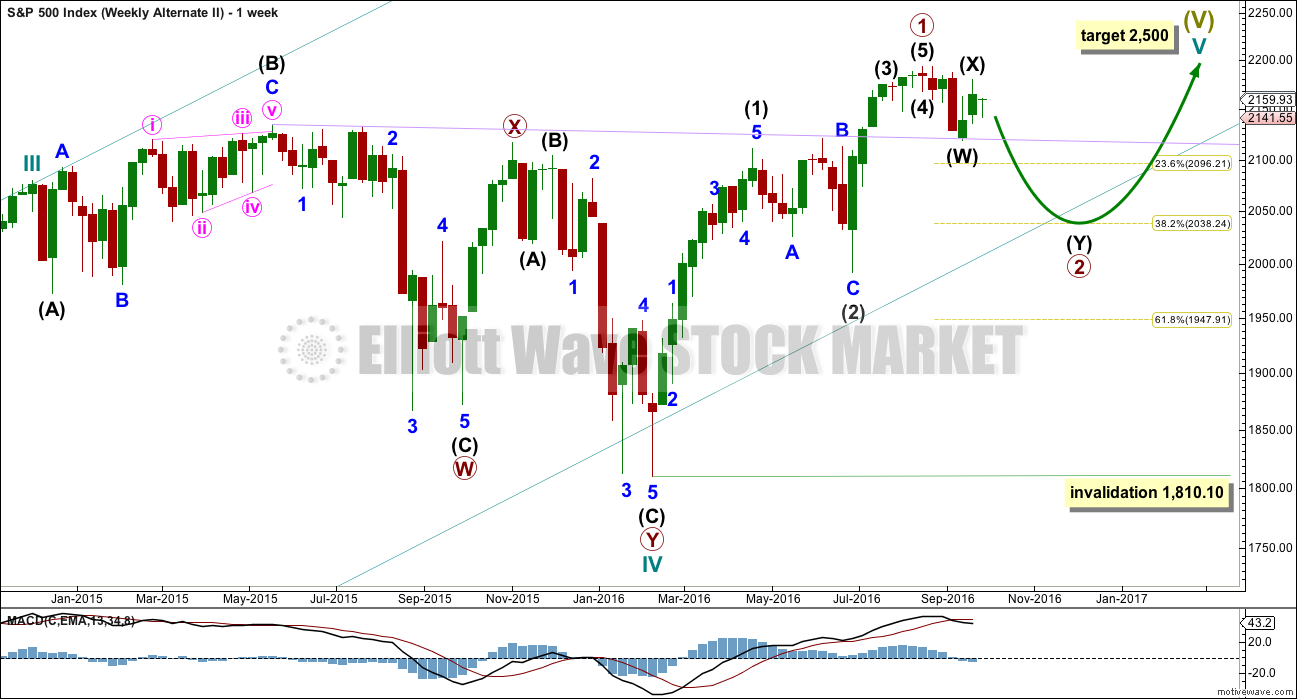
What if an impulse upwards is complete? The implications are important. If this is possible, then primary wave 1 within cycle wave V may be complete.
With downwards movement from the high of primary wave 1 now clearly a three and not a five, the possibility that cycle wave V and Super Cycle wave (V) are over has substantially reduced. This possibility would be eliminated if price can make a new all time high above 2,193.81.
If an impulse upwards is complete, then a second wave correction may be unfolding for primary wave 2. Expectations on how deep primary wave 2 is likely to be are now adjusted. It may be expected now to more likely only reach the 0.382 Fibonacci ratio about 2,038.
At this stage, it looks like price has found strong support at the lilac trend line.
Primary wave 2 may not move beyond the start of primary wave 1 below 1,810.10.
DAILY CHART
Click chart to enlarge.
If an impulse upwards is complete, then how may it subdivide and are proportions good?
Intermediate wave (1) was an impulse lasting 47 days. Intermediate wave (2) was an expanded flat lasting 47 days. Intermediate wave (3) fits as an impulse lasting 16 days, and it is 2.04 points short of 0.618 the length of intermediate wave (1). So far this alternate wave count is identical to the main wave count (with the exception of the degree of labelling, but here it may also be moved up one degree).
Intermediate wave (4) may have been a running contracting triangle lasting 22 days and very shallow at only 0.0027 the depth of intermediate wave (3). At its end it effected only a 0.5 point retracement. There is perfect alternation between the deeper expanded flat of intermediate wave (2) and the very shallow triangle of intermediate wave (4). All subdivisions fit and the proportion is good.
Intermediate wave (5) would be very brief at only 18.29 points. Intermediate wave (5) is 1.43 points longer than 0.056 the length of intermediate wave (1).
At this stage, primary wave 2 now has a completed zigzag downwards that did not reach the 0.236 Fibonacci ratio. It is very unlikely for this wave count that primary wave 2 is over there; the correction is too brief and shallow. Upwards movement labelled intermediate wave (X) is so far less than 0.9 the length of the prior wave down labelled intermediate wave (W). The minimum for a flat correction has not yet been met. Primary wave 2 may continue lower as a double zigzag. A second zigzag in the double may be required to deepen the correction closer to the 0.382 Fibonacci ratio.
Intermediate wave (W) lasted a Fibonacci 13 sessions. Intermediate wave (X) has now lasted a Fibonacci eight sessions. If intermediate wave (Y) is equal in duration with intermediate wave (W), that would give the wave count a satisfying look.
Primary wave 2 may not move beyond the start of primary wave 1 below 1,810.10. A new low below this point would see the degree of labelling within cycle wave V moved up one degree. At that stage, a trend change at Super Cycle degree would be expected and a new bear market to span several years would be confirmed.
HOURLY CHART
Click chart to enlarge.
This alternate looks at the possibility that upwards movement for Tuesday’s session is a completed zigzag. This would more likely be only minute wave i within minor wave A, and not minor wave A in its entirety.
This wave count now expects downwards movement for a Fibonacci 13 sessions overall most likely, to end about 2,038.
TECHNICAL ANALYSIS
WEEKLY CHART
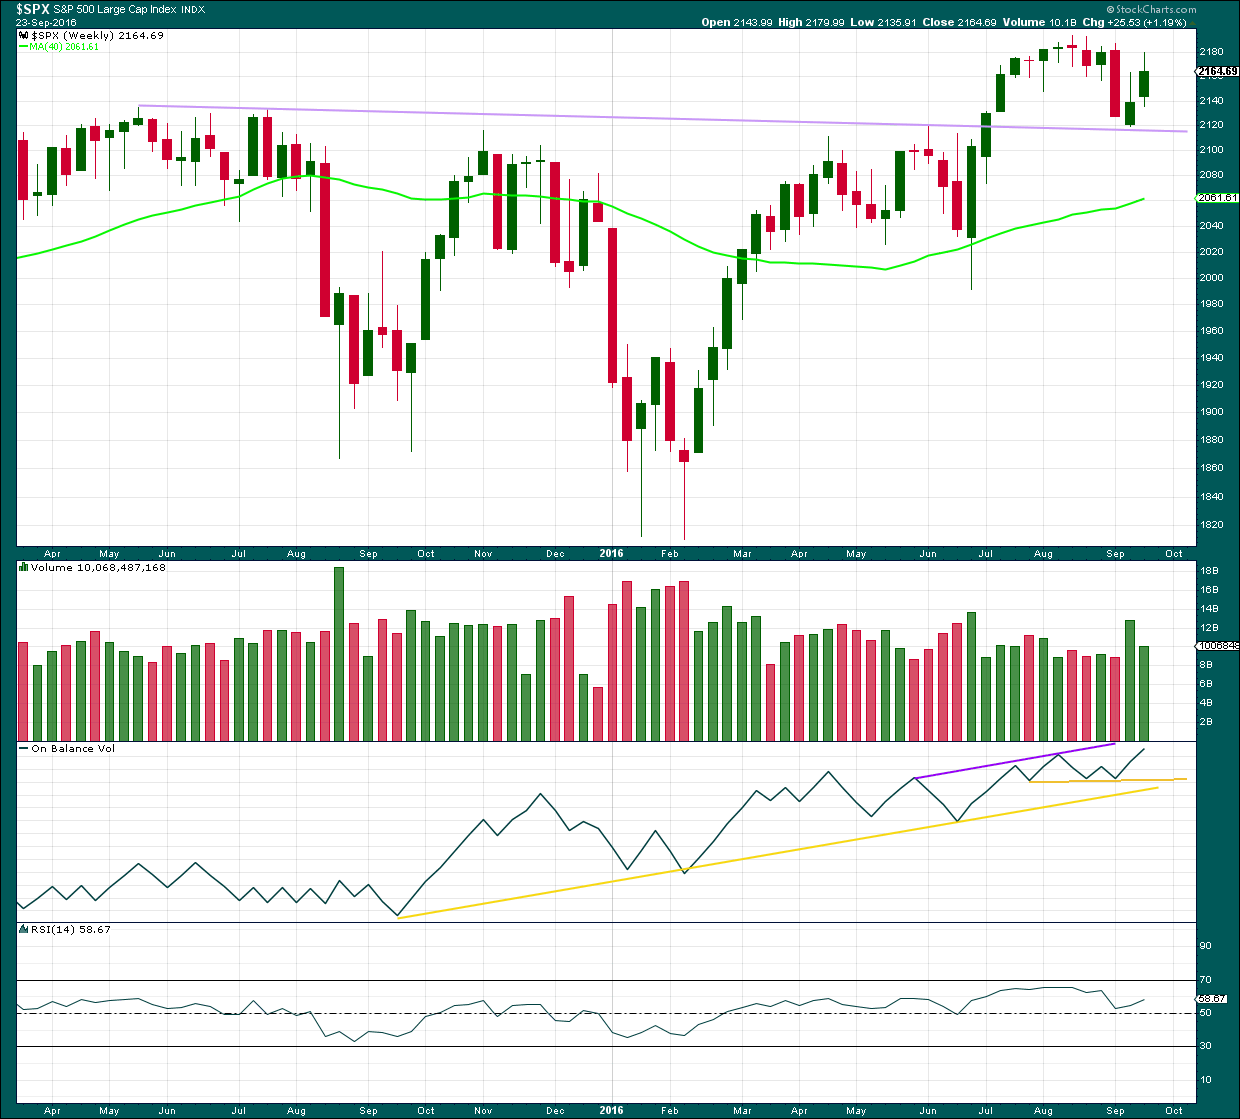
Click chart to enlarge. Chart courtesy of StockCharts.com.
The lilac trend line has provided very strong support whereas previously provided strong resistance. The strength of this line is reinforced. If price turns down from here, it should be again expected to provide support. A break below it would be a strong bearish signal.
Price broke above the long term lilac trend line in July 2016. The low two weeks ago almost perfectly found support at this line, and now price is moving up and away from the line. This looks like a typical breakout followed by a back test for support. It is a reasonable conclusion that price will move further up and away from this line. This view is in alignment with the main Elliott wave count.
On Balance Volume has made a new high above the high for the week of the 6th of August, but price has failed to make a corresponding new high. This divergence is bearish and indicates weakness in price. It does not say that price must turn down from here, only that price is weak. The bull market is unhealthy.
RSI is not extreme. There is room for price to rise further. There is no divergence between RSI and price at the weekly chart level to indicate weakness.
DAILY CHART
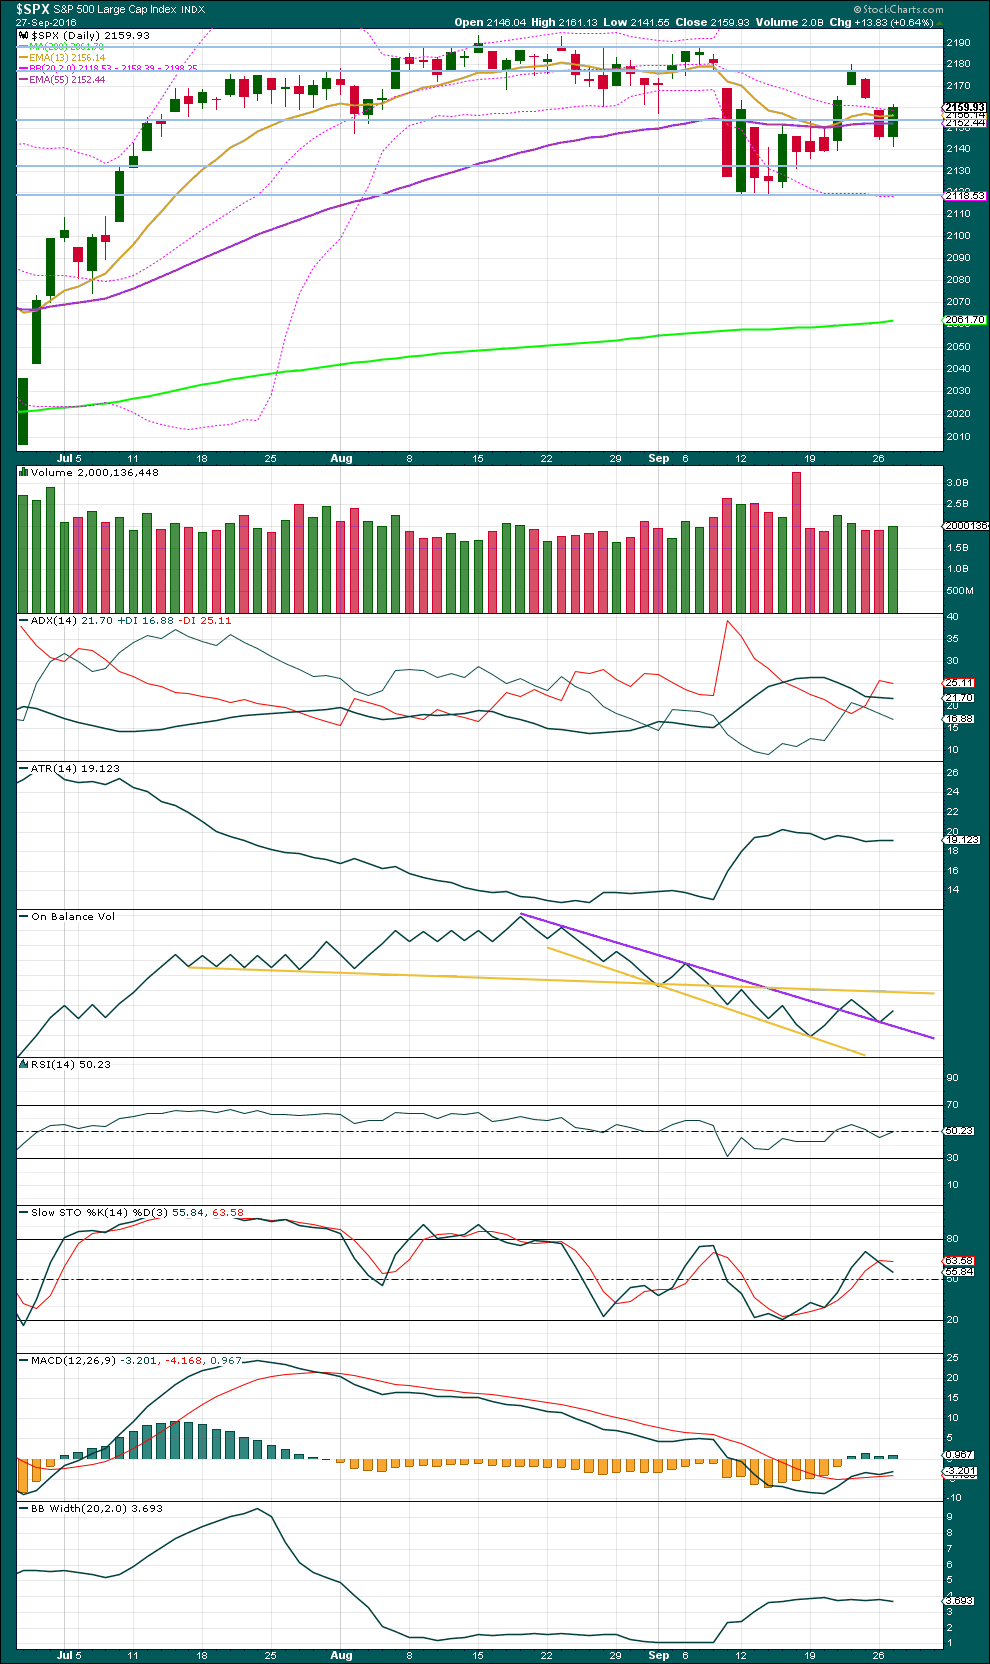
Click chart to enlarge. Chart courtesy of StockCharts.com.
Tuesday’s green daily candlestick has a small increase in volume. The rise in price today has support from volume, and another green daily candlestick would be a reasonable expectation here.
ADX is declining, indicating the market is not trending. ATR is flat to declining, in agreement with ADX. Bollinger Bands have widened but are now remaining steady. This market is not trending. This market is consolidating.
Within this long consolidation, which began back on about 11th of July, it is three downwards days thay have strongest volume. This suggests a downwards breakout is more likely than upwards. This trick may or may not work for the S&P at this time. It is one piece of evidence to weigh up. This consolidation is bounded by resistance at 2,190 and support at 2,120.
On Balance Volume gives another bullish signal today with a move up and away from the purple line. A green daily candlestick for Wednesday would be a reasonable expectation.
RSI is still close to neutral. There is plenty of room for price to rise or fall.
Stochastics has not yet reached overbought. Overall, a continuation of an upwards swing within this consolidation may be expected until price finds resistance and Stochastics reaches overbought at the same time.
There are three moving averages on this chart: a short term Fibonacci 13 days (gold), a mid term Fibonacci 55 days (purple), and a long term 200 days (lime). Both the mid and long term averages are still pointing up, and the mid term average is above the long term average. The longer term trend should be assumed to be up, until these averages prove it is not. The short term average has come down to kiss the mid term average and today it remains above the mid term average. The short term trend is fluctuating, exactly as expected within a consolidating market.
VOLATILITY – INVERTED VIX CHART
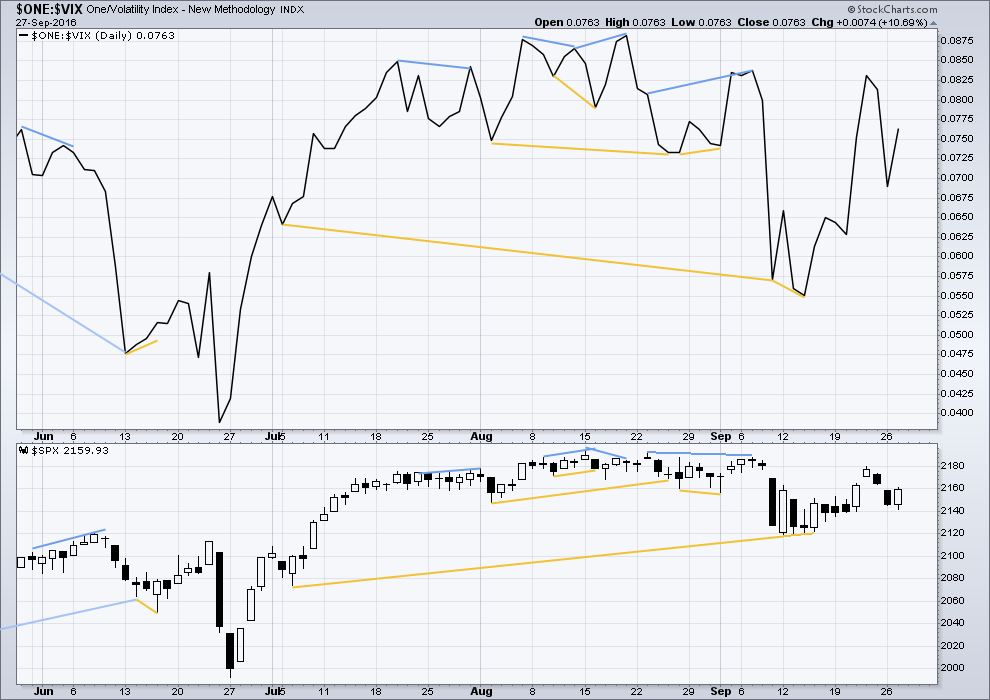
Click chart to enlarge. Chart courtesy of StockCharts.com.
There are a few instances of multi day divergence between price and inverted VIX noted here. Bearish divergence is blue. Bullish divergence is yellow. It appears so far that divergence between inverted VIX and price is again working to indicate short term movements spanning one or two days.
At this stage, no further short term divergence is noted between price and VIX to indicate any weakness either way.
BREADTH – AD LINE
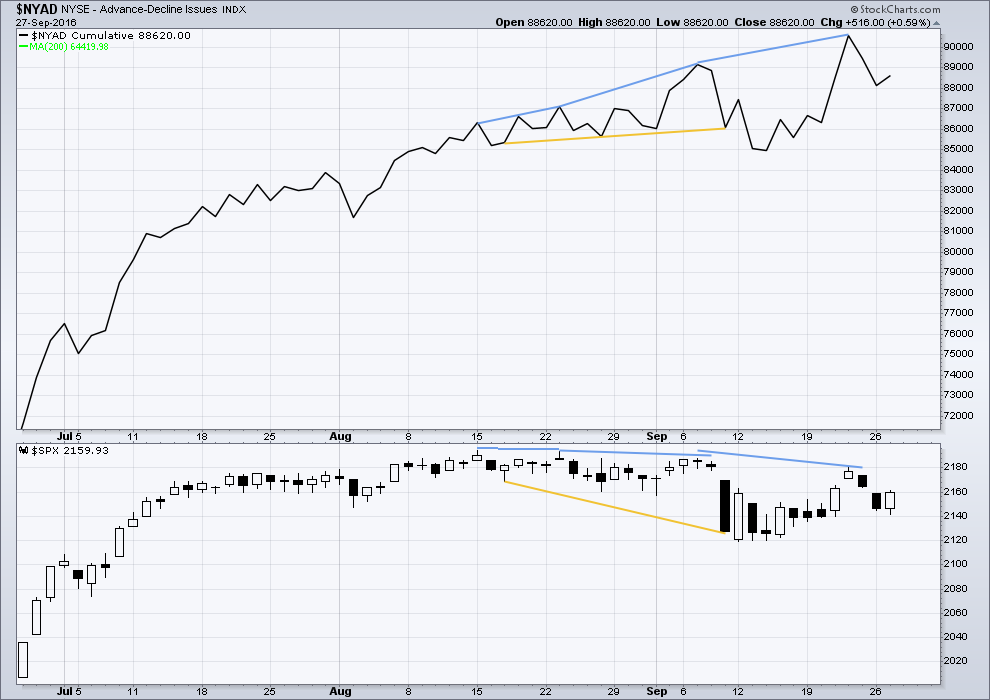
Click chart to enlarge. Chart courtesy of StockCharts.com.
There is support from market breadth as price is rising.
Short term bullish and bearish divergence is again working between price and the AD line to show the direction for the following one or two days.
There is mid term bearish divergence between price and the AD line. The AD line made a new all time high, but price has not yet followed. This divergence suggests weakness in price. So far it has been followed by two days of downwards movement. It is reasonable to now expect this divergence is resolved.
DOW THEORY
Major lows within the old bull market:
DJIA: 15,855.12 (15th October, 2014) – closed below on 25th August, 2015.
DJT: 7,700.49 (12th October, 2014) – closed below on 24th August, 2015.
S&P500: 1,821.61 (15th October, 2014) – has not closed below this point yet.
Nasdaq: 4,117.84 (15th October, 2014) – has not closed below this point yet.
Major highs within the bear market from November 2014:
DJIA: 17,977.85 (4th November, 2015) – closed above on 18th April, 2016.
DJT: 8,358.20 (20th November, 2015) – has not closed above this point yet.
S&P500: 2,116.48 (3rd November, 2015) – closed above this point on 8th June, 2016.
Nasdaq: 5,176.77 (2nd December, 2015) – closed above this point on 1st August, 2016.
Dow Theory Conclusion: Original Dow Theory still sees price in a bear market because the transportations have failed to confirm an end to that bear market. Modified Dow Theory (adding S&P and Nasdaq) has failed still to confirm an end to the old bull market, modified Dow Theory sees price still in a bull market.
This analysis is published @ 09:00 p.m. EST.
[Note: Analysis is public today for promotional purposes. Member comments and discussion will remain private.]
It looks now like minor B may just possibly be over.
I’ll have to consider the alternate scenario though as well, moving the degree of labelling within minor B down one degree and considering this only minute wave a of a flat or triangle, or minute w of a combination.
Bogus OPEC agreement POP… S S S S S S S S S S S S S S IT!
Notice how no details will be released until November… Just anther group tying to create a false stock market rally… to help HRC get elected.
It won’t work… the silent majority has risen!
First again!!
Wish I was surfing to be honest
Me too. No surf for me today.
Maybe tomorrow? 🙂