
Downwards movement was expected for Friday’s session and is exactly what happened.
Summary: One more day of downwards movement to about 2,155 may be expected. Thereafter, price should move higher. It is possible that in the next one to few weeks this market may make a new all time high.
Last monthly chart for the main wave count is here.
New updates to this analysis are in bold.
MAIN WAVE COUNT
WEEKLY CHART
Click chart to enlarge.
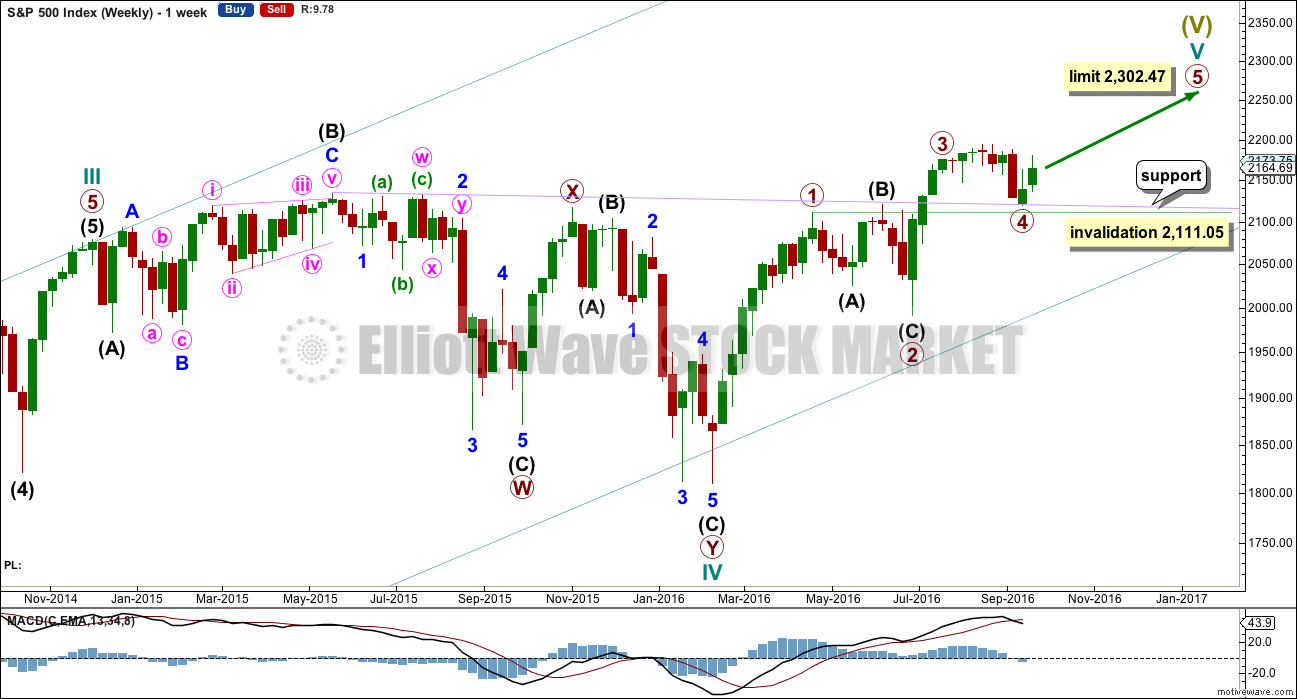
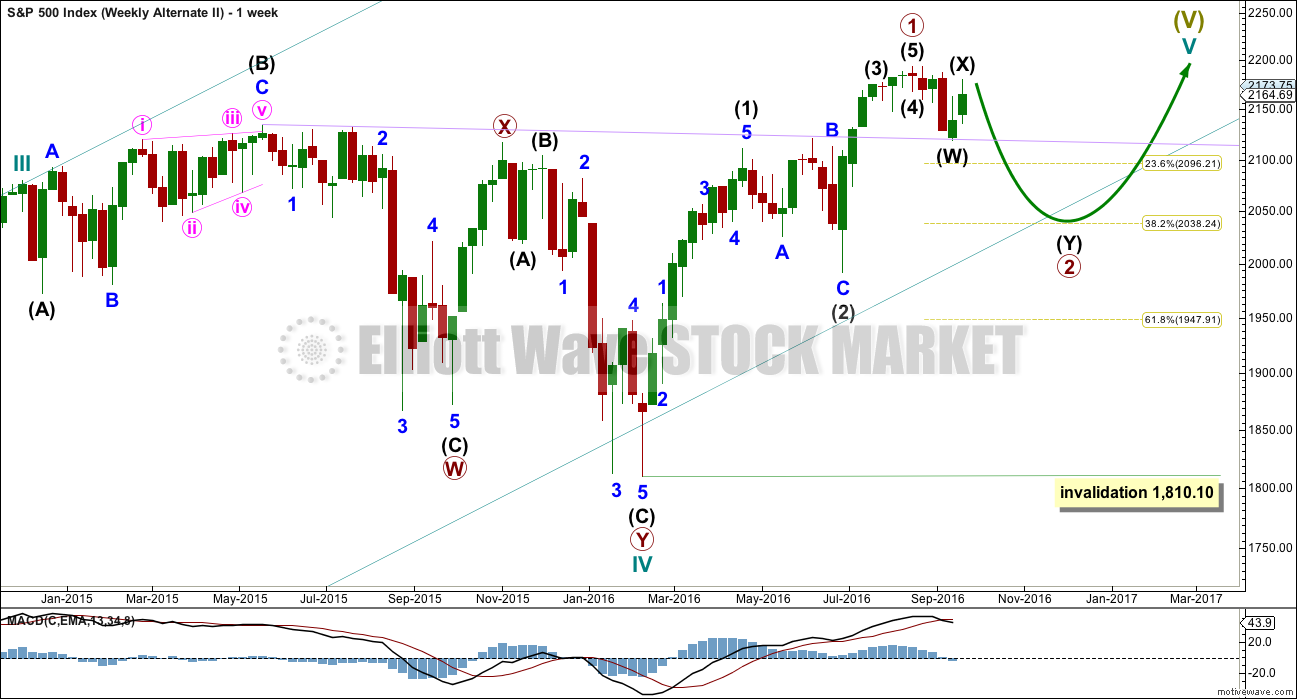
Cycle wave V must subdivide as a five wave structure. I have two wave counts for upwards movement of cycle wave V. This main wave count is presented first only because we should assume the trend remains the same until proven otherwise. Assume that downwards movement is a correction within the upwards trend, until proven it is not.
Primary wave 3 is shorter than primary wave 1, but shows stronger momentum and volume as a third wave normally does. Because primary wave 3 is shorter than primary wave 1 this will limit primary wave 5 to no longer than equality in length with primary wave 3, so that the core Elliott wave rule stating a third wave may not be the shortest is met. Primary wave 5 has a limit at 2,302.47.
Primary wave 2 was a shallow 0.40 expanded flat correction. Primary wave 4 may be exhibiting alternation as a more shallow combination.
Primary wave 4 may not move into primary wave 1 price territory below 2,111.05.
It is also possible to move the degree of labelling within cycle wave V all down one degree. It may be only primary wave 1 unfolding. The invalidation point for this idea is at 1,810.10. That chart will not be published at this time in order to keep the number of charts manageable. The probability that this upwards impulse is only primary wave 1 is even with the probability that it is cycle wave V in its entirety.
DAILY CHART
Click chart to enlarge.
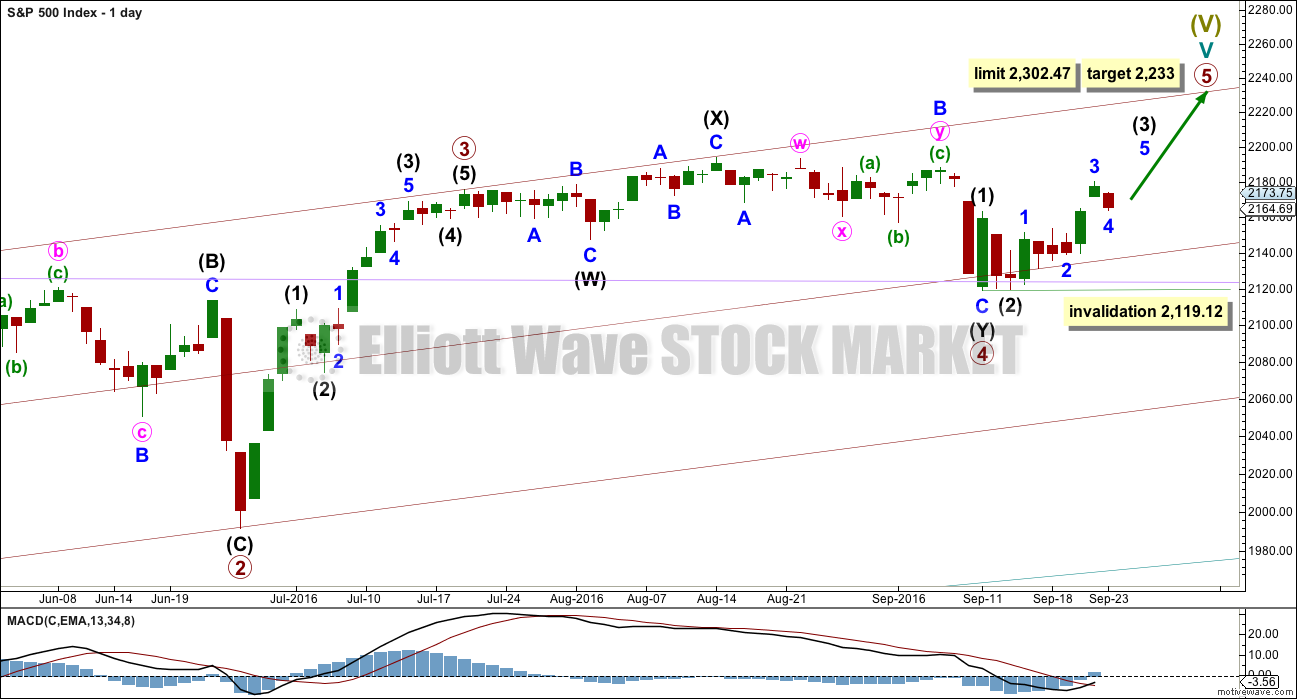
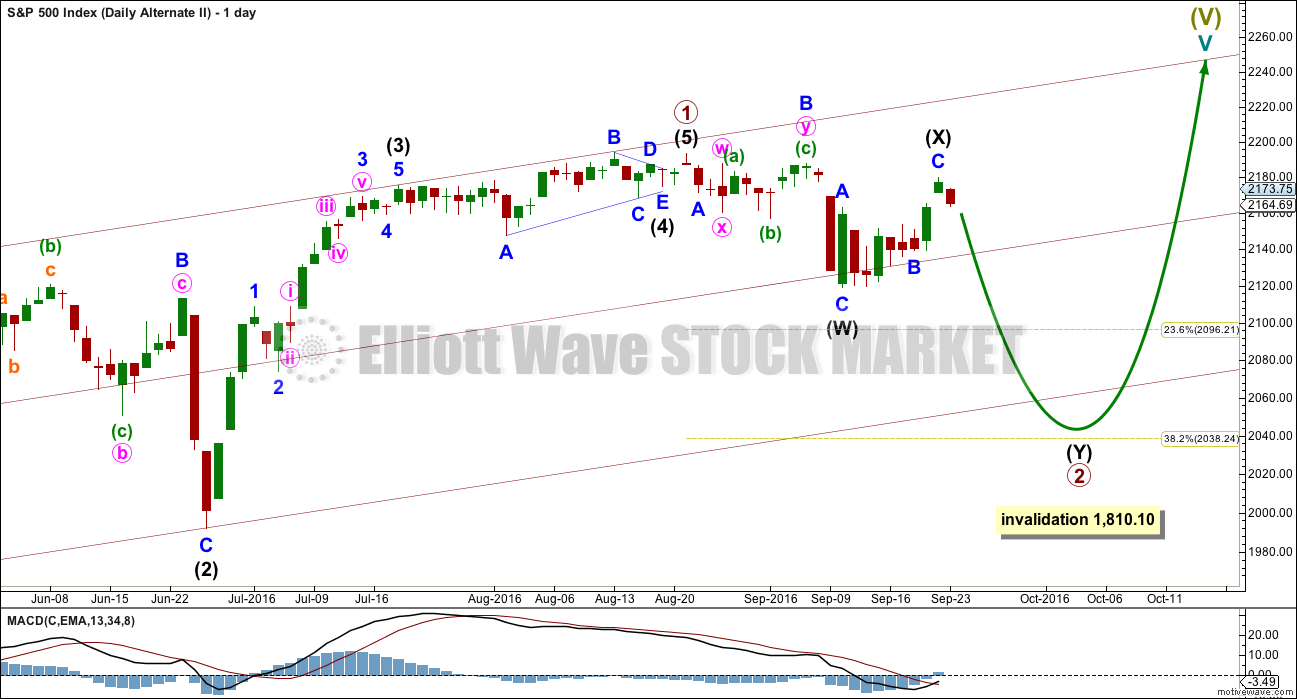
Primary wave 4 may be now complete as a double combination.
It is possible now that primary wave 4 could continue further as a triple, but because triples are very rare the probability of this is very low. If it is over here, then the proportion with primary wave 2 looks right. Within primary wave 5, no second wave correction may move beyond the start of its first wave below 2,119.12.
Primary wave 1 lasted 47 days, primary wave 2 was even in duration at 47 days, primary wave 3 lasted 16 days, and primary wave 4 has lasted 37 days. The proportions between these waves are acceptable.
If primary wave 5 has begun here, then at 2,233 it would reach 0.618 the length of primary wave 1.
There are two possible structures for primary wave 5: either an impulse (more likely) or an ending diagonal (less likely). It is now time to separate these two possibilities into two separate charts at the hourly chart level.
FIRST HOURLY CHART
Click chart to enlarge.
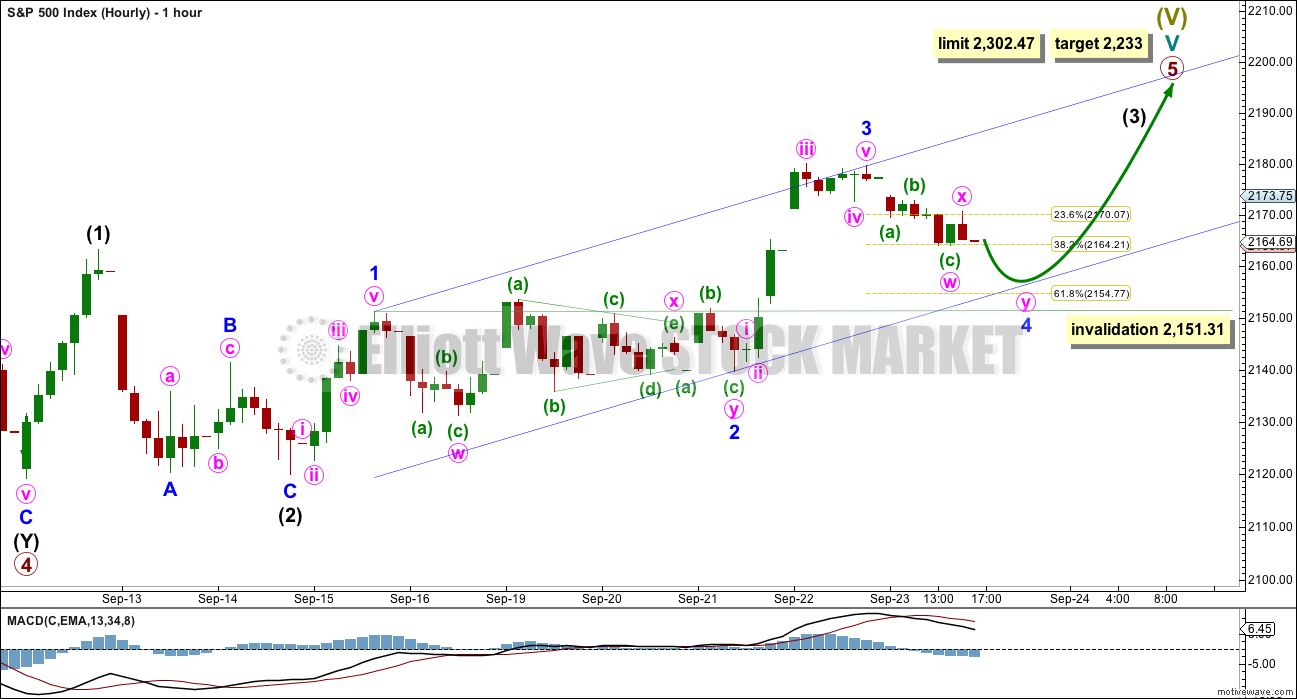
The more common structure for a fifth wave is an impulse, so this is the first hourly wave count. It has a higher probability than the second based upon being a more common structure.
If an impulse upwards is unfolding for primary wave 5, then within it intermediate waves (1) and (2) would be complete. Intermediate wave (3) may only subdivide as a five wave impulse and must move above the end of intermediate wave (1) at 2,163.30. So far it has done this, meeting the Elliott wave rule.
Minor wave 3 within intermediate wave (3) may now be complete, and it exhibits stronger momentum than minor wave 1.
Minor wave 2 was a shallow 0.37 double combination. Given the guideline of alternation, minor wave 4 may be expected to be relatively deep and is most likely to be a single or multiple zigzag. Minor wave 2 lasted 30 hours. So far minor wave 4 has lasted only nine hours, and it is reasonable to expect it to move lower and last longer. Minor wave 4 may not move into minor wave 1 price territory below 2,151.31.
Draw a channel about intermediate wave (3): draw the first trend line from the end of minor wave 1 to the end of minor wave 3, then place a parallel copy on the end of minor wave 2. The lower edge should provide support for minor wave 4.
SECOND HOURLY CHART
Click chart to enlarge.
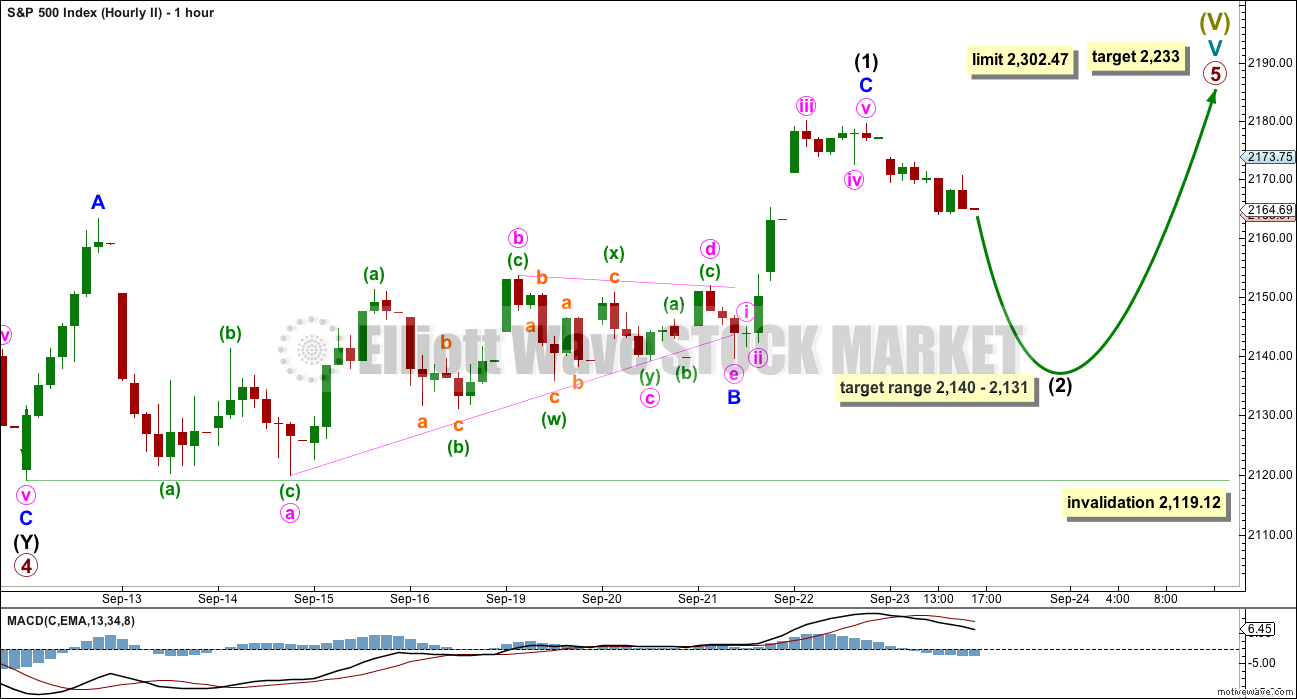
If primary wave 5 is subdividing as an ending diagonal, then all sub-waves must subdivide as zigzags. Intermediate wave (1) may be a completed zigzag.
Second and fourth waves within diagonals have a normal depth of from 0.66 to 0.81 the prior wave. This gives a target range for intermediate wave (2) from 2,140 to 2,131.
Intermediate wave (2) must subdivide as a zigzag. It may not move beyond the start of intermediate wave (1) below 2,119.12.
ALTERNATE WAVE COUNT
WEEKLY CHART
Click chart to enlarge.
What if an impulse upwards is complete? The implications are important. If this is possible, then primary wave 1 within cycle wave V may be complete.
With downwards movement from the high of primary wave 1 now clearly a three and not a five, the possibility that cycle wave V and Super Cycle wave (V) are over has substantially reduced. This possibility would be eliminated if price can make a new all time high above 2,193.81.
If an impulse upwards is complete, then a second wave correction may be unfolding for primary wave 2. Expectations on how deep primary wave 2 is likely to be are now adjusted. It may be expected now to more likely only reach the 0.382 Fibonacci ratio about 2,038.
At this stage, it looks like price has found strong support at the lilac trend line.
Primary wave 2 may not move beyond the start of primary wave 1 below 1,810.10.
DAILY CHART
Click chart to enlarge.
If an impulse upwards is complete, then how may it subdivide and are proportions good?
Intermediate wave (1) was an impulse lasting 47 days. Intermediate wave (2) was an expanded flat lasting 47 days. Intermediate wave (3) fits as an impulse lasting 16 days, and it is 2.04 points short of 0.618 the length of intermediate wave (1). So far this alternate wave count is identical to the main wave count (with the exception of the degree of labelling, but here it may also be moved up one degree).
Intermediate wave (4) may have been a running contracting triangle lasting 22 days and very shallow at only 0.0027 the depth of intermediate wave (3). At its end it effected only a 0.5 point retracement. There is perfect alternation between the deeper expanded flat of intermediate wave (2) and the very shallow triangle of intermediate wave (4). All subdivisions fit and the proportion is good.
Intermediate wave (5) would be very brief at only 18.29 points. Intermediate wave (5) is 1.43 points longer than 0.056 the length of intermediate wave (1).
At this stage, primary wave 2 now has a completed zigzag downwards that did not reach the 0.236 Fibonacci ratio. It is very unlikely for this wave count that primary wave 2 is over there; the correction is too brief and shallow. Upwards movement labelled intermediate wave (X) is so far less than 0.9 the length of the prior wave down labelled intermediate wave (W). The minimum for a flat correction has not yet been met. Primary wave 2 may continue lower as a double zigzag. A second zigzag in the double may be required to deepen the correction closer to the 0.382 Fibonacci ratio.
Intermediate wave (W) lasted a Fibonacci 13 sessions. Intermediate wave (X) has now lasted a Fibonacci eight sessions. If intermediate wave (Y) is equal in duration with intermediate wave (W), that would give the wave count a satisfying look.
Primary wave 2 may not move beyond the start of primary wave 1 below 1,810.10. A new low below this point would see the degree of labelling within cycle wave V moved up one degree. At that stage, a trend change at Super Cycle degree would be expected and a new bear market to span several years would be confirmed.
HOURLY CHART
Click chart to enlarge.
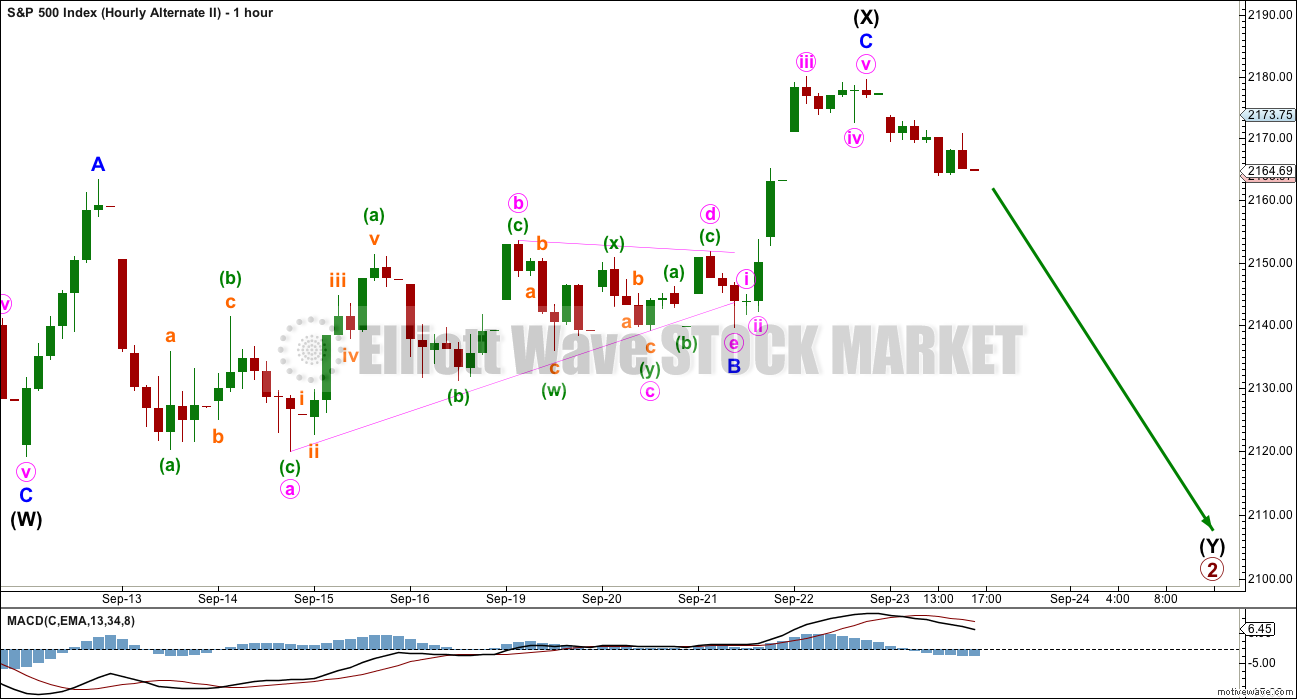
The subdivisions for this hourly chart are the same as for the second hourly chart which looks at a diagonal. A zigzag upwards may have completed and the triangle may be minute wave b within the zigzag.
This wave count now expects downwards movement for a Fibonacci 13 sessions overall most likely, to end about 2,038.
TECHNICAL ANALYSIS
WEEKLY CHART
Click chart to enlarge. Chart courtesy of StockCharts.com.
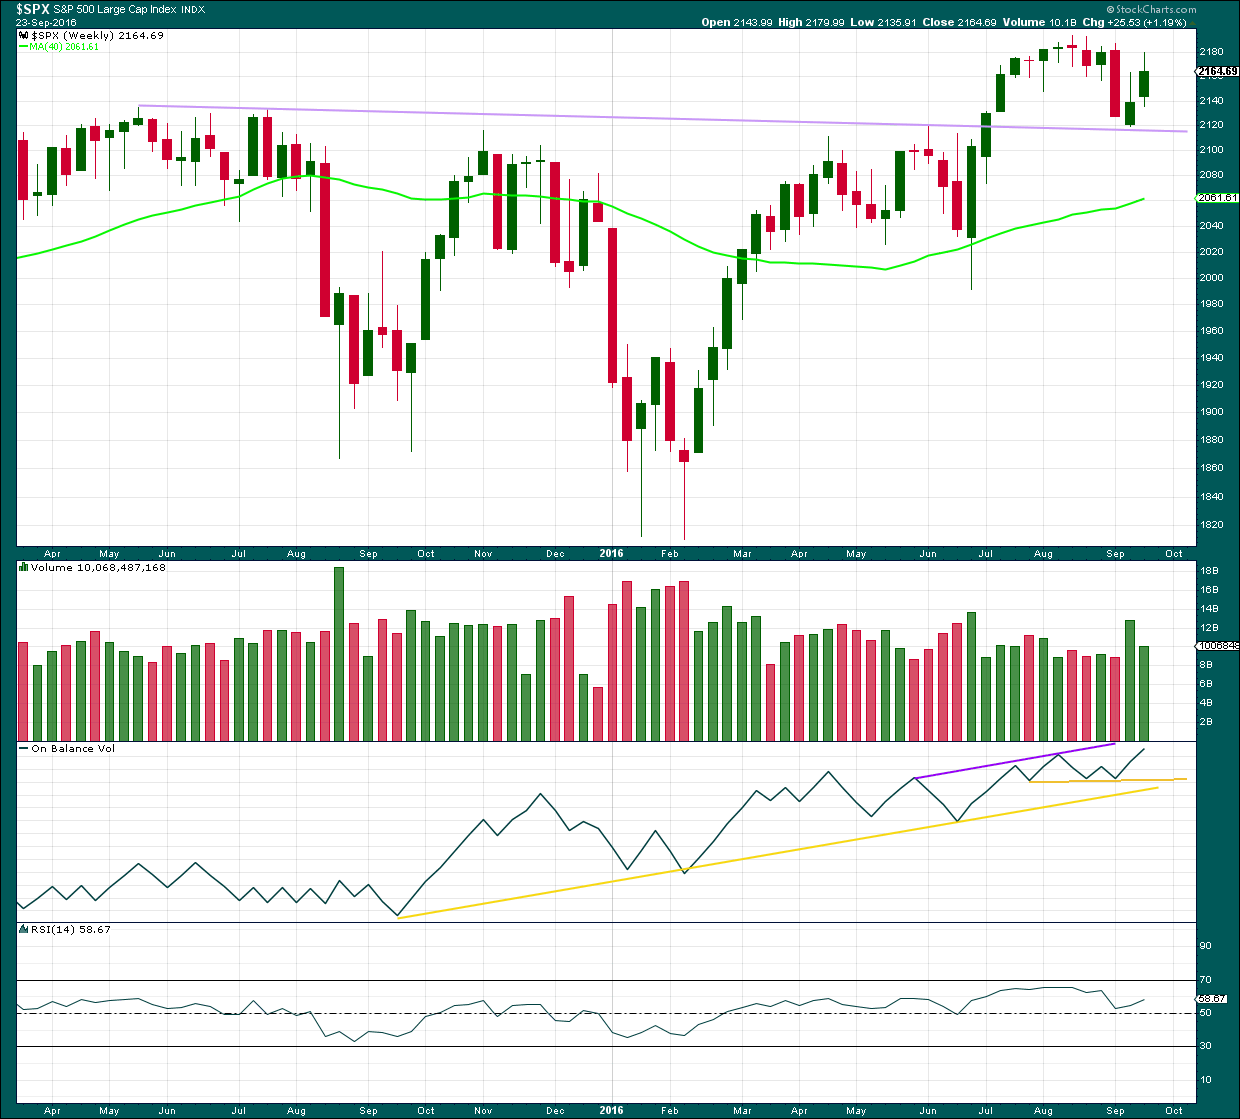
The lilac trend line has provided very strong support whereas previously provided strong resistance. The strength of this line is reinforced. If price turns down from here, it should be again expected to provide support. A break below it would be a strong bearish signal.
Last week completed a green weekly candlestick with strong volume but a long upper wick. This week completes another green candlestick but volume is lighter. The rise in price is not supported by volume, so it is suspicious.
On Balance Volume has made a new high above the high for the week of the 6th of August, but price has failed to make a corresponding new high. This divergence is bearish and indicates weakness in price. It does not say that price must turn down from here, only that price is weak. The bull market is unhealthy.
RSI is not extreme. There is room for price to rise further. There is no divergence between RSI and price at the weekly chart level to indicate weakness.
DAILY CHART
Click chart to enlarge. Chart courtesy of StockCharts.com.
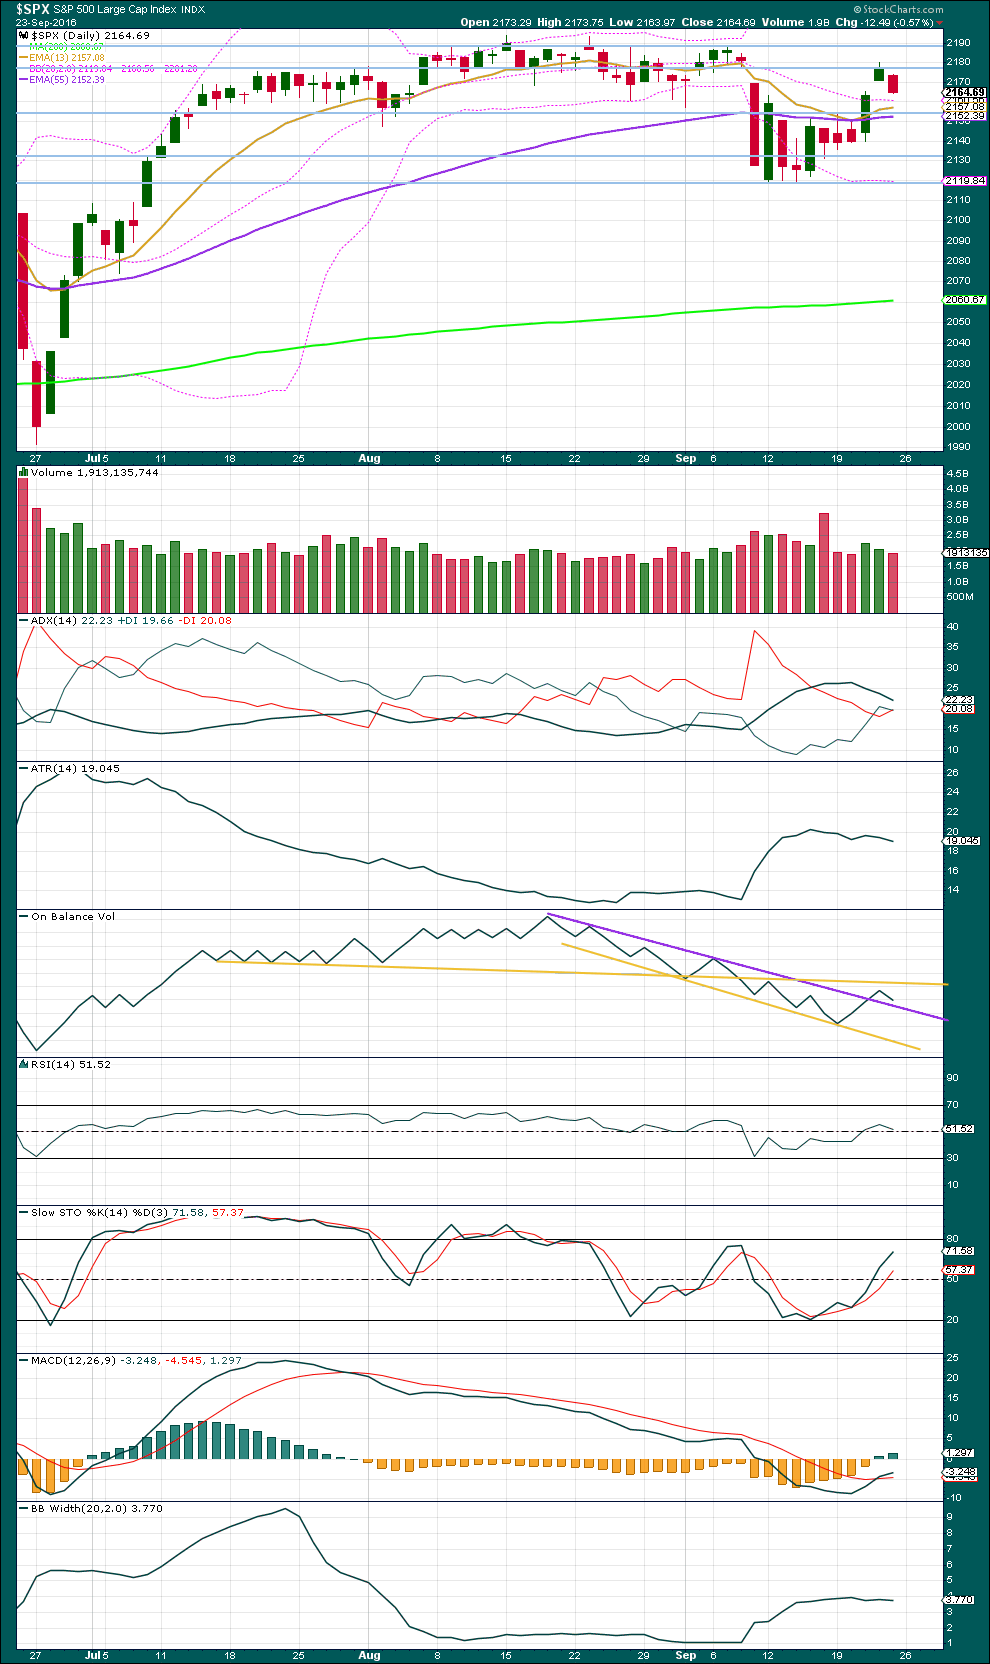
A downwards day for Friday was a reasonable expectation after the prior upwards day showed a decline in volume. Now Friday shows a further decline in volume. It would now be reasonable to expect that downwards movement may be either over here, or may continue for only another one or two days at the most. The fall in price is not supported by volume, so this is likely to be only a small pullback.
Price is again back in a heavy congestion zone, with resistance about 2,190 and support about 2,155. ADX is declining, indicating the market is not trending. ATR is again flat to declining and Bollinger Bands are not expanding. This market is range bound with low volatility.
Stochastics is close to but not yet overbought. Some overall upwards movement would be a reasonable expectation for next week, to continue until Stochastics is closer to overbought and price is closer to resistance.
RSI is neutral. There is plenty of room for price to rise or fall. It exhibits no short term divergence with price to indicate any weakness.
On Balance Volume gave an important bullish signal this week as it broke above the purple trend line. Friday’s session has brought it down, closing in on this trend line. This line should offer support for OBV and assist to halt any further fall in price from becoming too deep. This bullish signal from OBV supports the main Elliott wave count and the first hourly chart. It is not a very strong signal though because the line is too steeply sloped.
VOLATILITY – INVERTED VIX CHART
Click chart to enlarge. Chart courtesy of StockCharts.com.
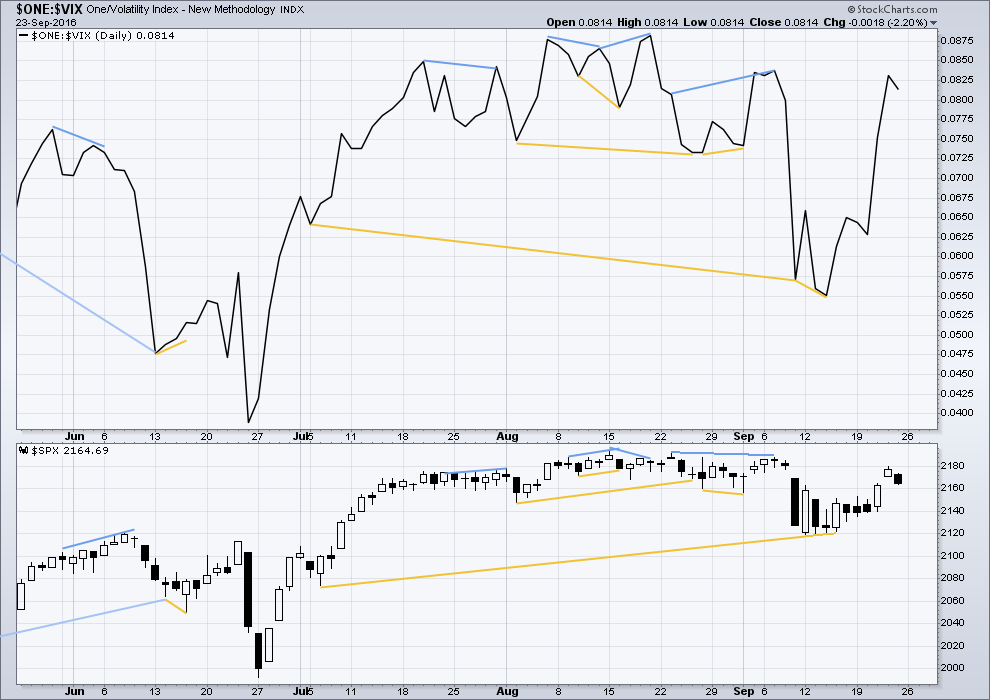
There are a few instances of multi day divergence between price and inverted VIX noted here. Bearish divergence is blue. Bullish divergence is yellow. It appears so far that divergence between inverted VIX and price is again working to indicate short term movements spanning one or two days.
At this stage, no further short term divergence is noted between price and VIX to indicate any weakness either way.
BREADTH – AD LINE
Click chart to enlarge. Chart courtesy of StockCharts.com.
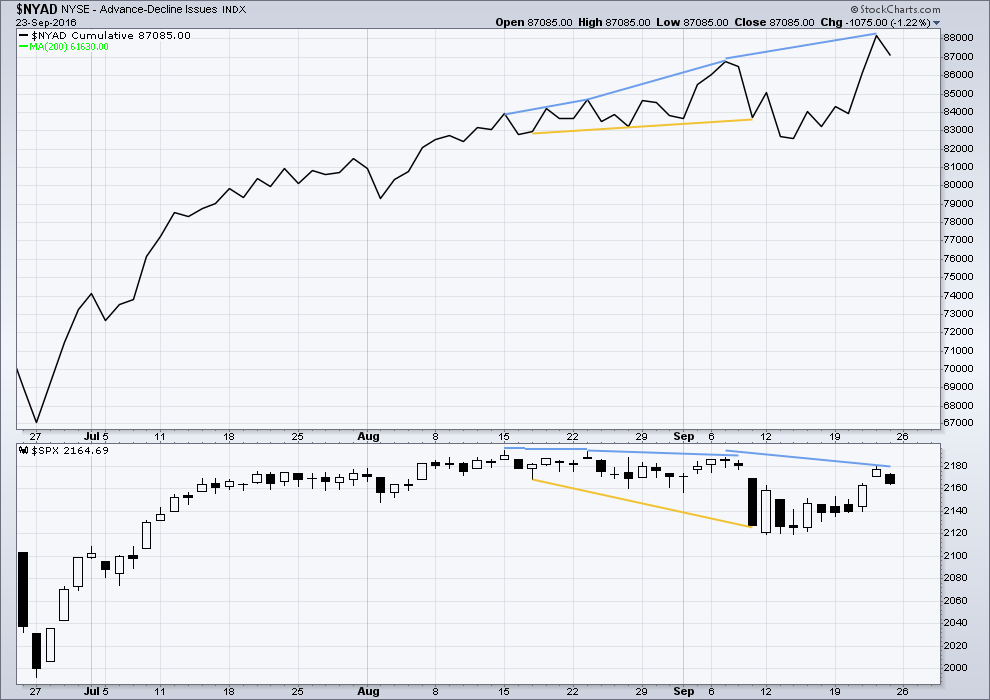
There is support from market breadth as price is rising.
Short term bullish and bearish divergence is again working between price and the AD line to show the direction for the following one or two days.
There is mid term bearish divergence between price and the AD line. The AD line made a new all time high, but price has not yet followed. This divergence suggests weakness in price. So far it has been followed by one day of downwards movement. It may yet need one more day of downwards movement before it is resolved, or it may be resolved now.
DOW THEORY
Major lows within the old bull market:
DJIA: 15,855.12 (15th October, 2014) – closed below on 25th August, 2015.
DJT: 7,700.49 (12th October, 2014) – closed below on 24th August, 2015.
S&P500: 1,821.61 (15th October, 2014) – has not closed below this point yet.
Nasdaq: 4,117.84 (15th October, 2014) – has not closed below this point yet.
Major highs within the bear market from November 2014:
DJIA: 17,977.85 (4th November, 2015) – closed above on 18th April, 2016.
DJT: 8,358.20 (20th November, 2015) – has not closed above this point yet.
S&P500: 2,116.48 (3rd November, 2015) – closed above this point on 8th June, 2016.
Nasdaq: 5,176.77 (2nd December, 2015) – closed above this point on 1st August, 2016.
Dow Theory Conclusion: Original Dow Theory still sees price in a bear market because the transportations have failed to confirm an end to that bear market. Modified Dow Theory (adding S&P and Nasdaq) has failed still to confirm an end to the old bull market, modified Dow Theory sees price still in a bull market.
This analysis is published @ 12:44 a.m. EST on 24th September, 2016.
The short term EW structure is very choppy and overlapping, an ending diagonal now looks to be the more likely scenario.
Diagonals are horrid structures. Hard to analyse and trade. Choppy overlapping movement, with a general trend. The classic TA equivalent here would be a rising wedge.
The second hourly chart is now preferred. Target range for this move down to end 2,140 – 2,131. It may take a few days to get there, it needs to be a zigzag and it may have a deep B wave up within it. Choppy and overlapping.
My labelling here of intermediate (2) is provisional only, the labels of minor A-B-C within it may move. I need time with the five minute chart to draw early conclusions about how it’s forming.
I am struck by the fact that nobody, not even me, is remotely considering that a top may be in. NDX appears to have just completed a five impulse up complete with new all time highs.
I alluded to the situation with DB this morning and simply cannot get out of mind how disinterested the financial community seems to be.
We are talking about rehypothecation with a vengeance in the case of DB.
It really makes your head spin when you think about this practice, also common in the Gold market.
Not only are these folk using other peoples money to execute their scary derivative trades- they are doing it with 30:1 leverage!
If you think about it, it is really the only way you can conceivably get to over allegedly 70 T in derivatives. Collapse of DB irrevocably leads to the complete
collapse of the ECB. Collpase of the ECB means collapse of the FED. Collapse of the FED and everybody is screwed! Could we all be missing something
huge??!!
No, I don’t think we’re missing anything. But I do think it is extremely strange how the collapse of DB is absent from the “news”.
At least, I don’t see any mention of it here in NZ, and when I look at the few outlets I sometimes visit for Britain and Germany I don’t see it there either.
Weird.
I guess social mood isn’t ready yet to turn outside of Germany.
Any German members may like to comment and shed some light here? Is the collapse of DB covered well over there? What is your take on social mood currently in Germany?
Lara that count looks to me to be right on the money.
I trimmed some of my short positions going into the close but still have a few open as I think we are not quite at the bottom yet. VIX close to highs of the day.
Bye’ all!
I think the banksters are again going to fight the decline right into the close when we get the final plunge down, followed by sky high futures overnight. These guys are so predictable it is not even remotely funny….I will be trading accordingly…. 🙂
Well…back for a peek, and the cobra continues its coil.
Actually these triangles are very good bread and butter trades as they have a high probability of a violent break. The problem is you can never be quite certain which way they will ultimately move out of the formation. I generally will use a straddle to take advantage of the thrust but I think the current one is most likely some kind of continuation pattern and so will break to the downside…staying short for the time being…
We just had a fake out- break upwards so we should be just about ready to accelerate to the downside- adding to short position…
*Sigh* Looks line another protracted triangle developing for a fourth wave…Oh well.
I guess I will just have to open a few STC limit orders and hope they get filled on the final move down. I think I have watched enough drying paint for one, day thank you! 🙂
Snoozefest. We need to either fall away from this 2150 pivot or fill the gap from this morning. I’ll give it another hour before I take profits on my short trades and take my leave. They are boring me to tears…
“The Thrilla in Manila”
Or more accurately “The Thrilla at Hofstra” is tonight! Expected to be “The” most viewed Debate in History! Maybe with a larger audience than the Super Bowl!
The Elite’s are in panic mode as evidenced by the Front Page of the New York Times today (Millions in US Climb Out of Poverty, at Long Last) {What BS!} and their united attack front on the airwaves today!
A Trump path to a landslide electoral victory is right on schedule. The “Elite’s” are in denial! The “silent” majority will take back the country and “Disrupt” Washington & their crony Globalists once & for all!
All who said that they would move out of the USA if Trump wins, well… Pack Your Bags, sign the contract with your movers and Book your transportation NOW!
Psst… don’t tell anyone but on election day… Trump wins the State of New Jersey. Please keep this very quiet!
That’s only if the election isn’t fixed…ballots are counted by computers which are programmed by humans…so much fraud…
In NJ there still is a paper trail… It’s NOT all digital. Yes… for all digital, everyone should be concerned.
Just like you all should be concerned for contributing in making your entire financial life digital with no paper trail. That would include a cashless existence. You whole Life should NOT be on and controlled with your Smart Phone!
I’m in total agreement…but the question is when…cashless plans could be delayed for many years…until the masses become even more lazy and complacent. So, it’s hard to be completely off-grid, but we shouldn’t have our rights violated. Too bad NJ has that governor…
The fact that they are reporting them neck and neck in the polls probably means he now has a substantial lead over Madam Clintonista…some of their own pollsters have him winning with 275 electoral college votes if the election were held today…
Knock Knock Knock! On heavens door… the bears are knocking….
Hard to say whether we are in a small fourth wave within larger corrective move down or if the final move down just ahead…
Brouhaha developing around 2150…who will prevail??!!
Price seems to falling out of a series of bearish pennants on one minute chart…
If we can decisively take out 2150 a swift trip to 2140 should be all she wrote….the banksters seem intent on defending it though…we’ll see…if it holds after this fifth touch this morning it becomes even stronger support short term…
We should get a red VIX print by the close if this downward correction is going to complete today. Not clear ATM.
The developing lower shadow and failure to challenge the lower pivots so far bullish imo. This move down could reverse today…
Looks like final wave down underway. Should reverse after finding strong support at the shelf…
For you currency buffs, a big move afoot in the Euro. It has been tracing out a fairly large triangle so the move should be substantial. I suspect it will be to the downside and will be taking advantage with a bevy of 109/112 bear credit spreads on FXE going into mid October.
Vern,
The move in Yen has been quite interesting too this year.
Yes it has. I feel badly for Kuroda. He must be wondering what it is going to take to permanently weaken it.
Gap down from Friday’s close at 2164.69 a real gift for traders. We now have a pivot for an upside trade when that gap is filled. We should retest the support shelf at 2140.00
Speaking of DB. We know that many companies have been using share buybacks, fueled by easy money courtesy of the banks, to artificially boost their PE ratios and supposedly justify the elevated evaluations despite declining revenues.
Have you ever wondered why banks could not do the same thing with their own shares? It stands to reason that DB would have tried this so it makes their on-going plunge even more ominous. But don’t worry, both the EU and the US have quietly passed laws now on the books that allows the insolvent banks to seize the capital of depositors in exchange fore bank shares. Don’t say you have not been duly warned! 🙂
Looks like we will get our interim bottom today with completion of a Y or C wave down. These sharp corrective moves have not be lasting longer than a day or two so the final impulses up should get underway later today or tomorrow. DB continues to plunge toward its ultimate destination- zero!
Wow! I am really surprised that no one else has commented on Rodney’s Ciovaccio link. What he says in that video has huge implications for traders and investors alike if he is right.
While maintaining that mood does indeed drive market price, as opposed to fundamentals (more on that in a moment), he nonetheless asserts that central banks by their actions, or stated intentions can ultimately affect/control mood and therefore price. I believe that is a fair reading of his conclusions and explanation for data he cites.
On the question of fundamentals, its irrelevance to price can only be advanced so far. After all, it does not matter how bullish a person is on the markets; if he does not have any money he cannot purchase stocks. If companies are not making any money and cannot borrow it at basement bargain prices, they cannot buy back shares. We know for a fact that many shares remain elevated not because central banks have affected the mood of market participants so as to provoke a bullish buying spree, but rather that companies have been spending hundreds of billions buying back their own shares. Can this continue indefinitely? Clearly it cannot; especially as revenues continue to decline. If you look closely, even with all the buy back activity, many indices are remaining elevated because of relatively few stocks in the index, and not because of some broad based bullish sentiment. At some point, fundamentals can and will matter. On the ability of central banks to metamorphose a topping process into a bullish bottom- now there is a new idea!!!
Clearly, I remain profoundly skeptical… 🙂
Vern, You are correct in that the financial nonsense and liquidity creation from thin air cannot continue forever. Every Ponzi scheme is deflated eventually. It collapses under its own weight.
SPX 2040 is less than 100 SPX points away. The Nov. elections are only weeks away. This puts us at a very dangerous time. My plan is to be ready to exit all long positions quickly as one or both of these potential tipping points approach. I am in a profitable position right. I must remember
Bulls make money.
Bears make money.
Pigs get slaughtered.
I cannot tell you how happy I am to hear that you are ready to pull that trigger as I know you are long. I think your plan is smart. Everyone thinks we are going to get a slow and leisurely topping process with plenty of time to see it develop and so make an orderly exit. Bubbles burst, by definition a violent event, and we are arguably, at Grand Super Cycle degree, in one of the biggest. Time in my humble opinion, to have a hair trigger finger on the eject button…
That should have read 2240 on the SPX is less than 100 points away. Sorry.
Then there are exogenous shocks that have nothing to do with economic or financial data, and which no model, no matter how sophisticated, could ever hope to predict. The so-callled “Black Swan”.
A few hours ago China and Japan were involved in an areal confrontation over the on-going dispute surrounding the South China Sea.
We also have insane, blood-thirsty, and outright criminal individuals in the US military calling for a Russian no-fly zone in Syria – essentially a declaration of war on both Syria and Putin. And oh yes…the murder of those Syrian soldiers was exactly that, not an “accident” as our government would have us believe. Remember that abject fool, Morrel, on Charlie Rose calling for the CIA to kill Russian personnel? (They did subsequently kill one of Putin’s drivers!)We are living in dangerous times folk.
I am bearish….
I interpreted what he was saying was that the banks are trying to engineer a bottom out of a top. Not that they would be successful.
O.K Had a bit more time to review and ruminate about the video. The analysis has an eerie resemblance to some of the ideas behind LTCM’s forecasting model. They also had some very bright analysts on board. I am afraid on cannot view these kinds of analyses divorced from the larger context of global economic realities. It is truly astonishing to me personally how much power is being ascribed today to central banks
and how some folk can be convinced that they can completely abolish the business cycle. The expression of the idea that central banks can financially engineer a bottom out of a topping process I find particularly scary. We are really in uncharted waters with this kind of thinking. My own opinion is that Chris is about to learn that models work great…until they don’t….LTCM learned this the hard way…
I agree.
I think social mood will trump it all, and the banks are only able to do what they’ve been doing to date because they have the implicit support from the majority.
I don’t think the banks can engineer a bottom out of a top, but I do think they’ll try.
When mood shifts and fear takes hold there will be absolutely nothing they can do to stop price falling.
Thanks Lara. For some time, I have not noticed the following statement from your main count weekly analysis:
“The probability that this upwards impulse is only primary wave 1 is even with the probability that it is cycle wave V in its entirety.”
This is a very important point to remember. Of course we need more time and development of the wave pattern to know for sure. But I sure will be watching out for some confirmation.
I recommend all subscribers watch the Ciovacco Capital YouTube analysis from yesterday. It is titled, Seismic Shift: What Could It Mean For Stocks? The link is:
https://www.youtube.com/watch?v=gRN2233ro-4
Have a great weekend all. And again, thank you Lara for the analysis day in and day out. Greatly appreciated.
Interesting take by Chris. He seems confident that even with the perturbations caused by the central banks’ intervention (engineering a bottom our of a top), that the performance of his models remain unaffected. Interesting!
I really love his approach. Taking the evidence in front of us, making a judgement, and being open and flexible if the evidence changes.
Now, it could be that a top is closer than he thinks, but if that is so his model will pick up on it shortly after the turn.
I learn something new every time I watch one of his videos.
I agree that his videos are always very informative and he clearly employs some very sophisticated metrics. What I find surprising is the bottom line conclusion that market participants should remain fully invested based on those metrics. After all, analysis is taking place within the context of a of a slowing global economy, declining corporate earnings, a transportation index that made its high in 2014, demand destruction due to historic demographic shifts, and more ominously, insolvent central banks. These also are undeniable facts and not based solely on anyone’s emotional view of the markets. Chris has apparently concluded that his analysis trumps all those facts and renders them of less significance than what his analysis is suggesting regarding being on the threshold of an extended bull run. Lara I think you hit the nail on the head when you said that the potential fatal flaw of his analysis is that the shift in market fortunes will continue to unfold as it has in the past, thus giving his model time to signal the impending change. I personally think we have already had some hints that this may not be the case this time around. It has always been my view that what is going on in the markets currently is unprecedented, and he himself acknowledges that. If that is indeed the case, why would one conclude that metrics successfully providing adequate warning with previous market conditions, would continue to do so under market conditions we have never seen before?
Just thinking out loud. 🙂
What Ciovacco said was that his model indicates no change in position is necessary. If one were to evaluate his investment portfolio, I suspect one would find many defensive positions. He is not saying that anyone should become 100% fully invested in the US equity markets starting now. He said the model indicated positions which were instituted sometime in the past should remain as instituted.
The current evidence that he evaluates from a technical analysis view, gives no reason to change position. The model looks for clues as to when it is time to make changes. The current view indicates that a move up in the US equity markets may continue. In the past the current indicators he analyzed were followed by substantial moves higher. He admits that the market may not follow the same course. But right now, no change in position is warranted.
My analysis is that we broke out to new all time highs this past July. This past month we have tested the breakout point from above for support. The support has materialized and so far, it is holding. A new ATH will confirm the continued move in this direction. How far we go, that is another matter. My next target is the 2240 area. At that point we re-evaluate.
He could be right on the money on that possible return to retest the breakout area- a very comment move after a break-out. I would agree a trade to the long side is in order if it moves on to new highs after the retest. I would not however, be thinking of that trade as entering a long term relationship!
As always, you’re welcome Rodney 🙂
Good to see you had time away in the woods, and you didn’t get eaten by bears.
We had a big family occasion at my home this past week and weekend. Our house and property were filled. As soon as all the guests are gone in a couple of days, I am headed back up to the mountains for a few days. Too much positive and joyful stress this week for my tastes. I need my alone time to decompress!
Oh that’s wonderful Rodney. Time surrounded by family is just the best.
But I agree, for some of us some time alone to decompress after is needed.
Ha. First, 3 hours after publication.