
Upwards movement was expected for Thursday’s session.
Summary: Volume and divergence with the AD line suggests one or two days of downwards movement. This supports the second hourly chart for the main wave count. Price may move overall lower over one to a few days, to end in a range from 2,140 to 2,131. Risk is at 2,119.12.
Last monthly chart for the main wave count is here.
New updates to this analysis are in bold.
MAIN WAVE COUNT
WEEKLY CHART
Click chart to enlarge.
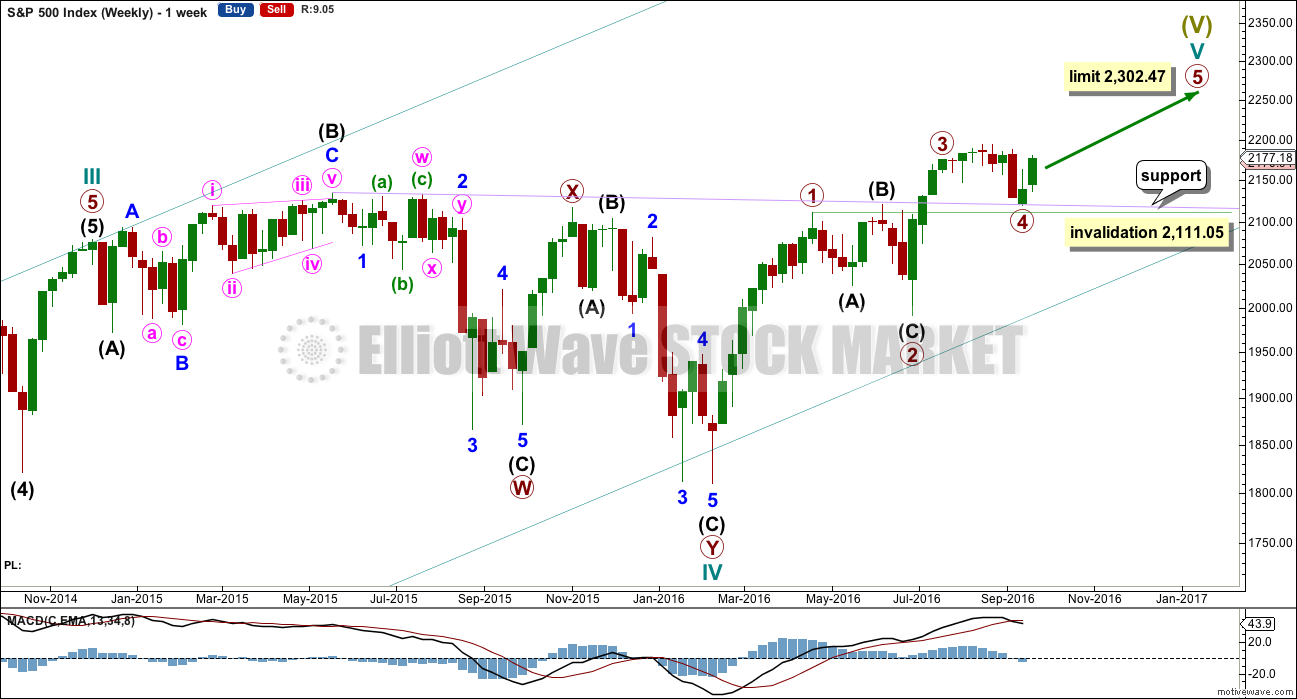
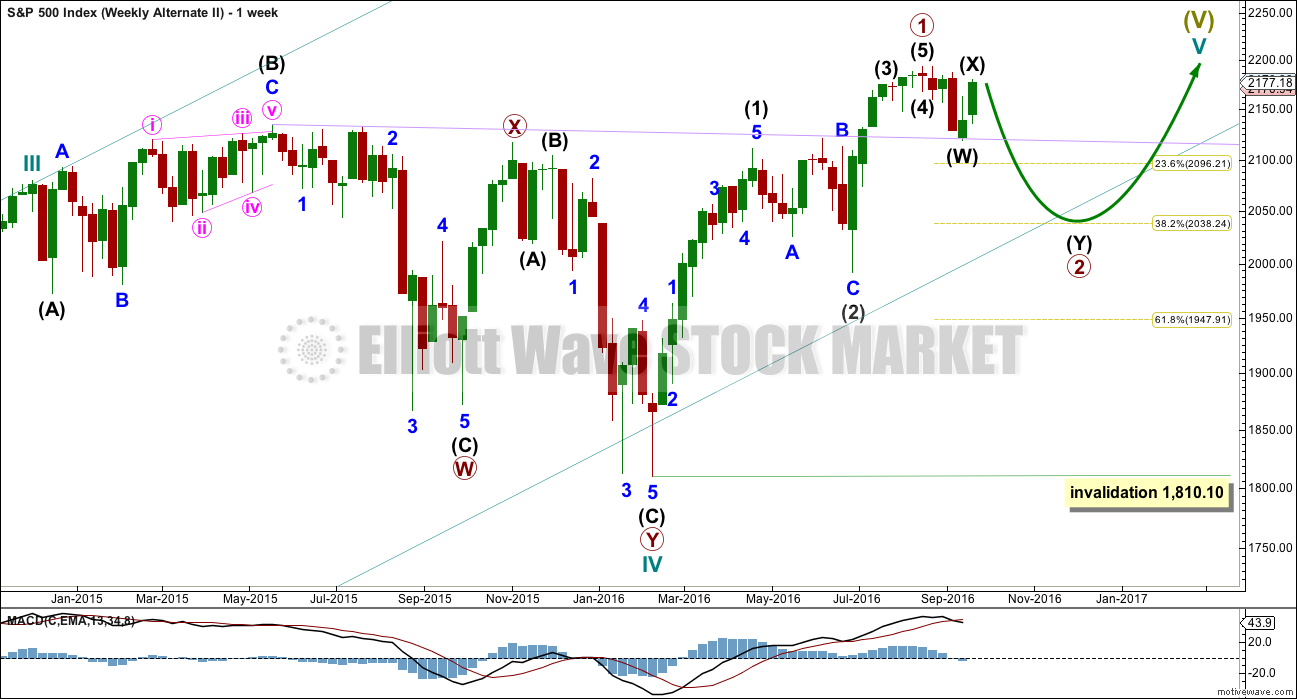
Cycle wave V must subdivide as a five wave structure. I have two wave counts for upwards movement of cycle wave V. This main wave count is presented first only because we should assume the trend remains the same until proven otherwise. Assume that downwards movement is a correction within the upwards trend, until proven it is not.
Primary wave 3 is shorter than primary wave 1, but shows stronger momentum and volume as a third wave normally does. Because primary wave 3 is shorter than primary wave 1 this will limit primary wave 5 to no longer than equality in length with primary wave 3, so that the core Elliott wave rule stating a third wave may not be the shortest is met. Primary wave 5 has a limit at 2,302.47.
Primary wave 2 was a shallow 0.40 expanded flat correction. Primary wave 4 may be exhibiting alternation as a more shallow combination.
Primary wave 4 may not move into primary wave 1 price territory below 2,111.05.
It is also possible to move the degree of labelling within cycle wave V all down one degree. It may be only primary wave 1 unfolding. The invalidation point for this idea is at 1,810.10. That chart will not be published at this time in order to keep the number of charts manageable. The probability that this upwards impulse is only primary wave 1 is even with the probability that it is cycle wave V in its entirety.
DAILY CHART
Click chart to enlarge.
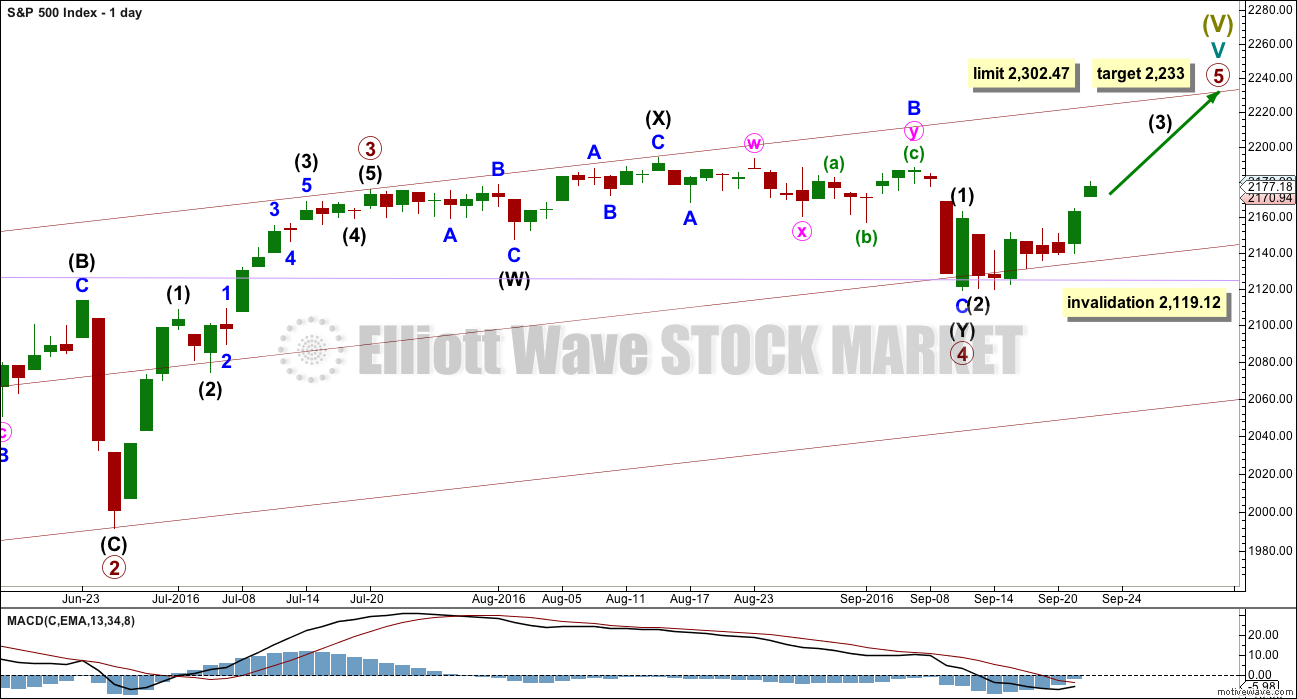
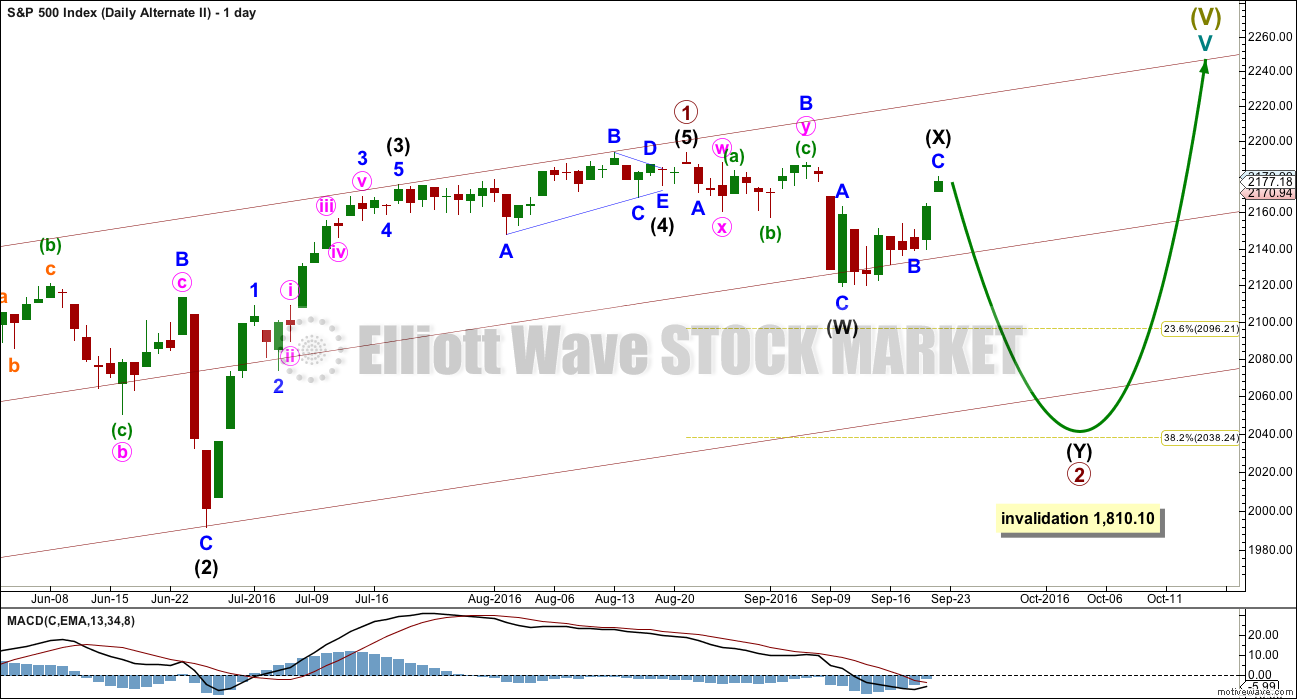
Primary wave 4 may be now complete as a double combination.
The first structure in the double is labelled intermediate wave (W) and is an expanded flat correction. The double is joined by a three in the opposite direction labelled intermediate wave (X). The second structure in the double is a zigzag labelled intermediate wave (Y).
The whole structure for primary wave 4 has a mostly sideways look, but the fact that intermediate wave (Y) has ended comfortably below the end of intermediate wave (W) must necessarily reduce the probability of this wave count. To achieve the purpose of taking up time and moving price sideways the second structure in a double should end close to the same level as the first and this one does not. This part of the wave count does not have the right look.
Primary wave 4 may not move into primary wave 1 price territory below 2,111.05.
Primary wave 1 lasted 47 days, primary wave 2 was even in duration at 47 days, primary wave 3 lasted 16 days, and so far primary wave 4 has lasted 39 days. The proportions between these waves are acceptable.
If primary wave 5 has begun here, then at 2,233 it would reach 0.618 the length of primary wave 1.
A new high above 2,171.25 would invalidate the alternate daily wave count below and provide some confirmation of this main wave count. A new high finally above 2,187.87 would provide further confidence in this main wave count; that would invalidate other scenarios for the alternate.
There are two possible structures for primary wave 5: either an impulse (more likely) or an ending diagonal (less likely). It is now time to separate these two possibilities into two separate charts at the hourly chart level.
FIRST HOURLY CHART
Click chart to enlarge.
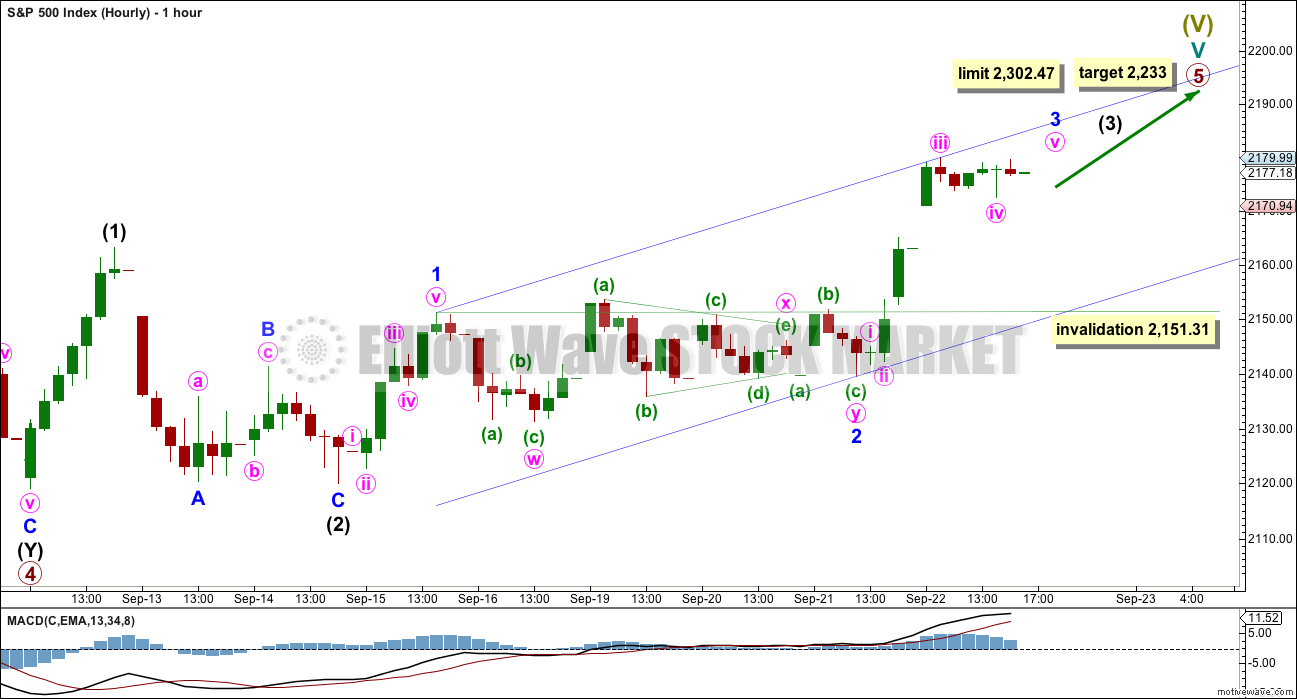
The more common structure for a fifth wave is an impulse, so this is the first hourly wave count. It has a higher probability than the second based upon being a more common structure.
If an impulse upwards is unfolding for primary wave 5, then within it intermediate waves (1) and (2) would be complete. Intermediate wave (3) may only subdivide as a five wave impulse and must move above the end of intermediate wave (1) at 2,163.30.
Within intermediate wave (3), minor waves 1 and now 2 would be complete. Minor wave 2 fits as a double combination: zigzag – X – flat.
Minor wave 3 within intermediate wave (3) has begun and exhibits an increase in upwards momentum. At 2,190 minor wave 3 would reach 1.618 the length of minor wave 1. Minor wave 3 may end in one more upwards day. The following correction for minor wave 4 may not move into minor wave 1 price territory below 2,151.31.
Draw an acceleration channel about intermediate wave (3): draw the first trend line from the end of minor wave 1 to the last high, then place a parallel copy on the end of minor wave 2. Keep redrawing the channel as price moves higher. When minor wave 3 is over and minor wave 4 begins, the lower edge should provide support.
SECOND HOURLY CHART
Click chart to enlarge.
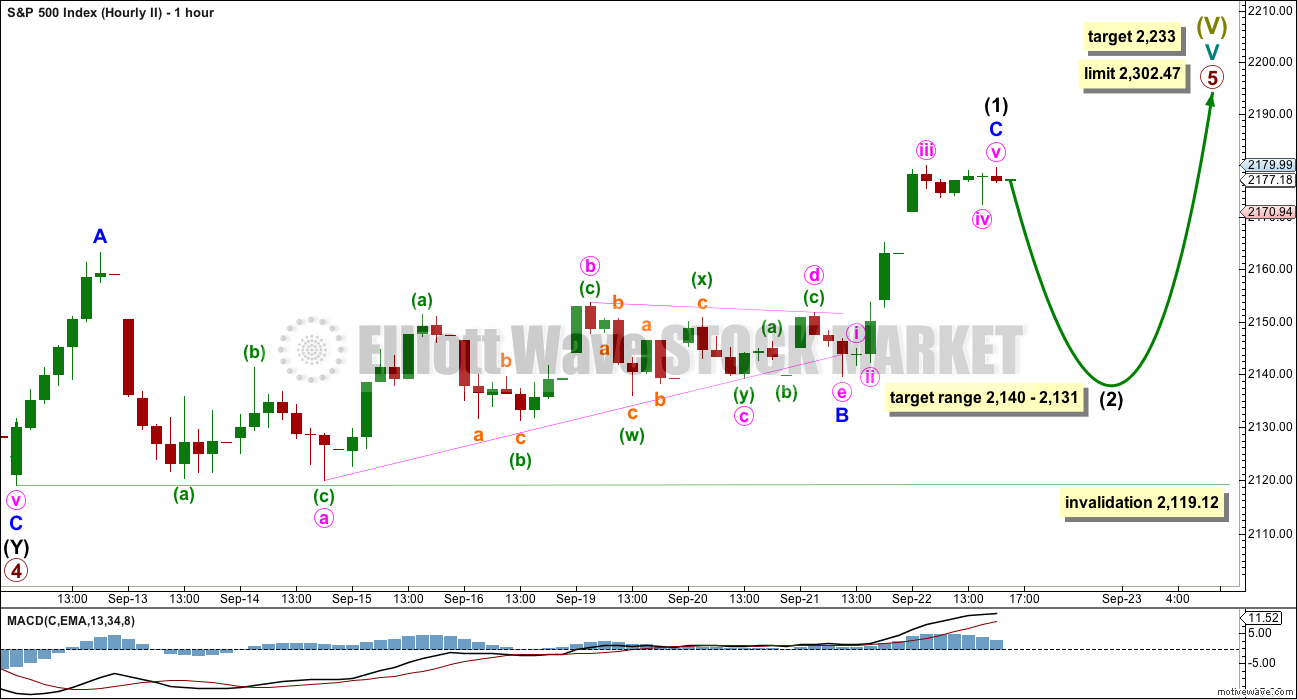
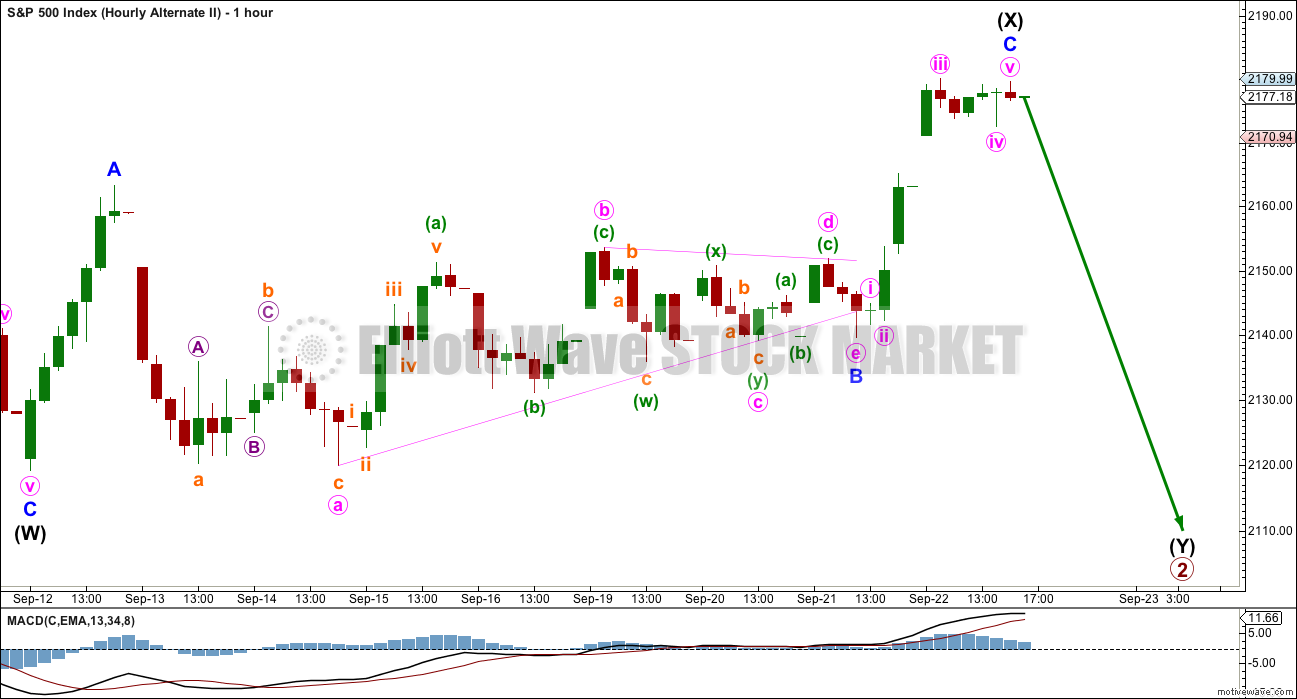
If primary wave 5 is subdividing as an ending diagonal, then all sub-waves must subdivide as zigzags. Intermediate wave (1) may again be a completed zigzag.
Second and fourth waves within diagonals have a normal depth of from 0.66 to 0.81 the prior wave. This gives a target range for intermediate wave (2) from 2,140 to 2,131. If intermediate wave (1) moves higher, then this target range must be recalculated.
Intermediate wave (2) must subdivide as a zigzag. It may not move beyond the start of intermediate wave (1) below 2,119.12.
ALTERNATE WAVE COUNT
WEEKLY CHART
Click chart to enlarge.
What if an impulse upwards is complete? The implications are important. If this is possible, then primary wave 1 within cycle wave V may be complete.
With downwards movement from the high of primary wave 1 now clearly a three and not a five, the possibility that cycle wave V and Super Cycle wave (V) are over has substantially reduced. This possibility would be eliminated if price can make a new all time high above 2,193.81.
If an impulse upwards is complete, then a second wave correction may be unfolding for primary wave 2. Expectations on how deep primary wave 2 is likely to be are now adjusted. It may be expected now to more likely only reach the 0.382 Fibonacci ratio about 2,038.
At this stage, it looks like price has found strong support at the lilac trend line.
Primary wave 2 may not move beyond the start of primary wave 1 below 1,810.10.
DAILY CHART
Click chart to enlarge.
If an impulse upwards is complete, then how may it subdivide and are proportions good?
Intermediate wave (1) was an impulse lasting 47 days. Intermediate wave (2) was an expanded flat lasting 47 days. Intermediate wave (3) fits as an impulse lasting 16 days, and it is 2.04 points short of 0.618 the length of intermediate wave (1). So far this alternate wave count is identical to the main wave count (with the exception of the degree of labelling, but here it may also be moved up one degree).
Intermediate wave (4) may have been a running contracting triangle lasting 22 days and very shallow at only 0.0027 the depth of intermediate wave (3). At its end it effected only a 0.5 point retracement. There is perfect alternation between the deeper expanded flat of intermediate wave (2) and the very shallow triangle of intermediate wave (4). All subdivisions fit and the proportion is good.
Intermediate wave (5) would be very brief at only 18.29 points. Intermediate wave (5) is 1.43 points longer than 0.056 the length of intermediate wave (1).
At this stage, primary wave 2 now has a completed zigzag downwards that did not reach the 0.236 Fibonacci ratio. It is very unlikely for this wave count that primary wave 2 is over there; the correction is too brief and shallow. Upwards movement labelled intermediate wave (X) is so far less than 0.9 the length of the prior wave down labelled intermediate wave (W). The minimum for a flat correction has not yet been met. Primary wave 2 may continue lower as a double zigzag. A second zigzag in the double may be required to deepen the correction closer to the 0.382 Fibonacci ratio.
Intermediate wave (W) lasted a Fibonacci 13 sessions. Intermediate wave (X) has now lasted a Fibonacci eight sessions. If intermediate wave (Y) is equal in duration with intermediate wave (W), that would give the wave count a satisfying look.
Primary wave 2 may not move beyond the start of primary wave 1 below 1,810.10. A new low below this point would see the degree of labelling within cycle wave V moved up one degree. At that stage, a trend change at Super Cycle degree would be expected and a new bear market to span several years would be confirmed.
HOURLY CHART
Click chart to enlarge.
The subdivisions for this hourly chart are the same as for the second hourly chart which looks at a diagonal. A zigzag upwards may have completed and the triangle may be minute wave b within the zigzag.
This wave count now expects downwards movement for a Fibonacci 13 sessions overall most likely, to end about 2,038.
TECHNICAL ANALYSIS
WEEKLY CHART
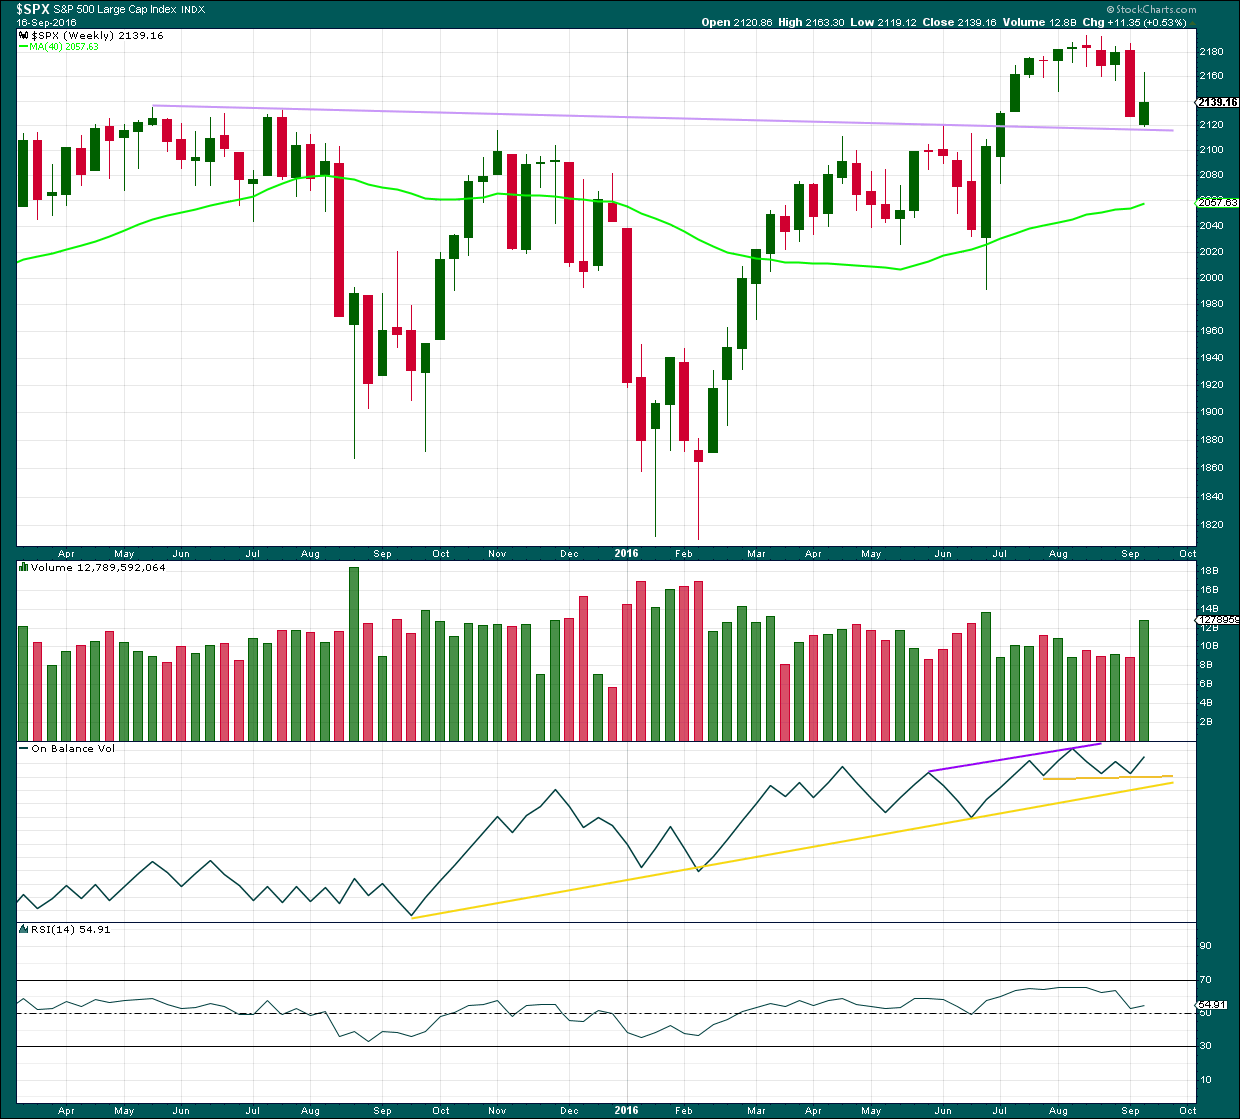
Click chart to enlarge. Chart courtesy of StockCharts.com.
Last week completes a green weekly candlestick which has found support at the lilac trend line. The long upper wick is bearish and the green colour is bullish. A strong increase in volume indicates support for overall upwards movement, but to understand more clearly what is happening last week in terms of volume we need to look inside the> week at daily volume bars.
On Balance Volume is providing a bullish signal last week with a move up and away from the short yellow trend line. There is divergence between price and OBV last week: the high for last week from price is lower than the last green weekly candlestick but OBV has made a lower high. This indicates weakness in upwards movement from price last week and it is bearish.
RSI is still just above neutral. There is room for price to rise or fall.
DAILY CHART
Click chart to enlarge. Chart courtesy of StockCharts.com.
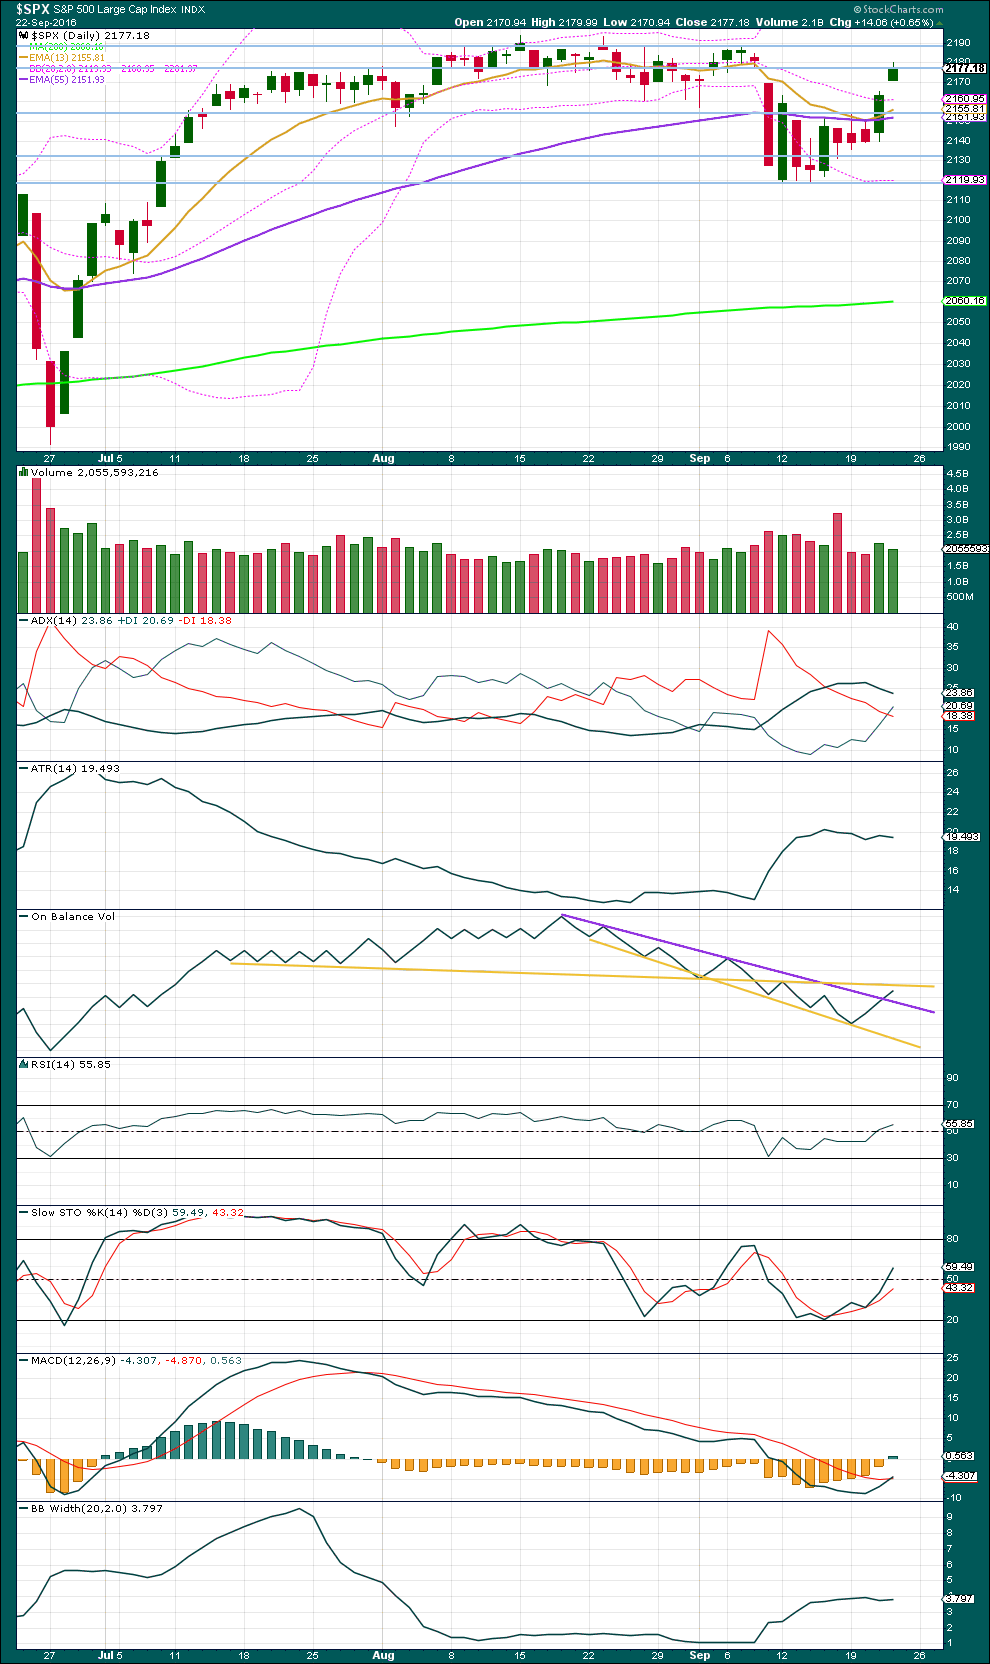
Another upwards day comes on relatively strong volume, but still lighter than the prior upwards day. The support for this rise in price is waning. It would be reasonable to expect some downwards movement for at least a day or so about here.
ADX is still declining, indicating the market is not trending. The +DX line has today crossed above the -DX line. ADX today indicates a potential trend change.
ATR is now flat to declining, in agreement with ADX that this market is not trending. Bollinger Bands remain flat and relatively tightly contracted.
The market may be again consolidating with resistance about 2,190 and support now about 2,155. Expect price to swing from resistance to support and back again, and to only end each swing when Stochastics is either extreme or very close to extreme. At this stage, overall upwards movement may be expected to continue to about 2,190. It is not reasonable to expect price to move in a straight line though, which makes trading each swing very difficult. Choppy overlapping movement may be most likely.
If ADX turns up and ATR turns up and Bollinger Bands widen, then an upwards trend may be expected.
On Balance Volume is today giving a reasonable bullish signal with a break above the purple resistance line. This is one signal that has been working relatively well for this market recently, so it is given due weight in this analysis. This signal supports the main Elliott wave count, and the first hourly chart over the second. It does not rule out the possibility of a red candlestick for tomorrow though as is being suggested by the decline in volume today, but it does suggest any downwards movement here may be limited as OBV finds support at the purple line.
RSI is above neutral. There is plenty of room for price to rise or fall. There is today no divergence between price and RSI to indicate weakness.
MACD is today giving a bullish signal with a crossover.
The shortest term Fibonacci 13 day moving average has kissed the mid term Fibonacci 55 day moving average and moved up from there. In the short term, an upwards trend is still indicated.
VOLATILITY – INVERTED VIX CHART
Click chart to enlarge. Chart courtesy of StockCharts.com.
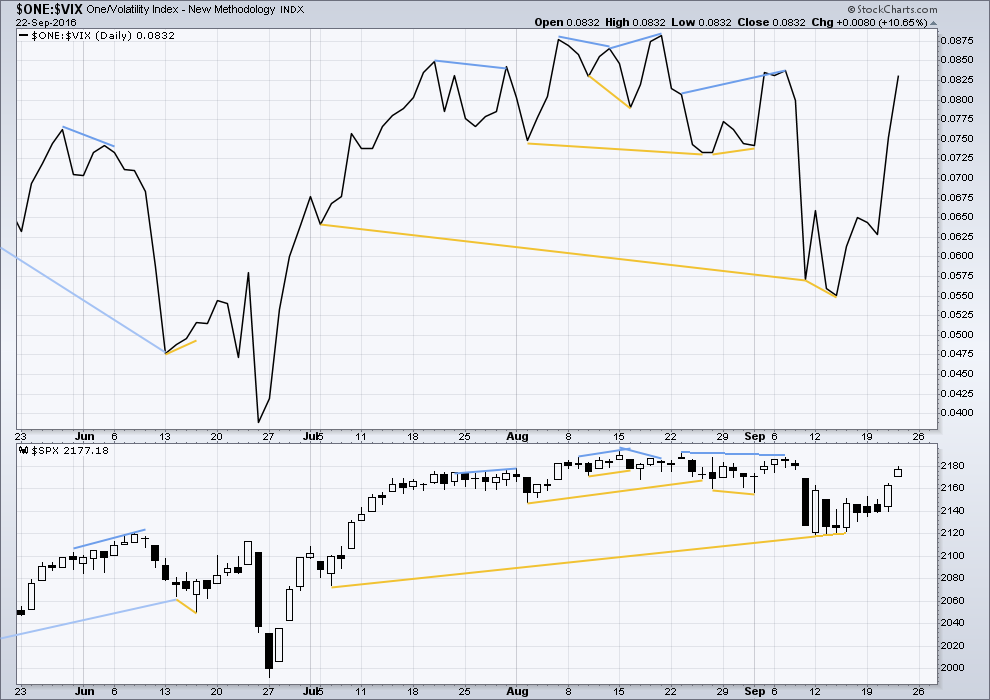
There are a few instances of multi day divergence between price and inverted VIX noted here. Bearish divergence is blue. Bullish divergence is yellow. It appears so far that divergence between inverted VIX and price is again working to indicate short term movements spanning one or two days.
VIX (inverted) moved strongly higher today as volatility declined. At this stage, no further short term divergence is noted between price and VIX to indicate any weakness either way.
BREADTH – AD LINE
Click chart to enlarge. Chart courtesy of StockCharts.com.
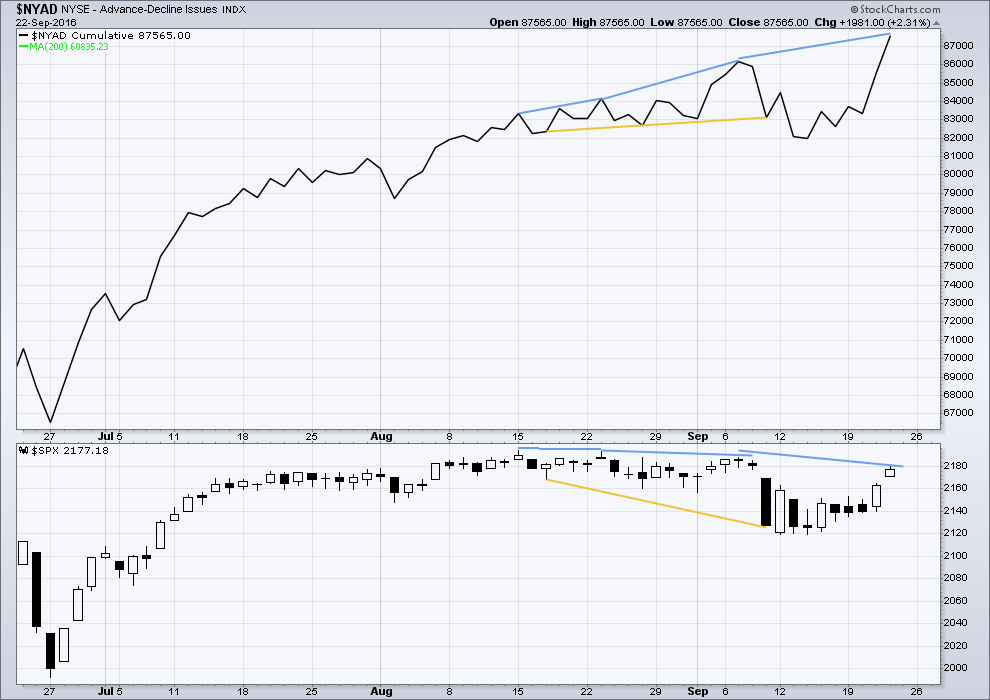
There is support from market breadth as price is rising.
Short term bullish and bearish divergence is again working between price and the AD line to show the direction for the following one or two days.
There is today mid term bearish divergence between price and the AD line. The AD line today made a new all time high, but price has not yet followed. This divergence suggests weakness in price. It may be followed by one or two days of downwards movement.
DOW THEORY
Major lows within the old bull market:
DJIA: 15,855.12 (15th October, 2014) – closed below on 25th August, 2015.
DJT: 7,700.49 (12th October, 2014) – closed below on 24th August, 2015.
S&P500: 1,821.61 (15th October, 2014) – has not closed below this point yet.
Nasdaq: 4,117.84 (15th October, 2014) – has not closed below this point yet.
Major highs within the bear market from November 2014:
DJIA: 17,977.85 (4th November, 2015) – closed above on 18th April, 2016.
DJT: 8,358.20 (20th November, 2015) – has not closed above this point yet.
S&P500: 2,116.48 (3rd November, 2015) – closed above this point on 8th June, 2016.
Nasdaq: 5,176.77 (2nd December, 2015) – closed above this point on 1st August, 2016.
Dow Theory Conclusion: Original Dow Theory still sees price in a bear market because the transportations have failed to confirm an end to that bear market. Modified Dow Theory (adding S&P and Nasdaq) has failed still to confirm an end to the old bull market, modified Dow Theory sees price still in a bull market.
This analysis is published @ 10:35 p.m. EST.
Sneaky Bears! 🙂 🙂 🙂
Looks like minor five it is as the bears retreat to fight another day.
Have a great week-end everybody!
See ya in the trenches next week GW! ‘Bye!
Have a fabulous weekend Verne. Get some sun and relaxation there.
Looks to me like the bears are begging to differ- “Not quite so fast there youse banksters!”
Will we have a minor five up intermediate three up?
Or will the bears force an intermediate Y of primary two down?
This ought to be fascinating! 🙂
I think they are going to keep us hanging ’till the very last tick of the tape…
Updated first hourly chart, for the main wave count.
Both minor 2 and 4 now show on the daily chart. The proportions are good. But now this wave count (all wave counts at the hourly chart level) must see a truncation of 0.41 points for minute v of minor 3.
Minor 3 at 40.01 points is longer than minor 1. There is no Fibonacci ratio between them.
Shiver me timbers! We’re getting REEL close…! (as in pulling in a big tuna!) 🙂
Maybe it’ll end in October.
Possibly.
All Righty Then!
Here comes the cash dump.
Let’s see what the bears think about that…. 🙂
This has to be the ultimate irony.
Did anybody know that the Federal Government just hijacked the FED?
Apparently in one fell swoop thy reduced their reserves by a whopping 33%! Ouch!
I don’t even want to know what their capital ration now looks like- and I thought they were in deep doo doo prior this little stunt by the geniuses in DC
You cannot make this stuff up. How come nobody reported this? I think it is big news!
https://www.sovereignman.com/trends/federal-reserves-net-worth-collapses-33-in-two-weeks-18532/?inf_contact_key=3d150b89de8a87b860202c6f8861898d8b4d5e3563584eedffba2f217055a424
A great read, Vern. Thanks. It will not take much of a crisis to eat up the less than 1% capital of the Fed. $39 billion can go in a second. It’s chump change for the size of the system at hand. On top of it all, 50% of their assets are US Government Bonds. They are next to worthless and will never be paid off. Never.
Today’s closing of the gap from yesterday is the test and reset for the next push up to 2200. If the round number breaks, we move to 2040 or thereabouts which may be the end of this. But a move to a higher target is certainly not out of the question. I’d love to see a blow off top to 2300 in a few days with all the BB’s being exceeded as they do at tops. We have not had one of those in a long time. Set up into the US election will take place in the next weeks. If my memory is correct, oftentimes the US Presidential election evokes a big move for several days.
The FED indeed is INSOLVENT!
Is anyone else seeing a possible truncated fifth on this last move up?
There is a real cat and mouse game afoot. Look for some action into the close….
Yep. That’s how I’m seeing it for the second hourly chart, and for the hourly chart for the alternate. The truncation is small, only 0.41 points.
For the first hourly chart…. seeing this as minute iv just doesn’t look right. It’s out of proportion to minute ii.
For the first hourly chart it may be minor 4.
Aha! 🙂
DJI gap from Wednesday’s close filled. SPX and NDX remain open which could signal some bullish divergence. If they all close, I will be nibbling on some shortcake… 🙂
Odds favor a fill as SPX already traded below Wednesday’s high….
The “Lords of Liquidity” (yep! Just another name for you-know- who!) need to make another big cash dump prior to the close. This is already looking too long to be a minute four wave and if this slow drift down continues we could see a hard fall next week. If we close at the lows, will reload SPY puts for another visit down below….just how deep, no one knows, but I think deep enough to warrant another short side excursion…
I am taking the money and running on my call of the bankster bluff in the form of 218 strike SPY puts. Showing a nice pop of 35%. I generally don’t like to challenge the banksters directly but I still think they are full of it. We’re now in an area of humongous overhead supply and they need to clear and hold 2185 for me to pay them any respect. Until then, I will continue to sell the rips.
FIRST!!!