
Sideways movement was expected but did no happen.
The session ended with some reasonable upwards movement.
Summary: Volume suggests more upwards movement tomorrow. A new high above 2,171.25 would invalidate the alternate and provide some confirmation of the main wave count. The target is at 2,233. A new low below 2,111.05 would invalidate the main Elliott wave count and confirm the alternate.
Last monthly chart for the main wave count is here.
New updates to this analysis are in bold.
MAIN WAVE COUNT
WEEKLY CHART
Click chart to enlarge.
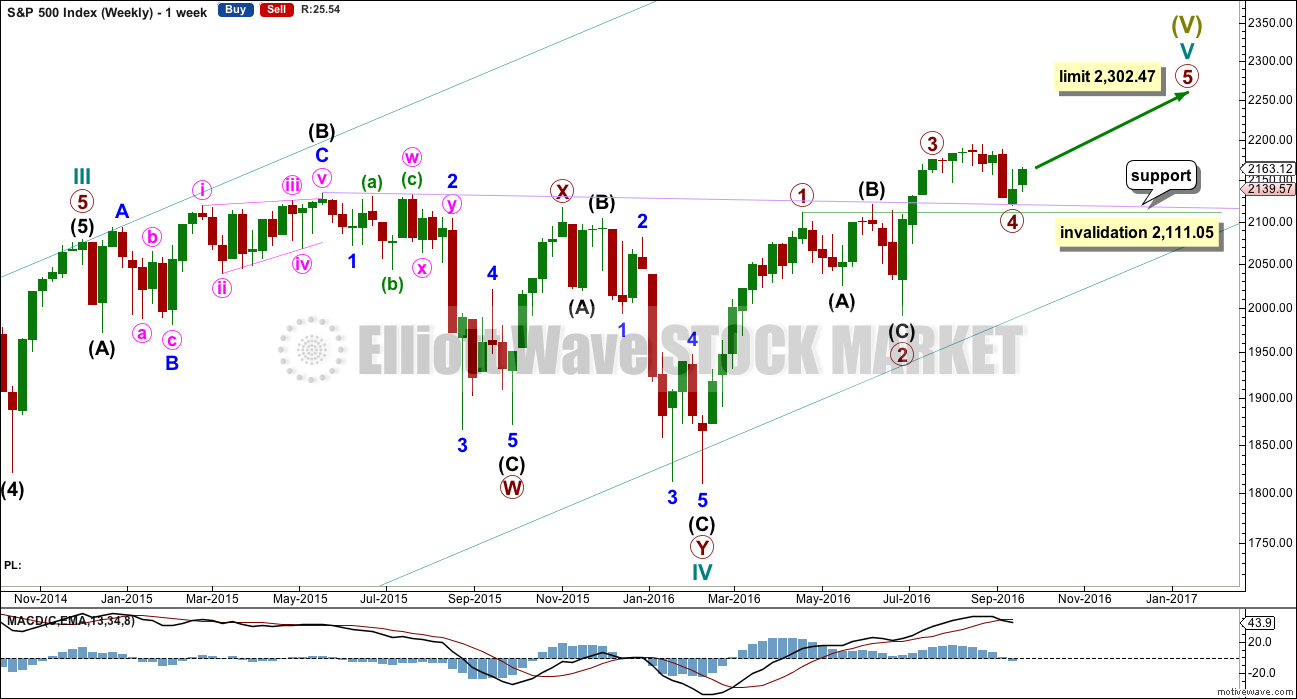
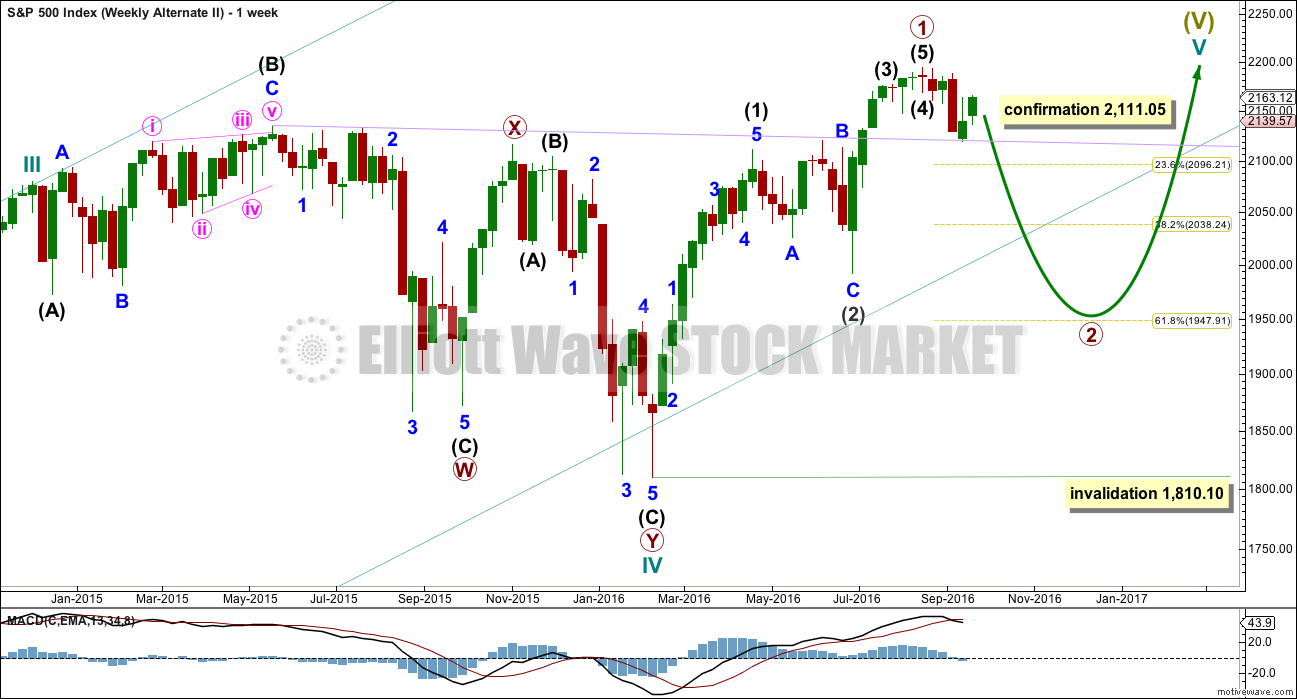
Cycle wave V must subdivide as a five wave structure. I have two wave counts for upwards movement of cycle wave V. This main wave count is presented first only because we should assume the trend remains the same until proven otherwise. Assume that downwards movement is a correction within the upwards trend, until proven it is not.
Primary wave 3 is shorter than primary wave 1, but shows stronger momentum and volume as a third wave normally does. Because primary wave 3 is shorter than primary wave 1 this will limit primary wave 5 to no longer than equality in length with primary wave 3, so that the core Elliott wave rule stating a third wave may not be the shortest is met. Primary wave 5 has a limit at 2,302.47.
Primary wave 2 was a shallow 0.40 expanded flat correction. Primary wave 4 may be exhibiting alternation as a more shallow combination.
Primary wave 4 may not move into primary wave 1 price territory below 2,111.05.
It is also possible to move the degree of labelling within cycle wave V all down one degree. It may be only primary wave 1 unfolding. The invalidation point for this idea is at 1,810.10. That chart will not be published at this time in order to keep the number of charts manageable. The probability that this upwards impulse is only primary wave 1 is even with the probability that it is cycle wave V in its entirety.
DAILY CHART
Click chart to enlarge.
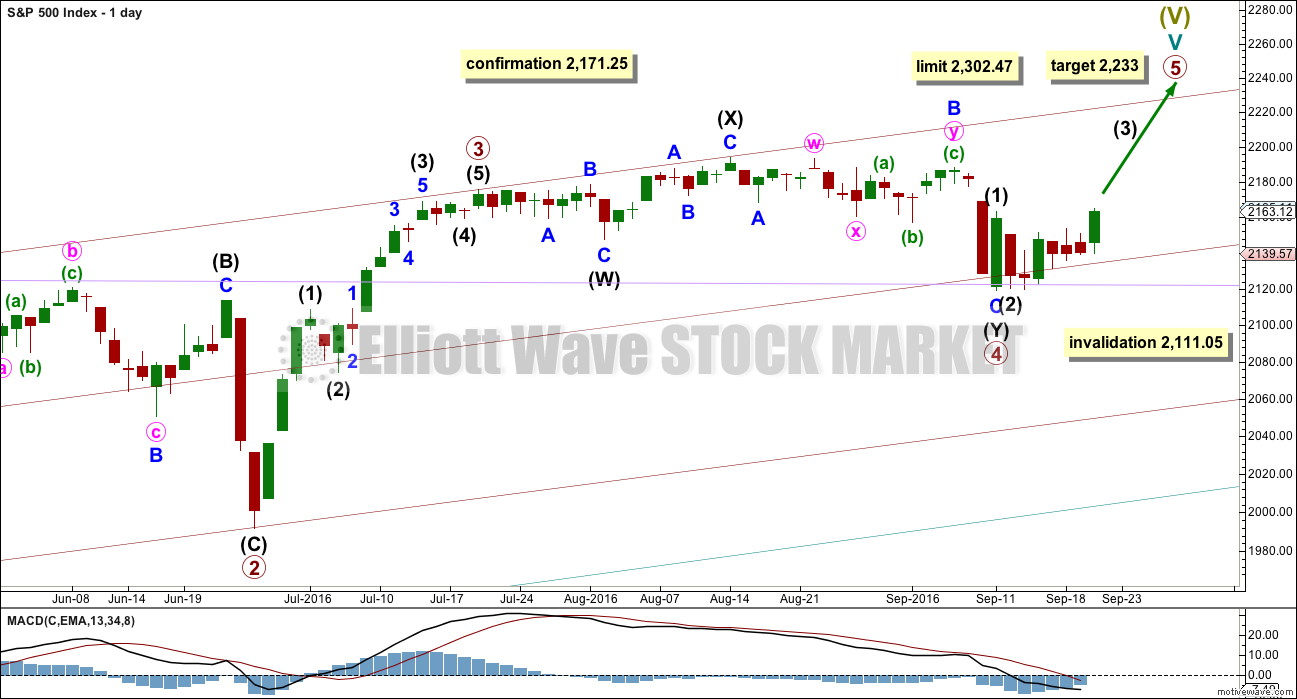
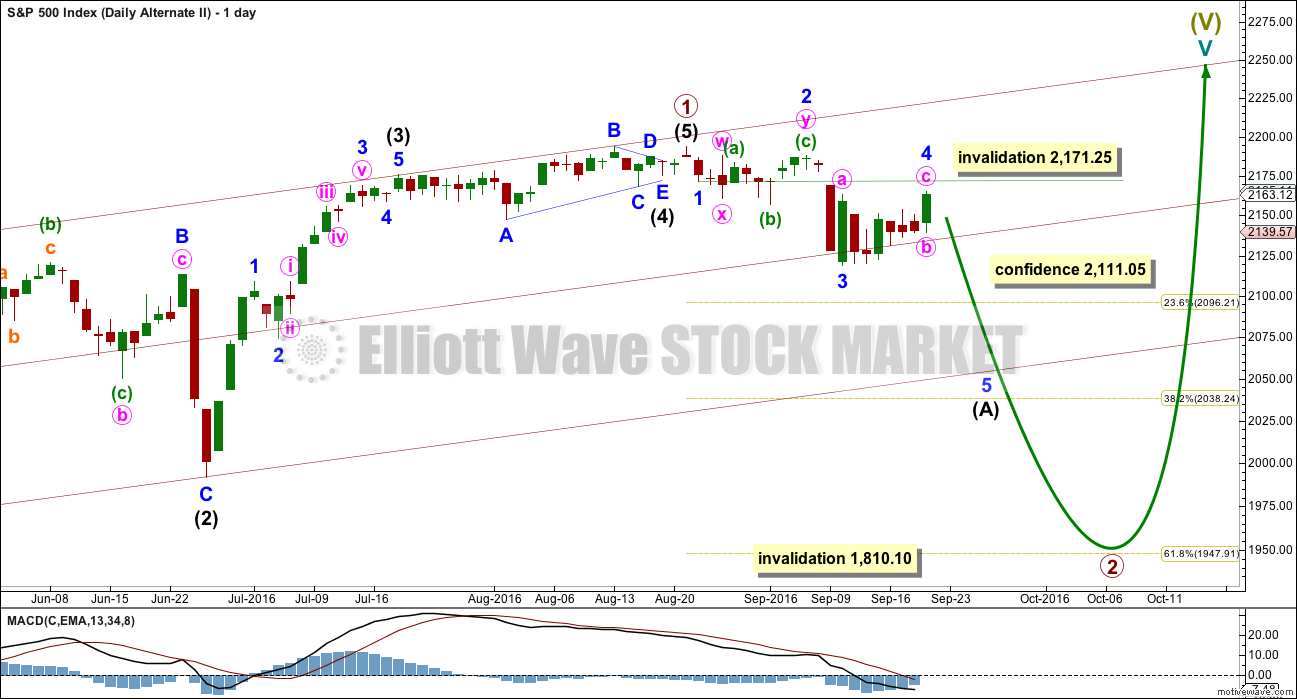
Primary wave 4 may be now complete as a double combination.
The first structure in the double is labelled intermediate wave (W) and is an expanded flat correction. The double is joined by a three in the opposite direction labelled intermediate wave (X). The second structure in the double is a zigzag labelled intermediate wave (Y).
The whole structure for primary wave 4 has a mostly sideways look, but the fact that intermediate wave (Y) has ended comfortably below the end of intermediate wave (W) must necessarily reduce the probability of this wave count. To achieve the purpose of taking up time and moving price sideways the second structure in a double should end close to the same level as the first and this one does not. This part of the wave count does not have the right look.
Primary wave 4 may not move into primary wave 1 price territory below 2,111.05.
Primary wave 1 lasted 47 days, primary wave 2 was even in duration at 47 days, primary wave 3 lasted 16 days, and so far primary wave 4 has lasted 39 days. The proportions between these waves are acceptable.
If primary wave 5 has begun here, then at 2,233 it would reach 0.618 the length of primary wave 1.
A new high above 2,171.25 would invalidate the alternate daily wave count below and provide some confirmation of this main wave count. A new high finally above 2,187.87 would provide further confidence in this main wave count; that would invalidate other scenarios for the alternate.
There are two possible structures for primary wave 5: either an impulse (more likely) or an ending diagonal (less likely). It is now time to separate these two possibilities into two separate charts at the hourly chart level.
FIRST HOURLY CHART
Click chart to enlarge.
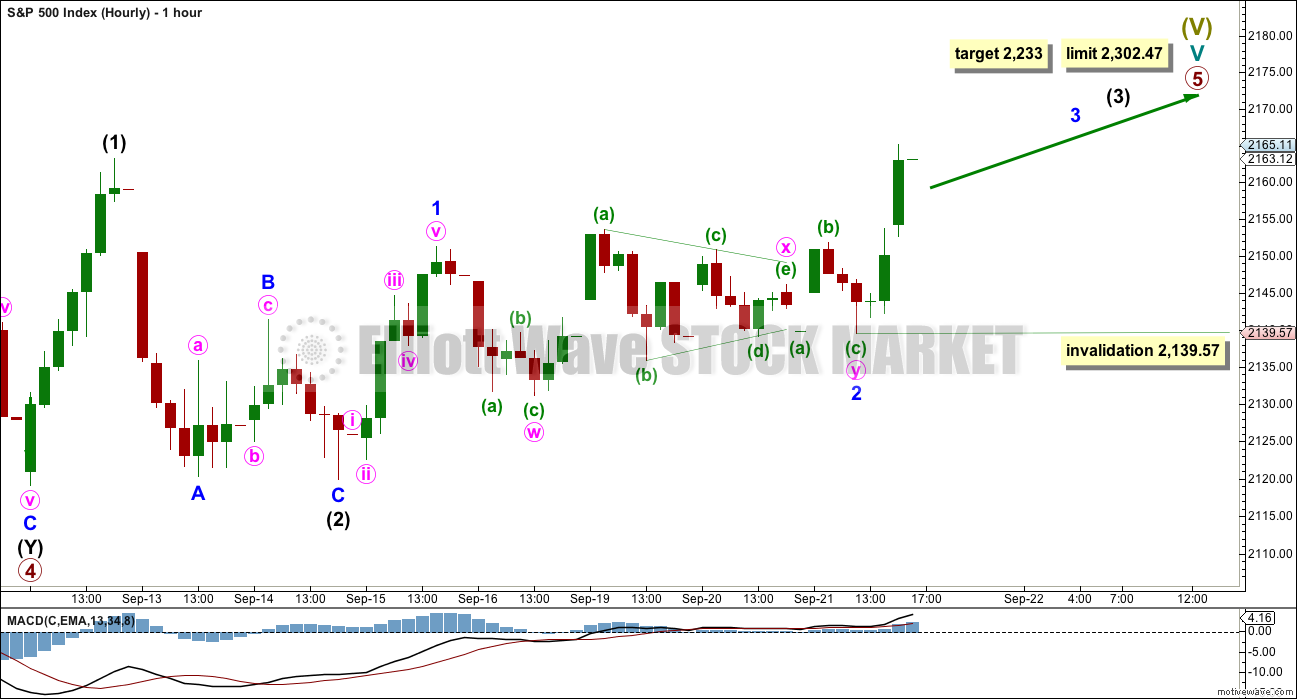
The more common structure for a fifth wave is an impulse, so this is the first hourly wave count. It has a higher probability than the second based upon being a more common structure.
If an impulse upwards is unfolding for primary wave 5, then within it intermediate waves (1) and (2) would be complete. Intermediate wave (3) may only subdivide as a five wave impulse and must move above the end of intermediate wave (1) at 2,163.30.
Within intermediate wave (3), minor waves 1 and now 2 would be complete. Minor wave 2 fits as a double combination: zigzag – X – flat.
Minor wave 3 within intermediate wave (3) should have begun. This wave count expects to see an increase in upwards momentum.
Within minor wave 3, no second wave correction may move beyond its start below 2,139.97.
SECOND HOURLY CHART
Click chart to enlarge.
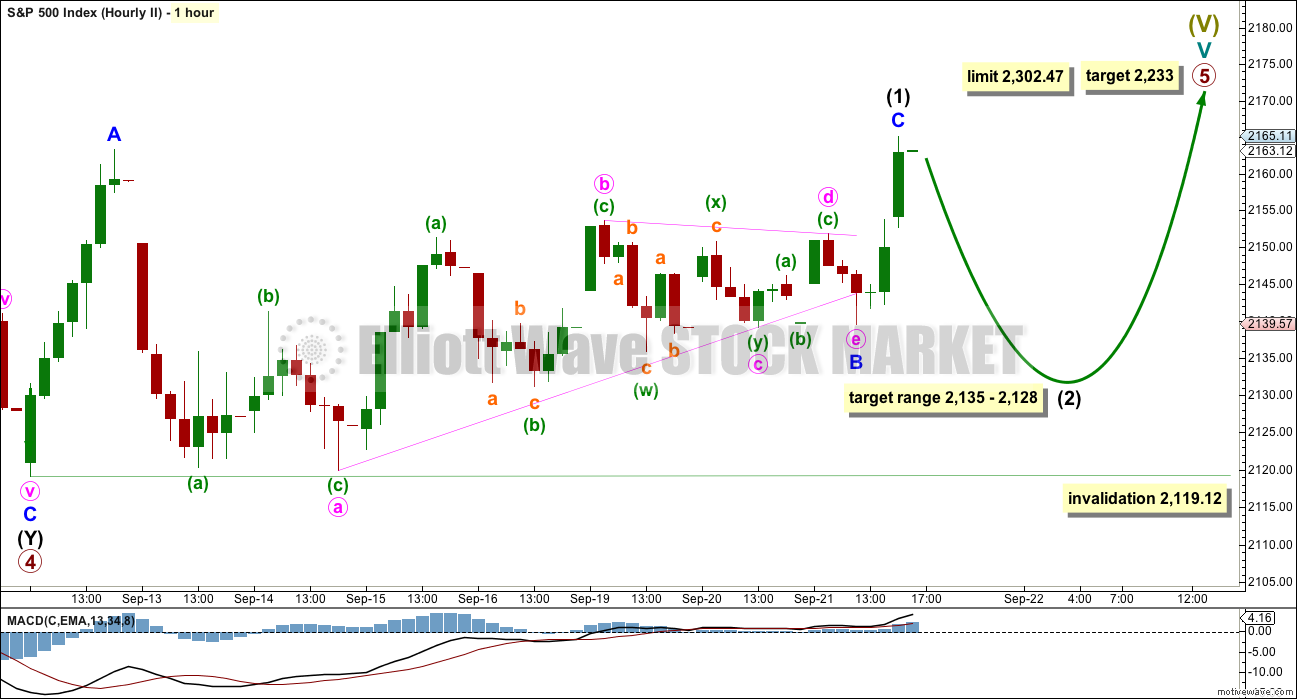
If primary wave 5 is subdividing as an ending diagonal, then all sub-waves must subdivide as zigzags. Intermediate wave (1) may now be a completed zigzag.
Second and fourth waves within diagonals have a normal depth of from 0.66 to 0.81 the prior wave. This gives a target range for intermediate wave (2) from 2,135 to 2,128.
Intermediate wave (2) must subdivide as a zigzag. It may not move beyond the start of intermediate wave (1) below 2,119.12.
ALTERNATE WAVE COUNT
WEEKLY CHART
Click chart to enlarge.
What if an impulse upwards is complete? The implications are important. If this is possible, then primary wave 1 within cycle wave V may be complete.
If the degree of labelling within cycle wave V is moved up one degree, then it is possible that recently Super Cycle wave (V) ended and the S&P has just begun a very large bear market to span several years. This scenario is possible, but absolutely requires price confirmation before it can be taken seriously. Only a new low below 1,810.10 would confirm this very bearish scenario.
If an impulse upwards is complete, then a deep second wave correction may be unfolding for primary wave 2. If primary wave 2 is to reach as low as the 0.618 Fibonacci ratio, then it would break below the larger teal channel about Super Cycle wave (V), which is copied over here from the monthly chart. This is possible: the S&P does tend to break out of its channels towards the end of a movement yet still continues in the prior direction before turning.
Primary wave 2 may not move beyond the start of primary wave 1 below 1,810.10.
DAILY CHART
Click chart to enlarge.
If an impulse upwards is complete, then how may it subdivide and are proportions good?
Intermediate wave (1) was an impulse lasting 47 days. Intermediate wave (2) was an expanded flat lasting 47 days. Intermediate wave (3) fits as an impulse lasting 16 days, and it is 2.04 points short of 0.618 the length of intermediate wave (1). So far this alternate wave count is identical to the main wave count (with the exception of the degree of labelling, but here it may also be moved up one degree).
Intermediate wave (4) may have been a running contracting triangle lasting 22 days and very shallow at only 0.0027 the depth of intermediate wave (3). At its end it effected only a 0.5 point retracement. There is perfect alternation between the deeper expanded flat of intermediate wave (2) and the very shallow triangle of intermediate wave (4). All subdivisions fit and the proportion is good.
Intermediate wave (5) would be very brief at only 18.29 points. Intermediate wave (5) is 1.43 points longer than 0.056 the length of intermediate wave (1).
So far primary wave 2 may be unfolding as a zigzag. The common depth for a second wave is the 0.618 Fibonacci ratio of the first wave it is correcting, so a reasonable expectation for primary wave 2 would be to end about 1,948.
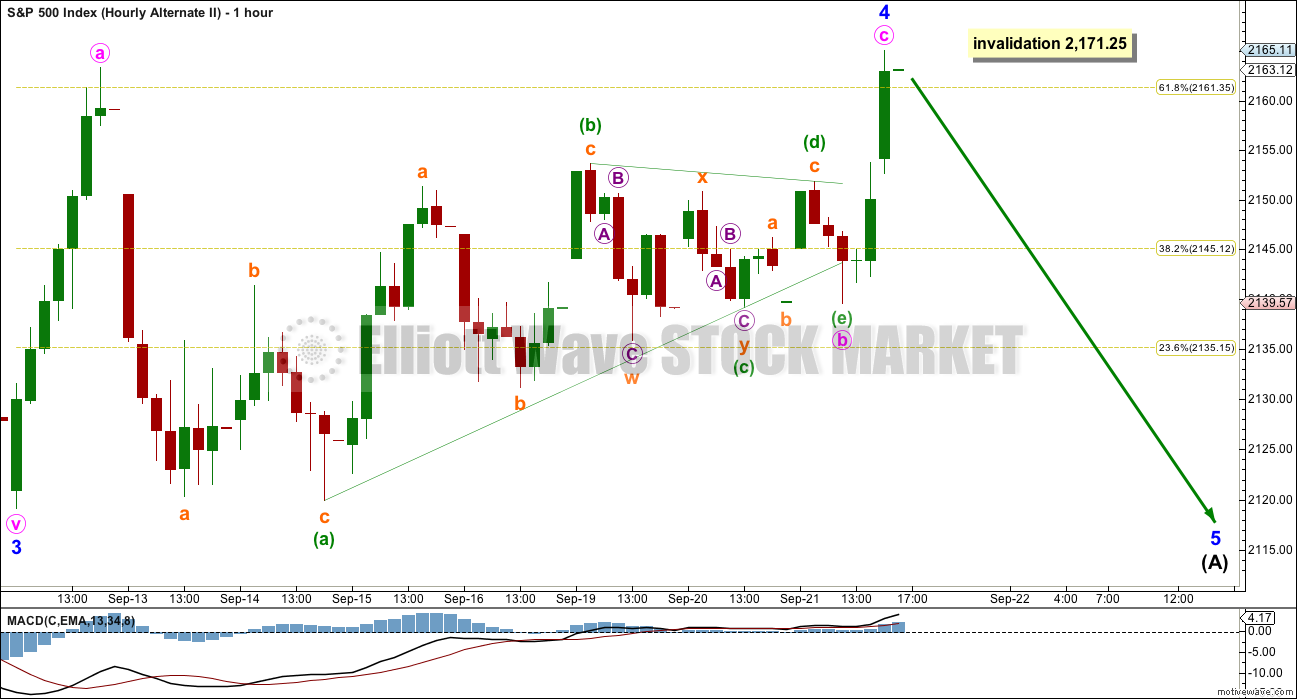
The triangle labelled in yesterday’s analysis for minor wave 4 was invalidated. The triangle may have been minute wave b within a zigzag for minor wave 4. There is still alternation between the combination of minor wave 2 and a zigzag of minor wave 4.
Minor wave 4 may not move into minor wave 1 price territory above 2,171.25.
Primary wave 2 may not move beyond the start of primary wave 1 below 1,810.10. A new low below this point would see the degree of labelling within cycle wave V moved up one degree. At that stage, a trend change at Super Cycle degree would be expected and a new bear market to span several years would be confirmed.
HOURLY CHART
Click chart to enlarge.
With MACD strongly suggesting a triangle unfolded, any wave count which sees a triangle for recent movement should have a higher probability.
The subdivisions for this hourly chart are the same as for the second hourly chart which looks at a diagonal. A zigzag upwards may have completed today and the triangle may be minute wave b within the zigzag.
Minor wave 4 should now be complete ending close to the 0.618 Fibonacci ratio of minor wave 3. Minor wave c has moved slightly above the end of minute wave a avoiding a truncation.
This wave count now expects downwards movement tomorrow as a fifth wave unfolds.
TECHNICAL ANALYSIS
WEEKLY CHART
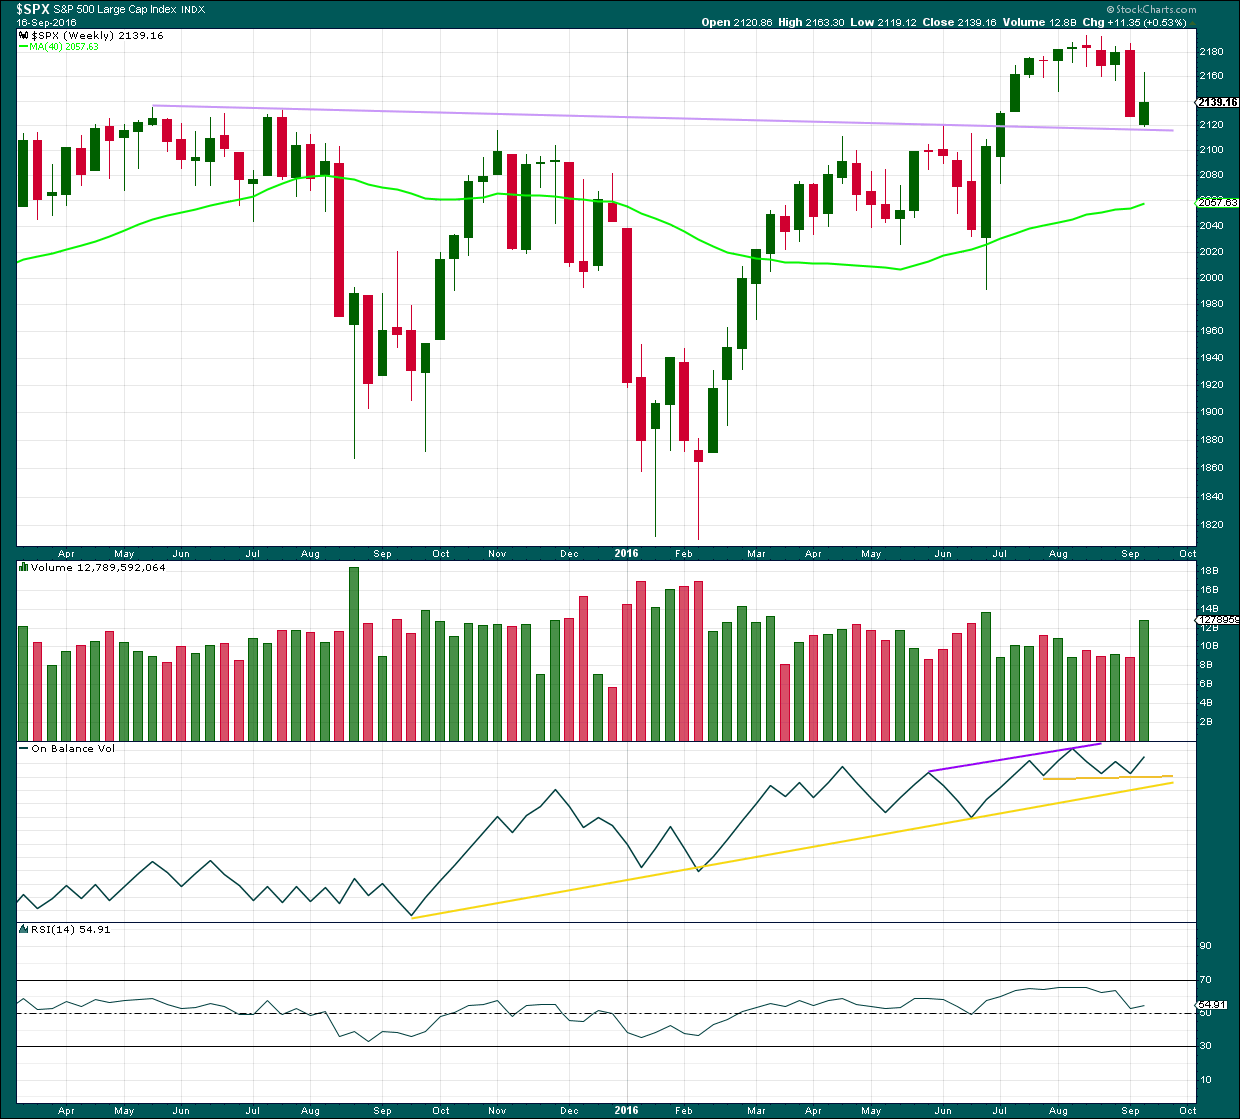
Click chart to enlarge. Chart courtesy of StockCharts.com.
Last week completes a green weekly candlestick which has found support at the lilac trend line. The long upper wick is bearish and the green colour is bullish. A strong increase in volume indicates support for overall upwards movement, but to understand more clearly what is happening last week in terms of volume we need to look inside the> week at daily volume bars.
On Balance Volume is providing a bullish signal last week with a move up and away from the short yellow trend line. There is divergence between price and OBV last week: the high for last week from price is lower than the last green weekly candlestick but OBV has made a lower high. This indicates weakness in upwards movement from price last week and it is bearish.
RSI is still just above neutral. There is room for price to rise or fall.
DAILY CHART
Click chart to enlarge. Chart courtesy of StockCharts.com.
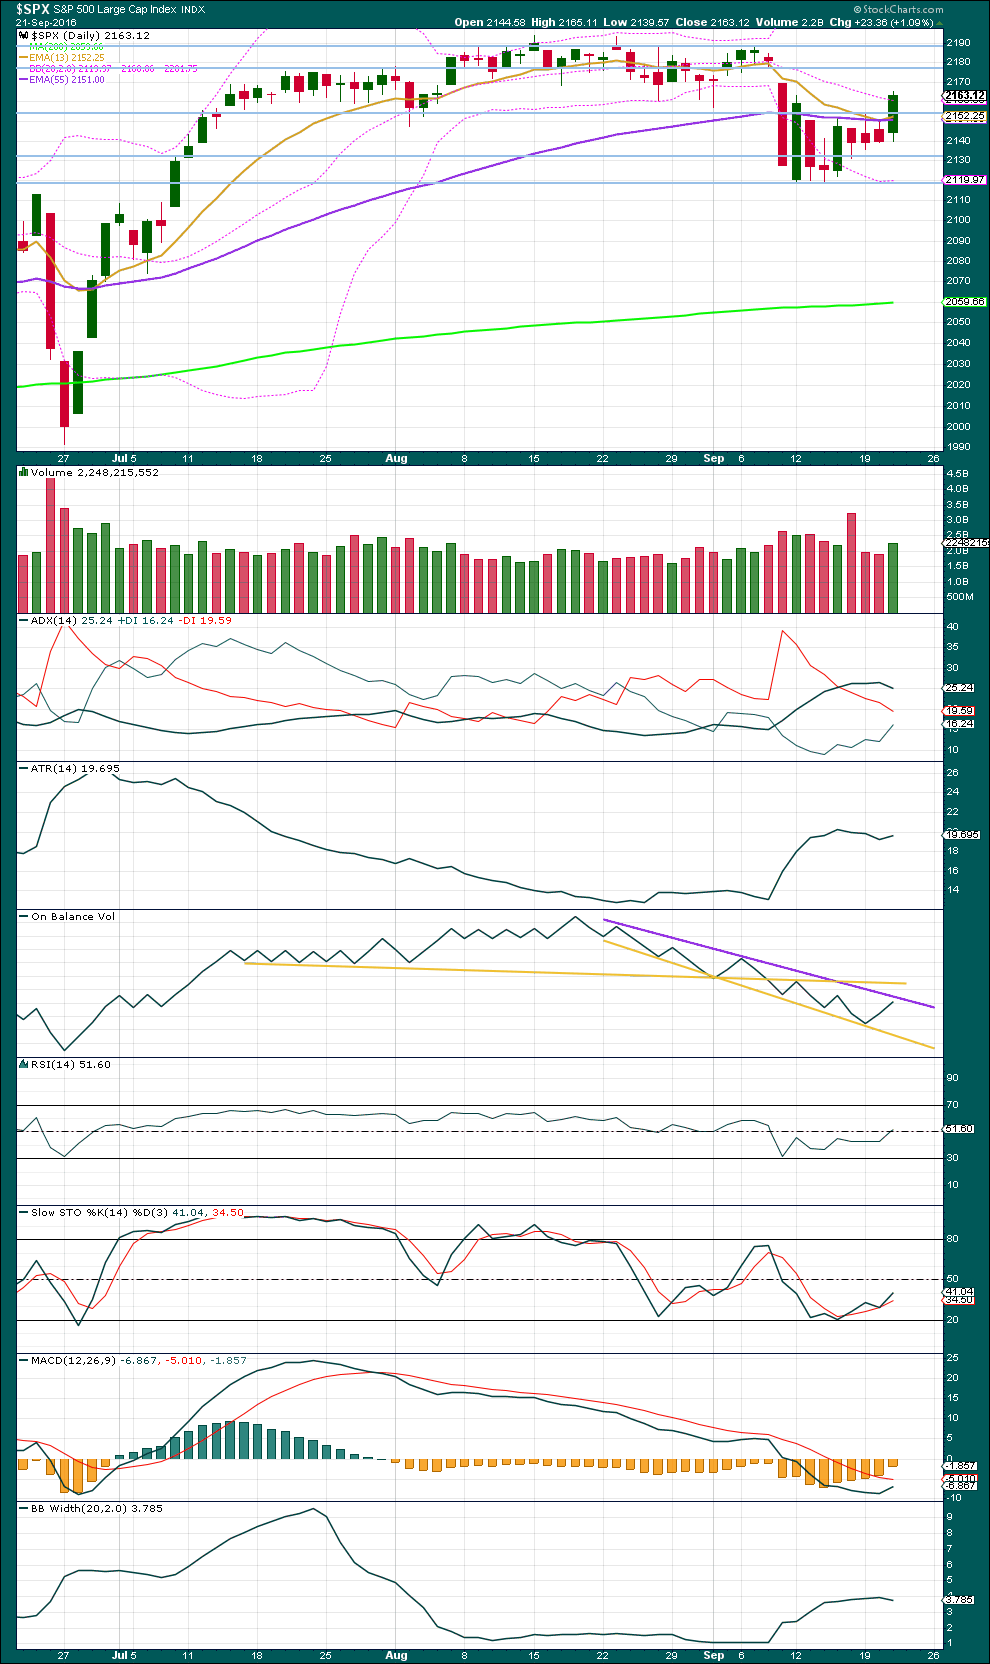
An increase in volume for a relatively strong upwards day is bullish. This suggests more upwards movement ahead. This supports the main Elliott wave count and the first hourly chart for it.
Price is now back in a highly congested zone with support about 2,155 and resistance about 2,190. Some hesitation about here would be a reasonable expectation.
ADX is today declining, indicating the market is not currently trending. The -DX line remains above the +DX line. If a trend returns at this stage, it would be down.
ATR is overall flat in agreement with ADX. Bollinger Bands are contracted and currently steady, mostly in agreement with ADX and ATR. At this stage, these indicators are all signalling no clear trend.
On Balance Volume gave a bullish signal when it bounced up from the lower yellow support line. Now it has come up today to almost touch the purple resistance line. If OBV breaks above this line tomorrow, it would be a reasonable bullish signal and would be given weight in this analysis. If OBV turns down from this line, that would be a reasonable bearish signal and also would be given reasonable weight in this analysis.
RSI is very close to neutral. There is plenty of room for price to rise or fall. There is no divergence between price and RSI at this stage to indicate weakness.
VOLATILITY – INVERTED VIX CHART
Click chart to enlarge. Chart courtesy of StockCharts.com.
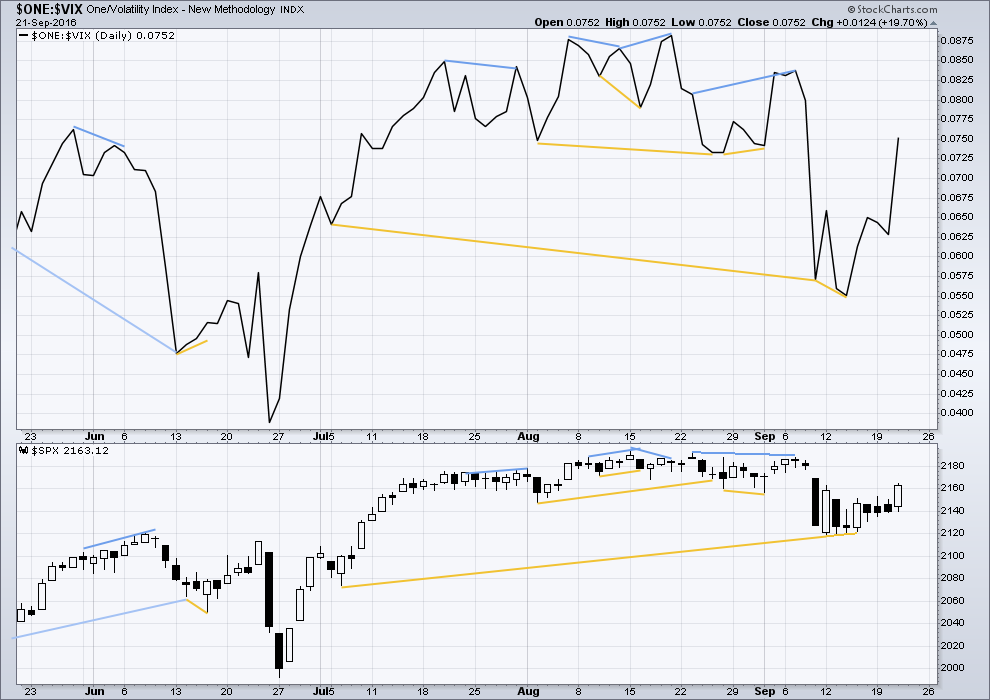
Volatility is declining as price is rising. This is normal for an upwards trend.
There are a few instances of multi day divergence between price and inverted VIX noted here. Bearish divergence is blue. Bullish divergence is yellow. It appears so far that divergence between inverted VIX and price is again working to indicate short term movements spanning one or two days.
At this stage, no further short term divergence is noted between price and VIX to indicate any weakness either way.
BREADTH – AD LINE
Click chart to enlarge. Chart courtesy of StockCharts.com.
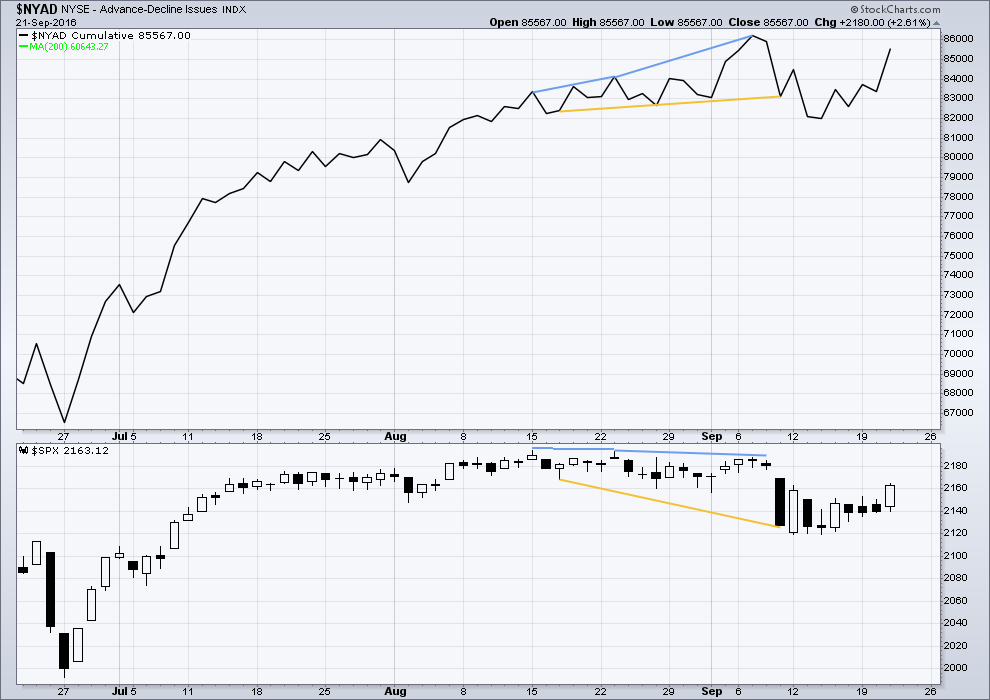
There is support from market breadth as price is rising.
Short term bullish and bearish divergence is again working between price and the AD line to show the direction for the following one or two days.
There is no short term divergence to indicate weakness.
DOW THEORY
Major lows within the old bull market:
DJIA: 15,855.12 (15th October, 2014) – closed below on 25th August, 2015.
DJT: 7,700.49 (12th October, 2014) – closed below on 24th August, 2015.
S&P500: 1,821.61 (15th October, 2014) – has not closed below this point yet.
Nasdaq: 4,117.84 (15th October, 2014) – has not closed below this point yet.
Major highs within the bear market from November 2014:
DJIA: 17,977.85 (4th November, 2015) – closed above on 18th April, 2016.
DJT: 8,358.20 (20th November, 2015) – has not closed above this point yet.
S&P500: 2,116.48 (3rd November, 2015) – closed above this point on 8th June, 2016.
Nasdaq: 5,176.77 (2nd December, 2015) – closed above this point on 1st August, 2016.
Dow Theory Conclusion: Original Dow Theory still sees price in a bear market because the transportations have failed to confirm an end to that bear market. Modified Dow Theory (adding S&P and Nasdaq) has failed still to confirm an end to the old bull market, modified Dow Theory sees price still in a bull market.
This analysis is published @ 10:16 p.m. EST.
Well, two less charts? Except…. I can see the possibility that primary wave 2 (for the alternate this is ) could be ending as a flat, combination or double zigzag. So unfortunately, I must be honest and keep publishing that.
Short term, it looks like a small impulse is completing, currently in a fourth wave. For the main / first hourly chart I have it at minute degree.
Indeed! I sure hope P2 is not done as I went out of character and called the banksters bluff by shorting this rally at the highs of the day. The banksters have deeper pockets so I’ll probably have capitulate if we take out 2185.
What’s life without a little risk huh? 🙂
Quite a few savvy traders have concluded that VIX recently issued a market buy signal because of its action around its BBs. While that signal is generally quite reliable, here’s the problem I see with that conclusion. The BBs have been incredibly compressed for several weeks now and even the slightest increase in volatility was sufficient to breach the upper band. It is generally true that extended periods of very low volatility are followed by a period where volatility spikes higher. Considering how long the VIX bands have been compressed I seriously doubt we are ready to return to an extended period of low volatility as recent downward movement in the market has done little to dispel remarkable complacency in market participants. A sustained run higher would natrually imply such another extended low vol period. I am not so certain that such is the case.
Scintillating observations from Bill Bonner on Yellen’s performance yesterday:
” Instead, the poor woman is condemned to ply her voodoo trade, pretending that it is based on science, and feigning that it improved the economy.
Pity the economist without a sense of humor…
His head must ache when he hears Ms. Yellen talk. His heart must break when he sees his profession brought to ridicule by its most prominent practitioners. His gloom must deepen into a profound darkness, as he watches the world’s No. 1 economy manipulated by nincompoops and scoundrels.
Worse, if he expects any kind of career, fame, or fortune – he must join them!”
Bill Bonner is quite a smart cookie imho – I always enjoy reading his diary updates etc. I particularly like the fact he openly admits he has no more of a clue than the next man – but it seems to have served him pretty well.
Humble and typical of someone who has made their way up from nothing, through honest hard work & intellect (from my limited understanding of his career)
Have you been following his account of his adventures on his South American ranch? It is a riveting story!
I know the long march higher has been accompanied by generally low volume but this is ridiculous. If ever there was a sucker’s rally, you’re looking one right in the eyeballs…!
Bankster bamboozlement at its finest! 🙂
Vern… How many times are we all going to say the same stuff? I know I am done with it.
The markets are being manipulated by the invisible hand… Computers… PPT… FED… whatever you want to call it!
Personally I like the term FIXED! The markets are FIXED! The Bookies always win.
I hear ya man. My sole concern is not to make decisions that loose me moolah. I don’t mind buying the bankster rallies when I think they have legs, but I do know a sucker punch when I see one. I do not believe this market has put in the kind of interim bottom that justifies a sustainable move to the upside. The banksters have managed to get market participants in a frenzy the last day or two. I expect this upside move to be given back and then some – huge divergence with volatility that suggests to me that complacency rules.
“….My sole concern is not to make decisions that loose me moolah. I don’t mind buying the bankster rallies when I think they have legs, …”
Isn’t that the truth. I have switched to trading the 1 minute chart….
I have officially become a day trader…. Took some time to adjust, but I kind of enjoy it now. With that being said, I am still looking forward to the day we get our “normal” market back. ..lol.
I can’t manage the adjustment. Day trading does not suit me psychologically I think, too much stress I find.
I just noticed something that has changed my mind. I am shorting this “rally”….
I should know in the next 24 hours if I am wrong… 🙂
Looks like the final wave up underway. I am slowly laddering into medium and long term short positions via bullish put spreads, which will be adjusted once our upside target is reached.
My view is that the GAP created from Sept 9th needed to be closed and NOW it is closed.
Now the GAP from this morning needs to close… and whatever direction it strongly breaks from there (Breaking Strong is important) will determine direction for the next several weeks into the election.
I am not going to say which way because I don’t want to be a contrary indicator.
Keep in mind 90% of the Wall Street Players have contributed mass amounts of money to either the Hillary Campaign + PAC’s supporting her and mass amounts of money to the Clinton Foundation. These are FACTS and mostly public information so look it up if you all don’t believe what I am saying.
Plus… We ALL know who the Federal Reserve Board wants to get elected!
Yeah. Those gaps were important. I know this move up looks impressive but I am not buying it. All the talking heads are exulting about the “FED induced” global stock rally but I remain cautious. I would be quite content to get positioned for the downside courtesy of Mr. Market’s exuberance via put credit spreads. I suspect the euphoria will be short-lived. 🙂
Follow the money of the people who want the POWER!
Lara,
I am just wondering if for the main wave count it might all be moved down one degree (i.e. we are still in intermediate 1, rather than intermediate 3). It just seems that measuring intermediate degrees in hours is too short.
Thanks,
Peter
Do you mean at the hourly chart level?
I’ve done it like that because primary 5 has a limit; it can’t be longer than primary 3. Which means it should be shorter, and it must be quite short.
Yes,
I see that intermediate 1 (Black 1) lasted only 7 hours, which seemed really short ( which is why I thought it might only be Minor 1 of intermediate 1), although looking back further I see there are several instances where intermediate waves last only a few days.
I see your point about the limit for Primary 5. I guess that would mean we are probably close to the end of Intermediate 3, with 4 and 5 to follow. If the main wave count plays out, we are very close indeed to a huge trend change.
Peter
Does that only leave the main count valid?
Yep. 2171+ invalidates the alternates as presented while giving significant support to the main count.
The VIX sell and SPX buy signal I noted yesterday is quite reliable but not perfect. It often leads to a powerfyl up move which we are witnessing.
Until a another count comes to light!
That is certainly possible. While I am not chasing this pop, I am not trading against it either. I do have a few calls I am sitting on from a closed bearish call spread so it really helps to be positioned ahead of this kind of move. I consider the ability to accumulate volatility and puts at Mr Market’s expense to be a gift horse I do not intend to look in the mouth. We have seen how quickly several weeks of gains can be erased in hours and I am not interested in being on the receiving end of any such ambush. These are shark-infested waters…be sure to wear your swimsuit…! 🙂
Another interesting observation is that DJI has not yet exceeded its September 12 high so if the alternate is correct, there could be some divergence between the two indices tomorrow as DJI moves higher to avoid a C wave truncation while SPX remains weaker…
It turns out the head-fake from the triangle was to the downside with the earlier broken trend-line, with the real thrust from it being upwards. I really should have caught that once it moved back above that trend-line as a key signal that an initial move out of a triangle is a head-fake is its quick intra-day reversal. I got fooled into thinking it was just a retest but there is no excuse for missing what was happening once it moved back above the line. Silly me!
Another thing typical of triangles is that often they are the penultimate structures in a developing wave so it is still possible that this thrust out of the triangle is a C wave of an ABC corrective wave with more downside ahead. European markets higher, US markets neutral so far. Tomorrow should tell us if we have a change of trend underway.
first
Fast!