
Price has moved sideways. This fits the alternate Elliott wave count better than the main Elliott wave count at this stage.
Summary: Sideways movement is most likely at this stage for a few days, a small pennant is forming. The breakout should be down. A new low below 2,111.05 would invalidate the main Elliott wave count and confirm the alternate. A new high now above 2,171.25 would invalidate the alternate and provide some confirmation of the main wave count.
Last monthly chart for the main wave count is here.
New updates to this analysis are in bold.
MAIN WAVE COUNT
WEEKLY CHART
Click chart to enlarge.
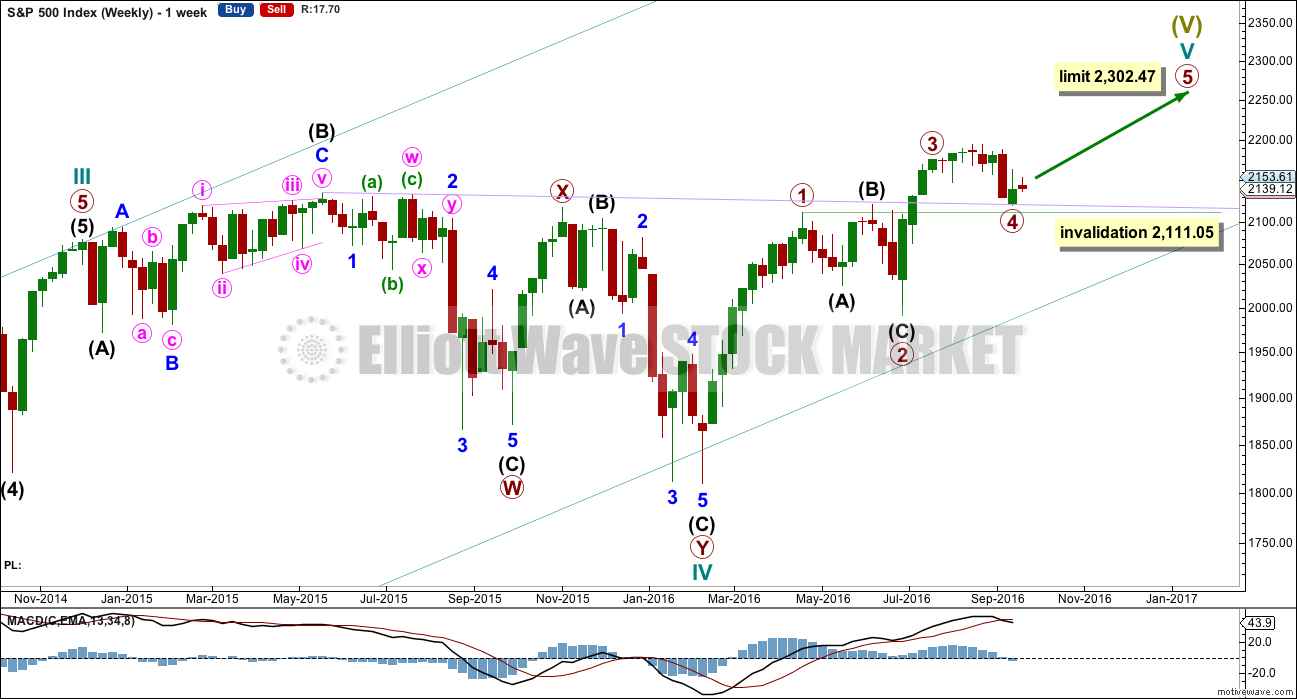
Cycle wave V must subdivide as a five wave structure. I have two wave counts for upwards movement of cycle wave V. This main wave count is presented first only because we should assume the trend remains the same until proven otherwise. Assume that downwards movement is a correction within the upwards trend, until proven it is not.
Primary wave 3 is shorter than primary wave 1, but shows stronger momentum and volume as a third wave normally does. Because primary wave 3 is shorter than primary wave 1 this will limit primary wave 5 to no longer than equality in length with primary wave 3, so that the core Elliott wave rule stating a third wave may not be the shortest is met. Primary wave 5 has a limit at 2,302.47.
Primary wave 2 was a shallow 0.40 expanded flat correction. Primary wave 4 may be exhibiting alternation as a more shallow combination.
Primary wave 4 may not move into primary wave 1 price territory below 2,111.05.
It is also possible to move the degree of labelling within cycle wave V all down one degree. It may be only primary wave 1 unfolding. The invalidation point for this idea is at 1,810.10. That chart will not be published at this time in order to keep the number of charts manageable. The probability that this upwards impulse is only primary wave 1 is even with the probability that it is cycle wave V in its entirety.
DAILY CHART
Click chart to enlarge.
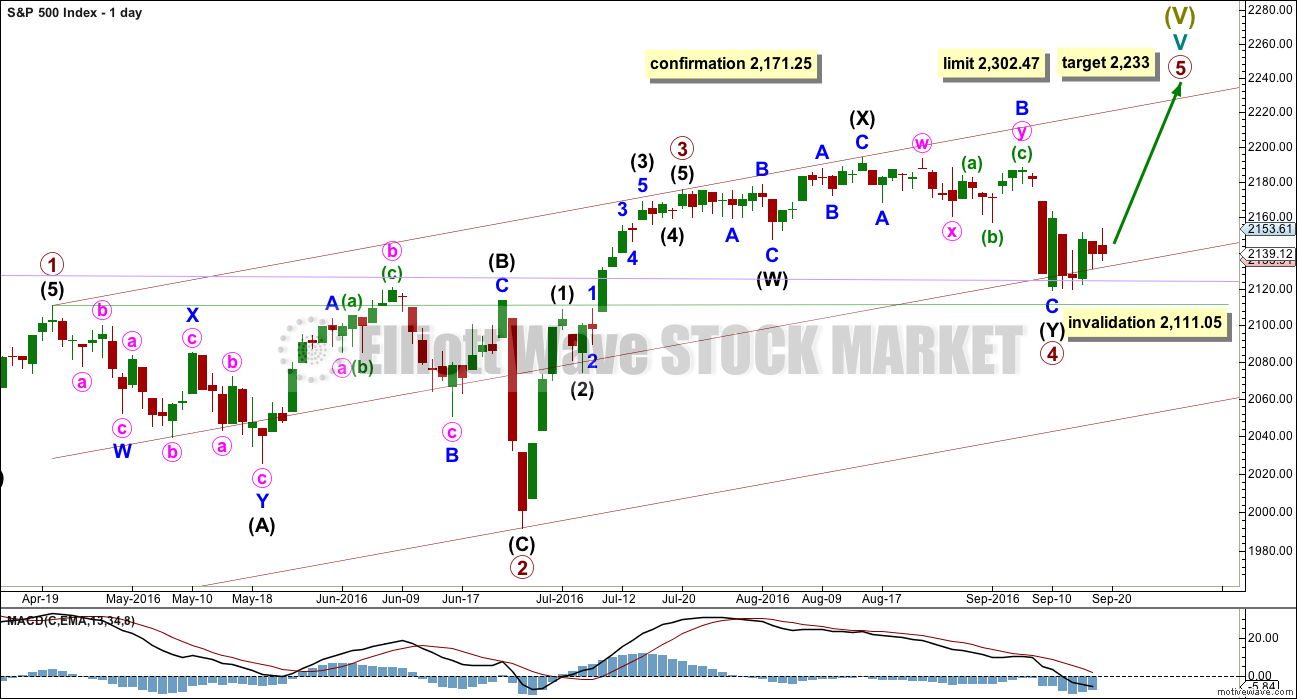
Primary wave 4 may be now complete as a double combination.
The first structure in the double is labelled intermediate wave (W) and is an expanded flat correction. The double is joined by a three in the opposite direction labelled intermediate wave (X). The second structure in the double is a zigzag labelled intermediate wave (Y).
The whole structure for primary wave 4 has a mostly sideways look, but the fact that intermediate wave (Y) has ended comfortably below the end of intermediate wave (W) must necessarily reduce the probability of this wave count. To achieve the purpose of taking up time and moving price sideways the second structure in a double should end close to the same level as the first and this one does not. This part of the wave count does not have the right look.
Primary wave 4 may not move into primary wave 1 price territory below 2,111.05.
Primary wave 1 lasted 47 days, primary wave 2 was even in duration at 47 days, primary wave 3 lasted 16 days, and so far primary wave 4 has lasted 39 days. The proportions between these waves are acceptable.
If primary wave 5 has begun here, then at 2,233 it would reach 0.618 the length of primary wave 1.
A new high above 2,171.25 now would invalidate the alternate daily wave count below and provide some confirmation of this main wave count. A new high finally above 2,187.87 would provide further confidence in this main wave count; that would invalidate other scenarios for the alternate.
HOURLY CHART
Click chart to enlarge.
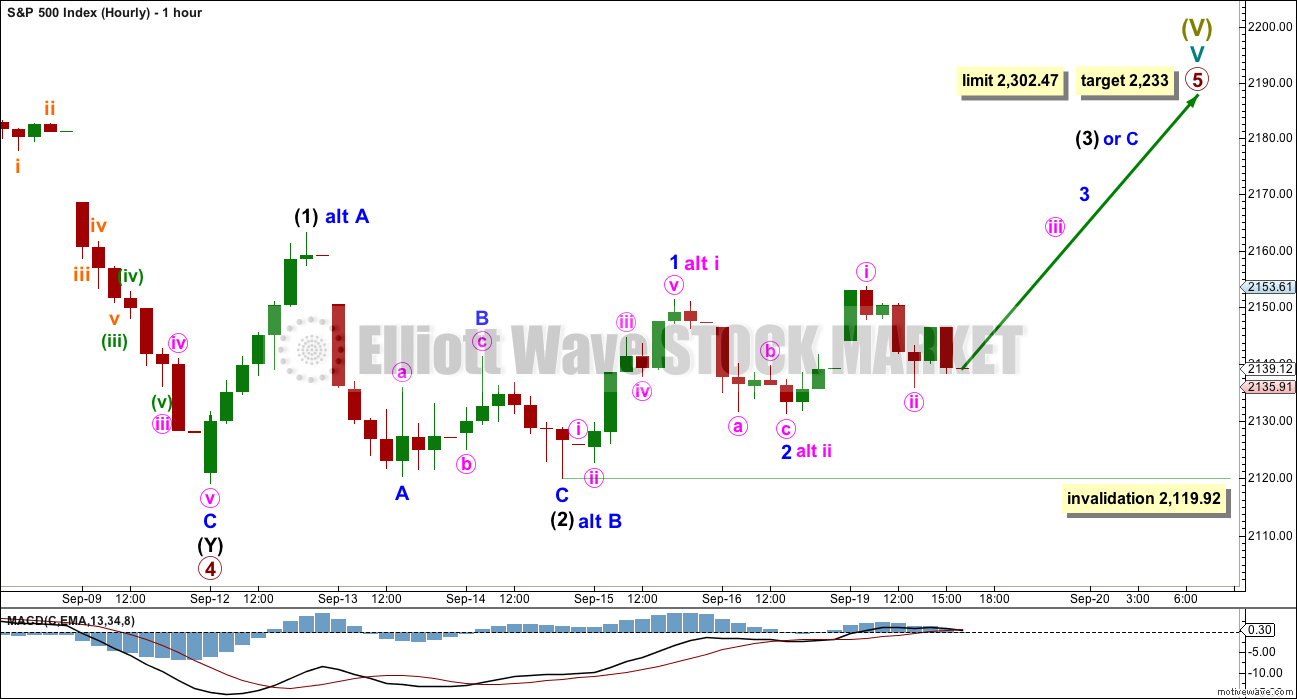
Primary wave 5 may unfold as either an impulse (more common) or an ending diagonal (slightly less common).
If an impulse upwards is unfolding for primary wave 5, then within it intermediate waves (1) and (2) would be complete. Intermediate wave (3) may only subdivide as a five wave impulse and must move above the end of intermediate wave (1) at 2,163.30. Within intermediate wave (3), minor wave 1 may be complete. Minor wave 2 may not move beyond the start of minor wave 1 below 2,119.92.
Alternate labelling: If an ending diagonal is unfolding for primary wave 5, then within it all the sub-waves may only subdivide as zigzags. So far a zigzag for intermediate wave (1) would be incomplete, so only minor waves A and most likely B would be complete. Minor wave C must move above the end of minor wave A at 2,163.30 to avoid a truncation. Within minor wave C, only minute wave i may be complete. Minute wave ii may not move beyond the start of minute wave i below 2,119.92.
Both an impulse or ending diagonal would now require a five wave structure upwards to move above 2,163.30. There is at this stage no divergence in expectations for direction.
Only when these two possibilities diverge in terms of expected direction or invalidation points will they be separated into two separate charts.
ALTERNATE WAVE COUNT
WEEKLY CHART
Click chart to enlarge.
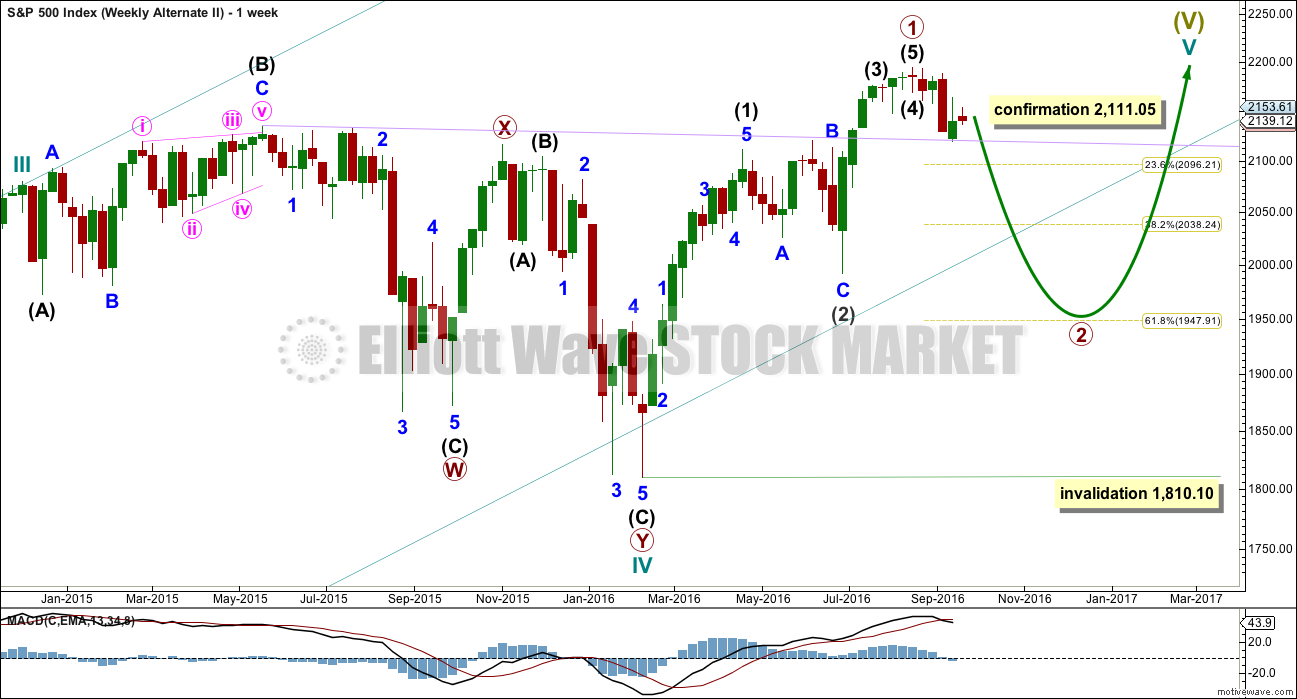
What if an impulse upwards is complete? The implications are important. If this is possible, then primary wave 1 within cycle wave V may be complete.
If the degree of labelling within cycle wave V is moved up one degree, then it is possible that recently Super Cycle wave (V) ended and the S&P has just begun a very large bear market to span several years. This scenario is possible, but absolutely requires price confirmation before it can be taken seriously. Only a new low below 1,810.10 would confirm this very bearish scenario.
If an impulse upwards is complete, then a deep second wave correction may be unfolding for primary wave 2. If primary wave 2 is to reach as low as the 0.618 Fibonacci ratio, then it would break below the larger teal channel about Super Cycle wave (V), which is copied over here from the monthly chart. This is possible: the S&P does tend to break out of its channels towards the end of a movement yet still continues in the prior direction before turning.
Primary wave 2 may not move beyond the start of primary wave 1 below 1,810.10.
DAILY CHART
Click chart to enlarge.
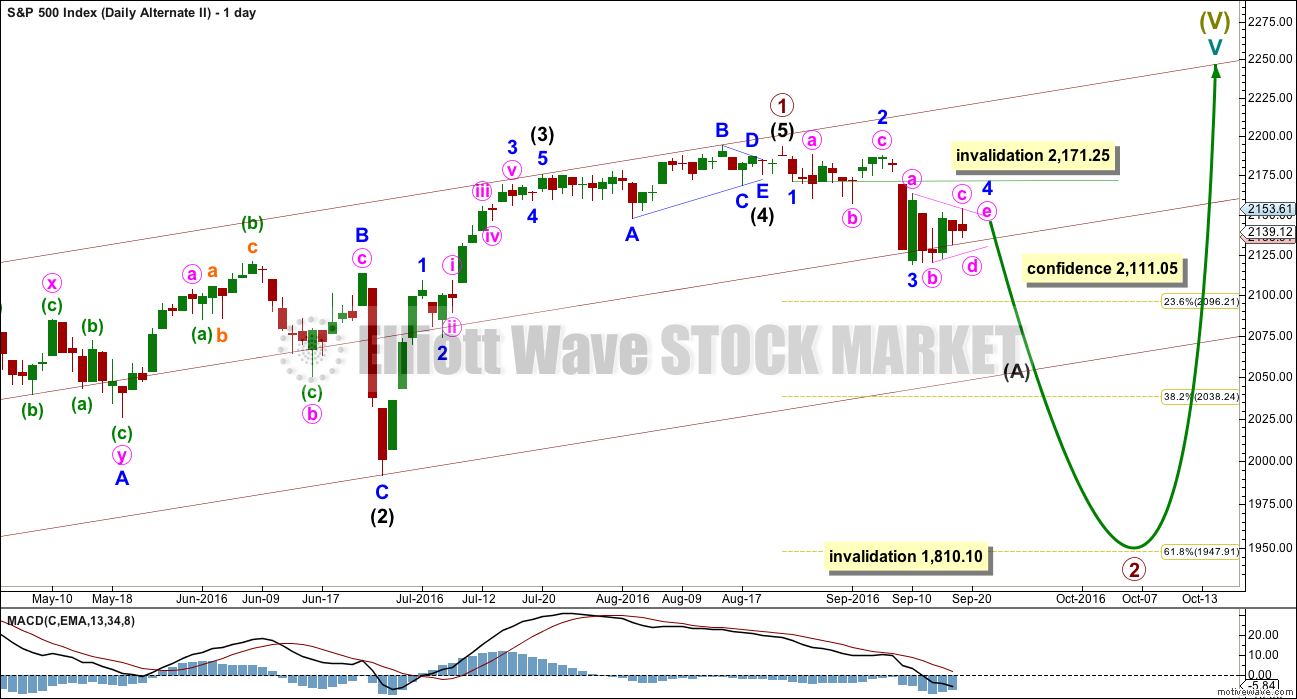
If an impulse upwards is complete, then how may it subdivide and are proportions good?
Intermediate wave (1) was an impulse lasting 47 days. Intermediate wave (2) was an expanded flat lasting 47 days. Intermediate wave (3) fits as an impulse lasting 16 days, and it is 2.04 points short of 0.618 the length of intermediate wave (1). So far this alternate wave count is identical to the main wave count (with the exception of the degree of labelling, but here it may also be moved up one degree).
Intermediate wave (4) may have been a running contracting triangle lasting 22 days and very shallow at only 0.0027 the depth of intermediate wave (3). At its end it effected only a 0.5 point retracement. There is perfect alternation between the deeper expanded flat of intermediate wave (2) and the very shallow triangle of intermediate wave (4). All subdivisions fit and the proportion is good.
Intermediate wave (5) would be very brief at only 18.29 points. Intermediate wave (5) is 1.43 points longer than 0.056 the length of intermediate wave (1).
So far primary wave 2 may be unfolding as a zigzag. The common depth for a second wave is the 0.618 Fibonacci ratio of the first wave it is correcting, so a reasonable expectation for primary wave 2 would be to end about 1,948.
The structure today within primary wave 2 is changed. At this stage, it is beginning to look strongly like a fourth wave triangle is unfolding sideways within an impulse unfolding downwards. When the triangle is complete, then the breakout should be downwards. This may be an impulse for intermediate wave (A). It may also be the first impulse down of a larger bear market if the degree of labelling within cycle wave V is all moved up one degree.
The triangle for minor wave 4 exhibits perfect alternation with the combination for minor wave 2. Minor wave 2 lasted nine days. If minor wave 4 is to be even in duration, then it may continue for a further four days.
Minor wave 4 may not move into minor wave 1 price territory above 2,171.25.
Primary wave 2 may not move beyond the start of primary wave 1 below 1,810.10. A new low below this point would see the degree of labelling within cycle wave V moved up one degree. At that stage, a trend change at Super Cycle degree would be expected and a new bear market to span several years would be confirmed.
HOURLY CHART
Click chart to enlarge.
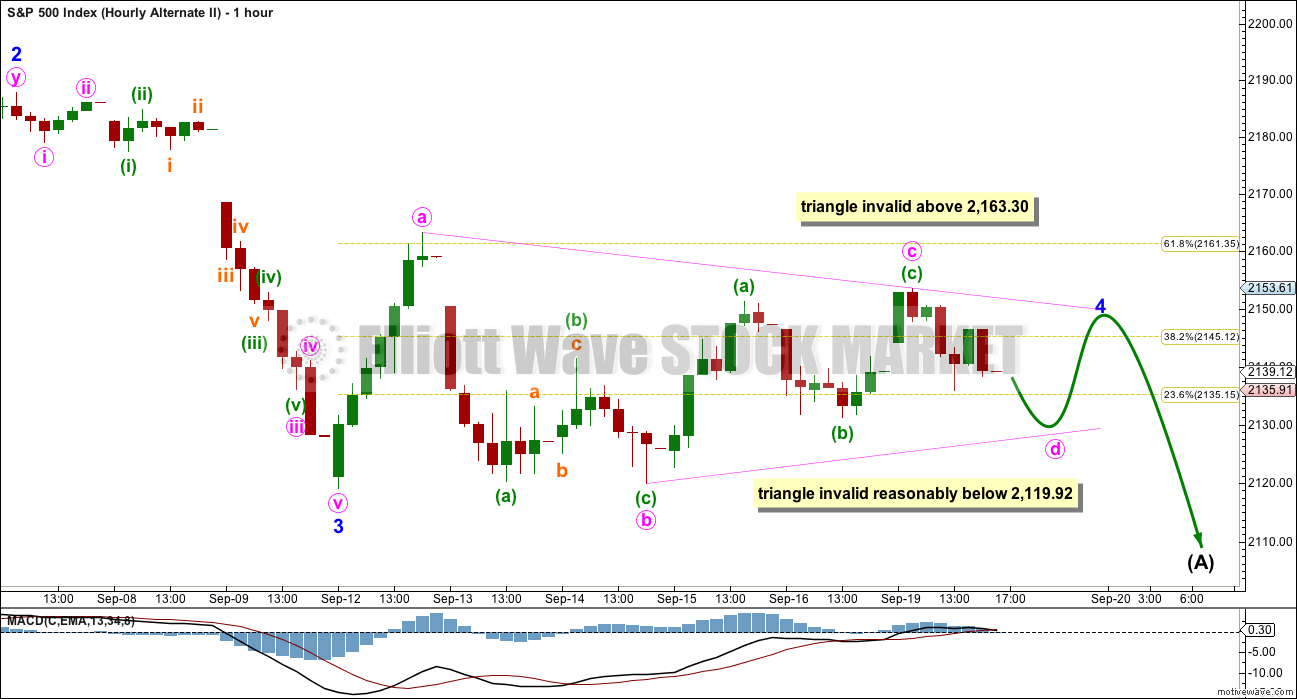
MACD is now hovering about zero, which indicates a triangle is most likely unfolding. The triangle may be a regular contracting or barrier triangle for a fourth wave.
Within the triangle, minute wave c may not move beyond the end of minute wave a above 2,163.30.
Minute wave d for a contracting triangle may not move beyond the end of minute wave b below 2,119.92. For a barrier triangle minute wave d may end about the same level as minute wave b, so that the b-d trend line is essentially flat. What this means in practice is minute wave d may end slightly below 2,119.92; this invalidation point is not black and white.
The final small zigzag for minute wave e may not move beyond the end of minute wave c for both a contracting or barrier triangle. It would most likely fall short of the a-c trend line.
This wave count expects overall sideways movement for most of this week to complete a small triangle. When it is done, the breakout for this wave count would be expected to be downwards.
TECHNICAL ANALYSIS
WEEKLY CHART
Click chart to enlarge. Chart courtesy of StockCharts.com.
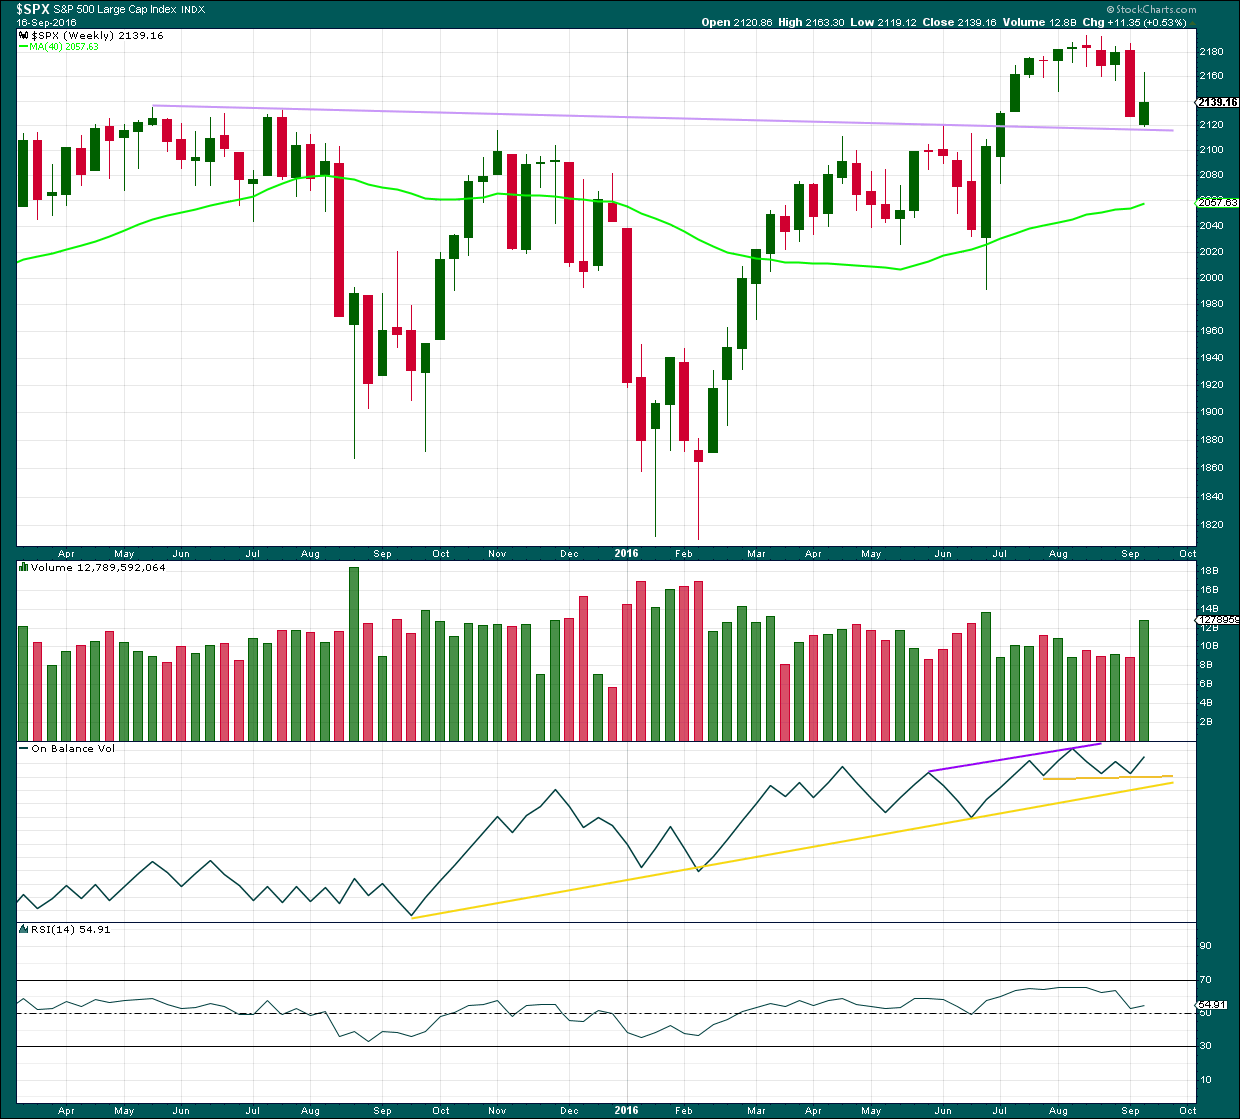
Last week completes a green weekly candlestick which has found support at the lilac trend line. The long upper wick is bearish and the green colour is bullish. A strong increase in volume indicates support for overall upwards movement, but to understand more clearly what is happening last week in terms of volume we need to look inside the week at daily volume bars.
On Balance Volume is providing a bullish signal last week with a move up and away from the short yellow trend line. There is divergence between price and OBV last week: the high for last week from price is lower than the last green weekly candlestick but OBV has made a lower high. This indicates weakness in upwards movement from price last week and it is bearish.
RSI is still just above neutral. There is room for price to rise or fall.
DAILY CHART
Click chart to enlarge. Chart courtesy of StockCharts.com.
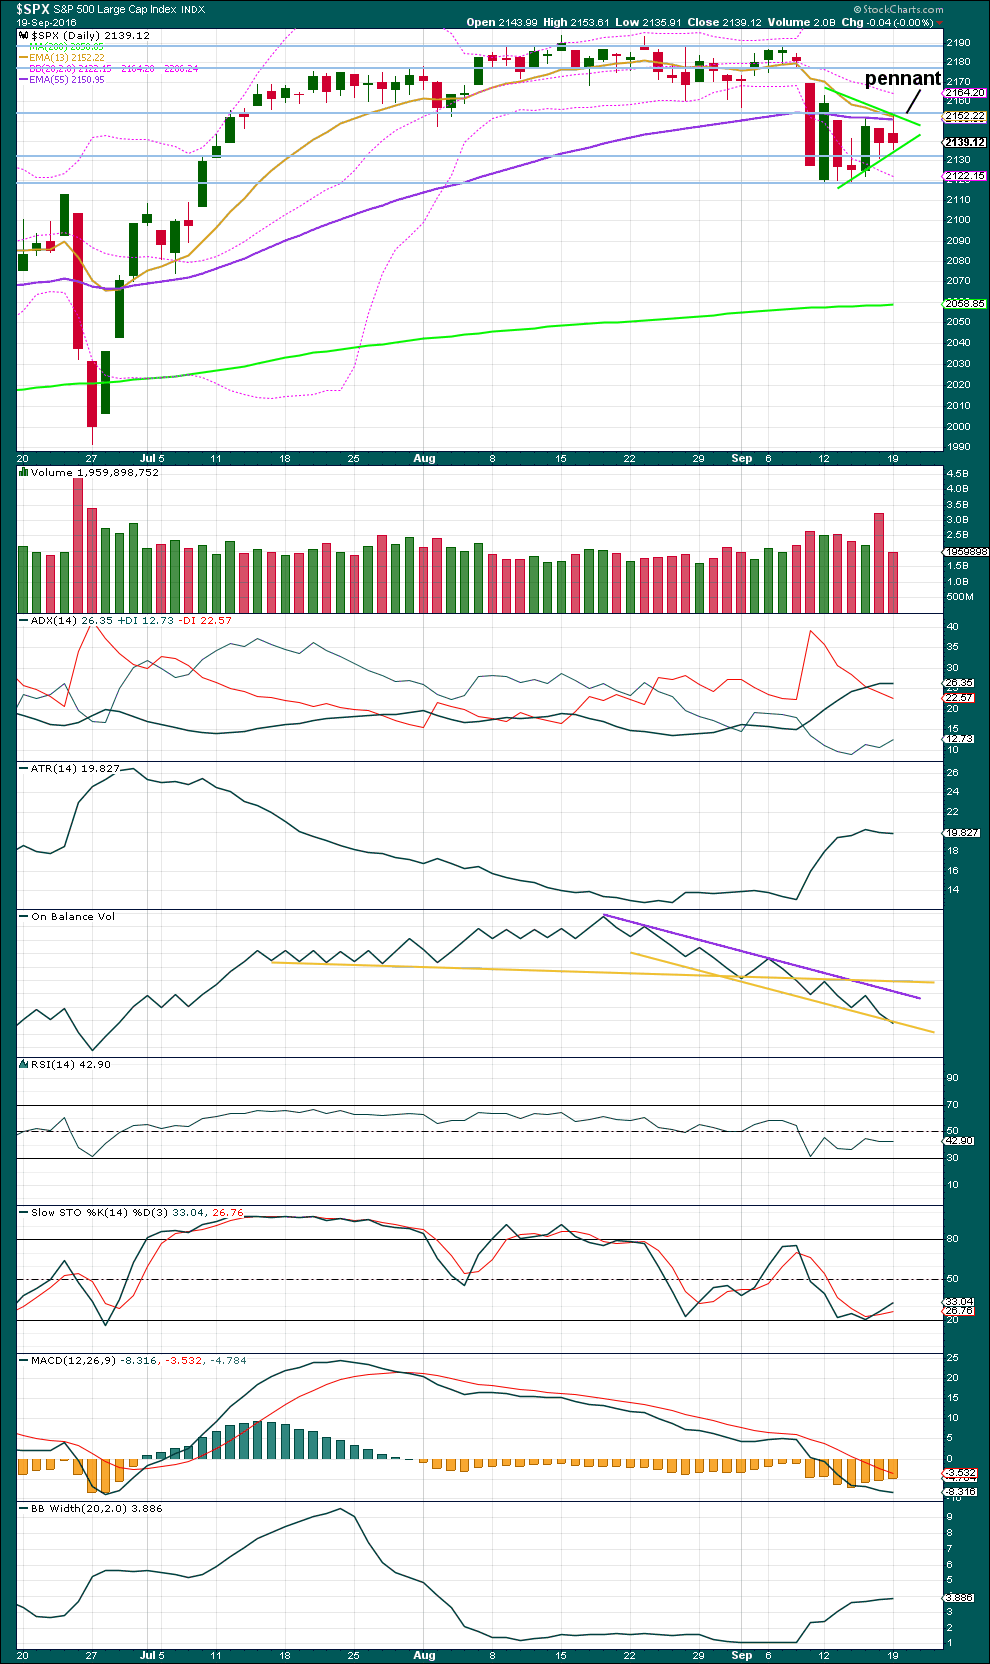
Strong volume for Friday’s downwards day should be ignored because this was an options expiry date.
Price today has moved overall lower to complete another red daily candlestick. Price has been moving overall sideways now for six sessions; a small pennant pattern may be unfolding. This is supported by declining volume as price moves sideways (ignoring the options expiry volume). Pennants are reliable continuation patterns. A target for the next piece of downwards movement would be calculated about 2,082.
ADX is today flat, no longer indicating a downwards trend in place.
ATR has flattened off. If a pennant is forming, then this makes sense.
Bollinger Bands continue to slightly expand; volatility has returned to the market.
On Balance Volume is breaking below the lower yellow line. This line is steep, not long held and tested three times. It does not have strong technical significance. The break below it is a weak bearish signal. At this stage, OBV has been giving bearish signals.
RSI is close to neutral. There is plenty of room for price to fall. There is no divergence between price and RSI to indicate weakness at this stage.
Stochastics is not extreme, but it may move into oversold and remain extreme for a reasonable period of time during a trending market.
MACD indicates an increase in downwards momentum.
VOLATILITY – INVERTED VIX CHART
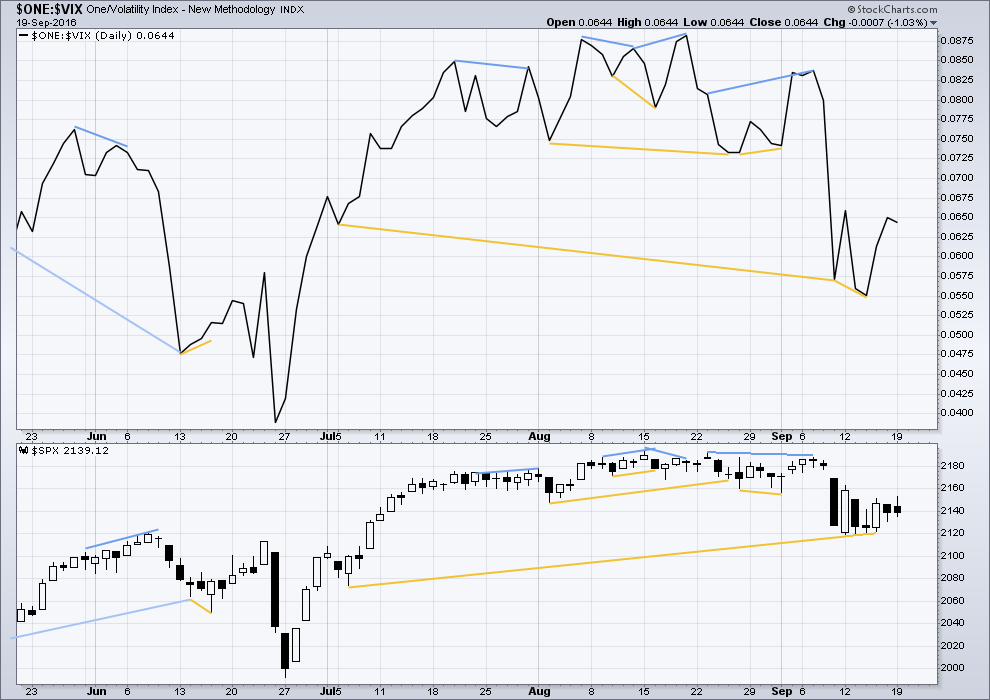
Click chart to enlarge. Chart courtesy of StockCharts.com.
Volatility is declining as price is rising. This is normal for an upwards trend.
There are a few instances of multi day divergence between price and inverted VIX noted here. Bearish divergence is blue. Bullish divergence is yellow. It appears so far that divergence between inverted VIX and price is again working to indicate short term movements spanning one or two days.
For Friday’s session, while price overall moved lower to complete a red daily candlestick, inverted VIX moved higher. Volatility declined as price moved lower. This single day divergence is bullish for the very short term. It supports the idea of upwards movement for Monday and possibly for Tuesday as well. This short term signal has not worked because it was followed by a downwards day.
BREADTH – AD LINE
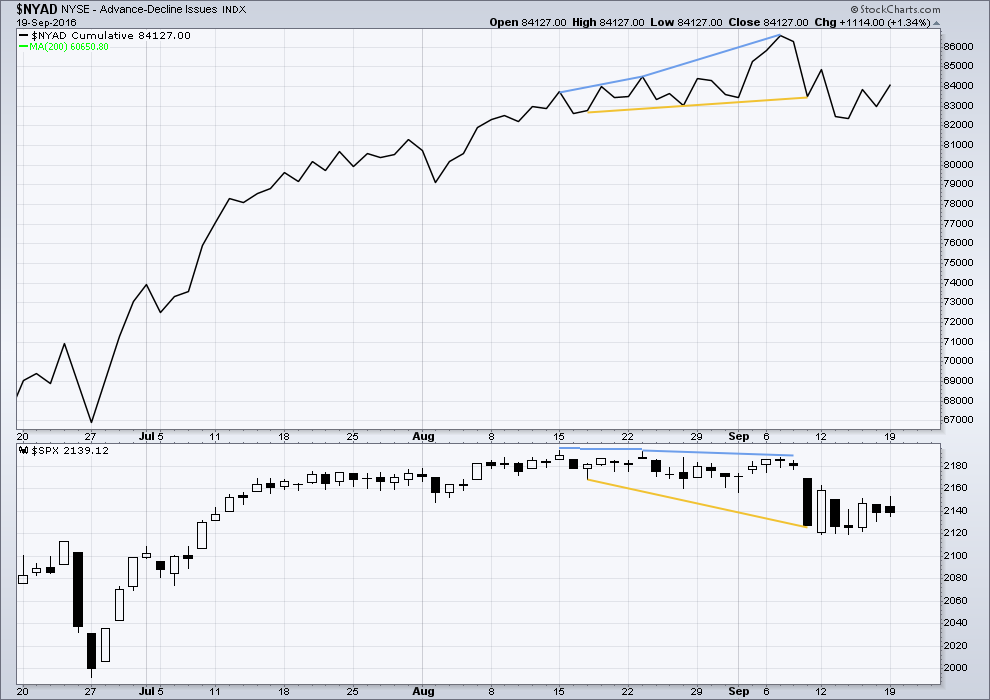
Click chart to enlarge. Chart courtesy of StockCharts.com.
There is support from market breadth as price is rising.
Short term bullish and bearish divergence is again working between price and the AD line to show the direction for the following one or two days.
There is no short term divergence to indicate weakness.
DOW THEORY
Major lows within the old bull market:
DJIA: 15,855.12 (15th October, 2014) – closed below on 25th August, 2015.
DJT: 7,700.49 (12th October, 2014) – closed below on 24th August, 2015.
S&P500: 1,821.61 (15th October, 2014) – has not closed below this point yet.
Nasdaq: 4,117.84 (15th October, 2014) – has not closed below this point yet.
Major highs within the bear market from November 2014:
DJIA: 17,977.85 (4th November, 2015) – closed above on 18th April, 2016.
DJT: 8,358.20 (20th November, 2015) – has not closed above this point yet.
S&P500: 2,116.48 (3rd November, 2015) – closed above this point on 8th June, 2016.
Nasdaq: 5,176.77 (2nd December, 2015) – closed above this point on 1st August, 2016.
Dow Theory Conclusion: Original Dow Theory still sees price in a bear market because the transportations have failed to confirm an end to that bear market. Modified Dow Theory (adding S&P and Nasdaq) has failed still to confirm an end to the old bull market, modified Dow Theory sees price still in a bull market.
This analysis is published @ 10:49 p.m. EST.
Trading these non-significant FED events is always good for a chuckle and a coin. As Elliotticians we aver that news does not make the market, but the other way around. That does not mean there are not lots of folk who buy the former.
Opened a SPY 214 straddle expiring Friday good for a laugh, or possibly two…these manic moves frequently speedily reverse and head in the opposite direction. Tomorrow will probably be no different than the last time we were here..
The triangle is looking good. That sure is what this looks like on both the daily and hourly charts.
From both an EW POV and a classic TA POV, the breakout should be down.
I like it when the classic TA aligns nicely with EW. Almost always more confidence may be had.
But almost…. is not the same as always.
Nice Gold chart! 🙂 🙂 🙂
OMG!
So sorry!
Doofus, only one coffee 🙂
This is what I meant to upload this morning
This is one of the more tightly coiled springs I have seen in quite some time. Some analysts are contending that the the almost 400 point DJI plunge on September 9 resolved the historic BB compression we saw recently. That plunge may have been just the first act in an ongoing drama.
This could spiral out of control pretty quickly…
Zero Hedge: Is This Why Deutsche Bank Is Crashing (Again)?
http://www.zerohedge.com/news/2016-09-20/why-deutsche-bank-crashing-again
I wish the DOJ best of luck getting that 14 billion…
No kidding! DOJ is a little late to the party.
DB bonds point to bad things happening…
Janet Yellen’s “Footnote 8” – The Negative Rate ‘Smoking Gun’ That Everyone Missed
Yellen’s Jackson Hole speech was widely reported, so we’ll spare you the summary. What wasn’t widely reported was her Footnote 8. Yellen cited approving a mathematical formula that could put interest rates on autopilot. The Fed hasn’t yet followed the rule, but its presence in Yellen’s paper suggests its use is on the table. Footnote 8 lays the groundwork for negative rates.
http://www.zerohedge.com/news/2016-09-20/janet-yellens-footnote-8-negative-rate-smoking-gun-everyone-missed
Yep… Yellen and her Secretive Cronies and that includes the dishonest media that hide stories like this.
We should know if a top is in when we see how how price behaves after a break from this triangle. I think a very good case could be made for its being a fourth wave as Lara suggested yesterday, so a following fifth wave down should easily break the DJI 18,000.00 and SPX 2120.00 pivots. If those pivots acts as resistance after the final impulse down it could be a wave one down for the new bear. We could get a head-fake break to the upside concomitant with FED blathering. If the pivots are quickly re-taken after the break it is time to go long and strong for the final jaunt to the top, the most likely outcome imo…
Getting whipsaw ed :). Its a “grand old duke of York ” market.
First? Where is everybody?
Lulled to sleep by a tired quiet market?