
Price remains within the confirmation / invalidation points and so both Elliott wave counts remain valid.
Summary: Classic technical analysis today favours the alternate Elliott wave count. A new low below 2,111.05 would confirm the alternate. Price should then overall continue lower to at least 1,948. Only a new low below 1,810.10 would provide price confirmation of a larger bear market. To the upside, a new high above 2,187.87 would indicate the 9th of September as a false breakout. At that stage, expect price to keep going upwards to 2,233.
Last monthly chart for the main wave count is here.
New updates to this analysis are in bold.
MAIN WAVE COUNT
WEEKLY CHART
Click chart to enlarge.
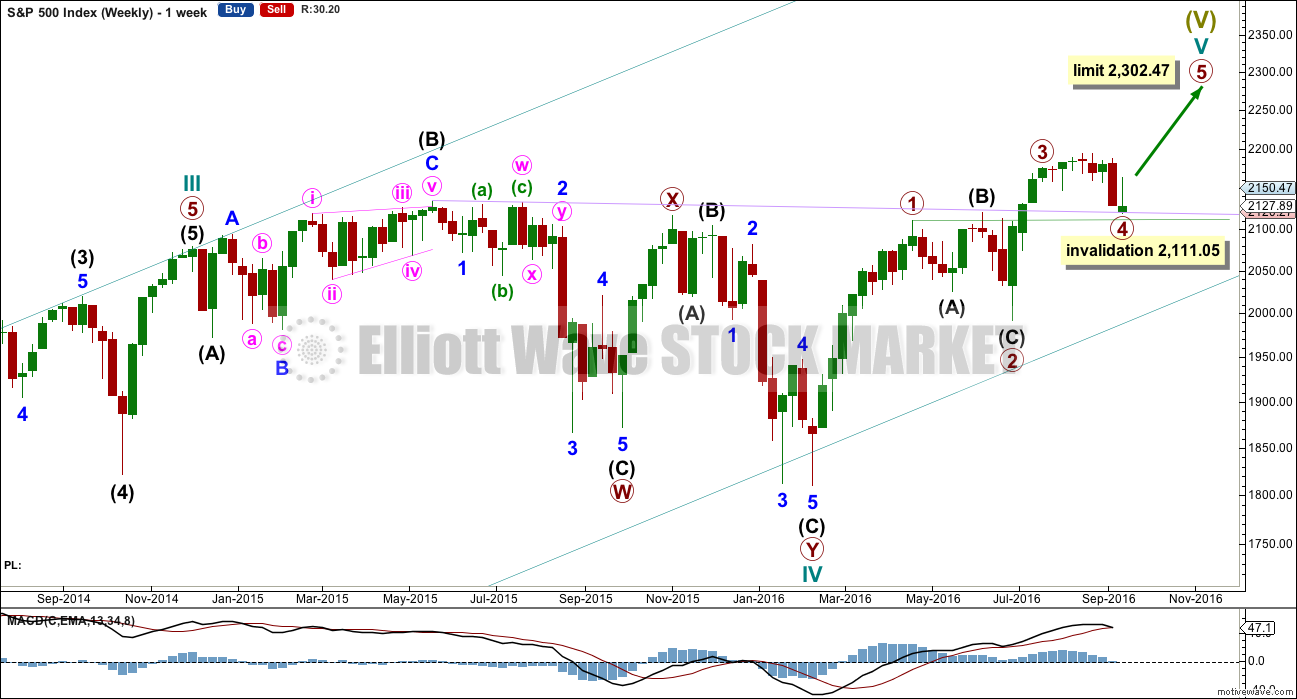
Cycle wave V must subdivide as a five wave structure. I have two wave counts for upwards movement of cycle wave V. This main wave count is presented first only because we should assume the trend remains the same until proven otherwise. Assume that downwards movement is a correction within the upwards trend, until proven it is not.
Primary wave 3 is shorter than primary wave 1, but shows stronger momentum and volume as a third wave normally does. Because primary wave 3 is shorter than primary wave 1 this will limit primary wave 5 to no longer than equality in length with primary wave 3, so that the core Elliott wave rule stating a third wave may not be the shortest is met. Primary wave 5 has a limit at 2,302.47.
Primary wave 2 was a shallow 0.40 expanded flat correction. Primary wave 4 may be exhibiting alternation as a more shallow triangle.
Primary wave 4 may not move into primary wave 1 price territory below 2,111.05.
It is also possible to move the degree of labelling within cycle wave V all down one degree. It may be that only primary wave 1 unfolding. The invalidation point for this idea is at 1,810.10. That chart will not be published at this time in order to keep the number of charts manageable. The probability that this upwards impulse is only primary wave 1 is even with the probability that it is cycle wave V in its entirety.
DAILY CHART
Click chart to enlarge.
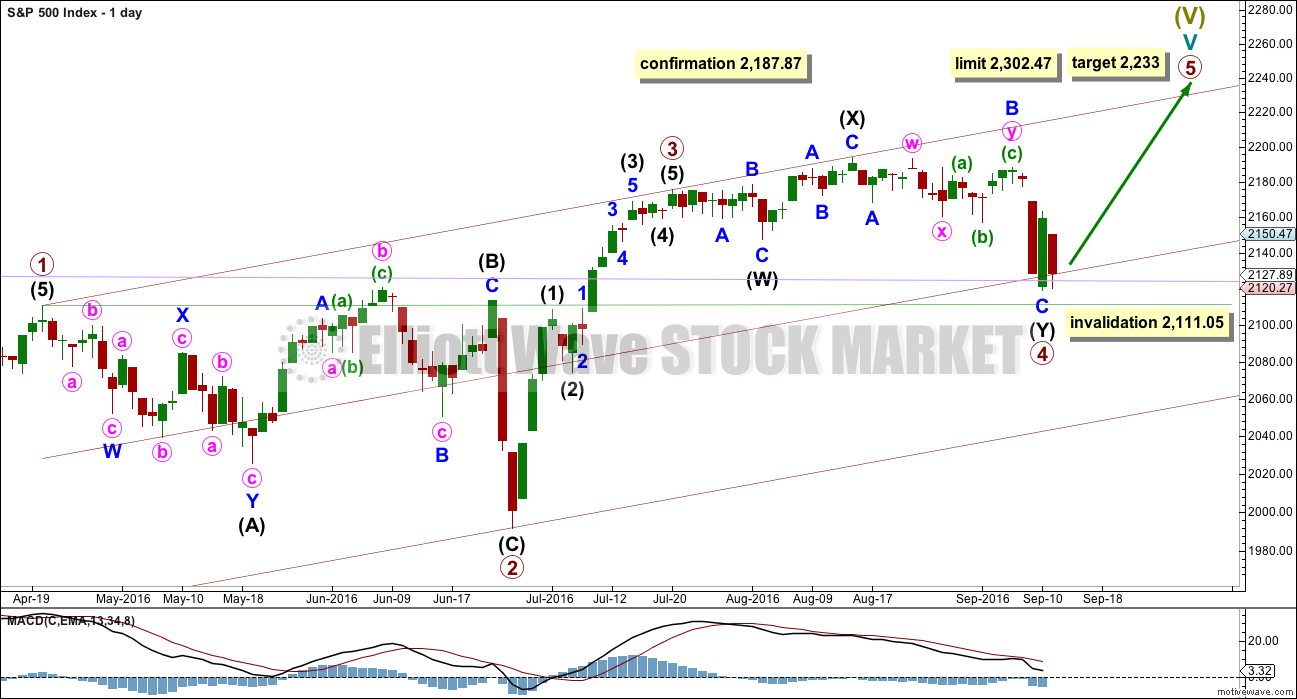
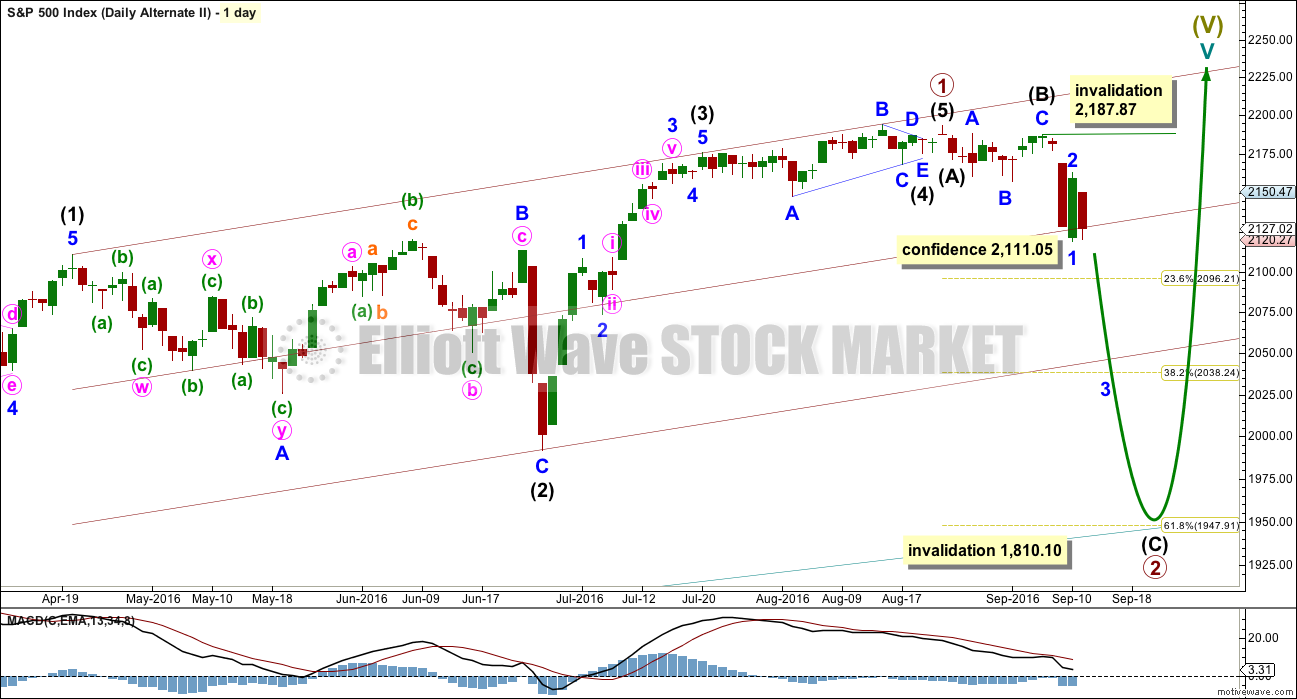
Primary wave 4 may be now complete as a double combination.
The first structure in the double is labelled intermediate wave (W) and is an expanded flat correction. The double is joined by a three in the opposite direction labelled intermediate wave (X). The second structure in the double is a zigzag labelled intermediate wave (Y).
The whole structure for primary wave 4 has a mostly sideways look, but the fact that intermediate wave (Y) has ended comfortably below the end of intermediate wave (W) must necessarily reduce the probability of this wave count. To achieve the purpose of taking up time and moving price sideways the second structure in a double should end close to the same level as the first and this one does not.
Primary wave 4 may not move into primary wave 1 price territory below 2,111.05.
Primary wave 1 lasted 47 days, primary wave 2 was even in duration at 47 days, primary wave 3 lasted 16 days, and so far primary wave 4 has lasted 39 days. The proportions between these waves are acceptable giving the wave count the right look.
If primary wave 5 has begun here, then at 2,233 it would reach 0.618 the length of primary wave 1.
A new high above 2,187.87 would invalidate the alternate daily wave count below and provide some confirmation of this main wave count.
HOURLY CHART
Click chart to enlarge.
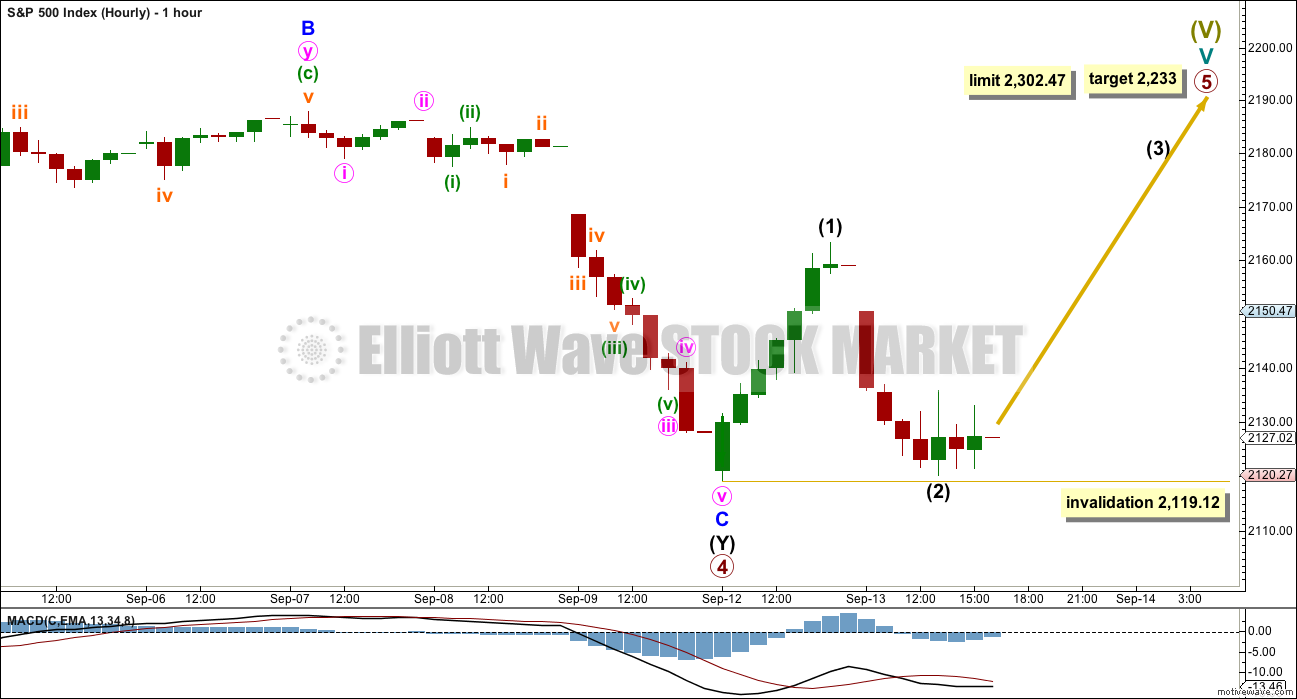
Within the zigzag of intermediate wave (Y), minor wave C is just 2.49 points longer than 2.618 the length of minor wave A. The structure is complete.
The impulse upwards was complete. It is labelled at intermediate degree for this wave count because primary wave 5 is expected to be relatively short and brief.
Intermediate wave (2) may not move beyond the start of intermediate wave (1) below 2,119.12.
At this stage, this hourly chart will assume that primary wave 5 will unfold as a more common impulse. It is also possible that primary wave 5 may unfold as an ending diagonal. If upwards movement looks like an unfolding zigzag, then an ending diagonal would be indicated; all sub-waves of ending diagonals must subdivide as zigzags. First the next five up needs to complete. This may be either intermediate wave (3) as labelled if primary wave 5 is an impulse, or it would be minor wave C of intermediate wave (1) if primary wave 5 is an ending diagonal. When the two ideas diverge in terms of expected direction, then an alternate will be published. For now both ideas need a five up to unfold tomorrow.
ALTERNATE WAVE COUNT
WEEKLY CHART
Click chart to enlarge.
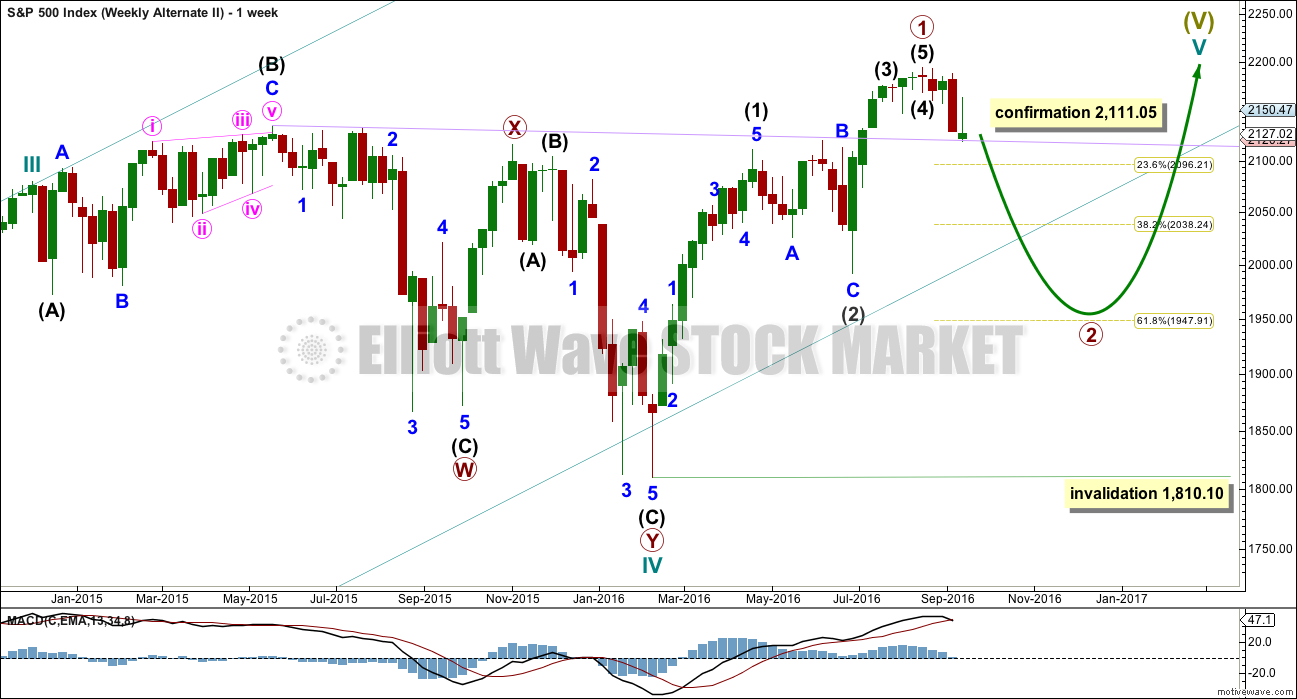
What if an impulse upwards is complete? The implications are important. If this is possible, then primary wave 1 within cycle wave V may be complete.
If the degree of labelling within cycle wave V is moved up one degree, then it is possible that recently Super Cycle wave (V) ended and the S&P has just begun a very large bear market to span several years. This scenario is possible, but absolutely requires price confirmation before it can be taken seriously. Only a new low below 1,810.10 would confirm this very bearish scenario.
If an impulse upwards is complete, then a deep second wave correction may be unfolding for primary wave 2.
Primary wave 2 may not move beyond the start of primary wave 1 below 1,810.10.
DAILY CHART
Click chart to enlarge.
If an impulse upwards is complete, then how may it subdivide and are proportions good?
Intermediate wave (1) was an impulse lasting 47 days. Intermediate wave (2) was an expanded flat lasting 47 days. Intermediate wave (3) fits as an impulse lasting 16 days, and it is 2.04 points short of 0.618 the length of intermediate wave (1). So far this alternate wave count is identical to the main wave count (with the exception of the degree of labelling, but here it may also be moved up one degree).
Intermediate wave (4) may have been a running contracting triangle lasting 22 days and very shallow at only 0.0027 the depth of intermediate wave (3). At its end it effected only a 0.5 point retracement. There is perfect alternation between the deeper expanded flat of intermediate wave (2) and the very shallow triangle of intermediate wave (4). All subdivisions fit and the proportion is good.
Intermediate wave (5) would be very brief at only 18.29 points. Intermediate wave (5) is 1.43 points longer than 0.056 the length of intermediate wave (1).
So far primary wave 2 may be unfolding as a zigzag. The common depth for a second wave is the 0.618 Fibonacci ratio of the first wave it is correcting, so a reasonable expectation for primary wave 2 would be to end about 1,948.
Within intermediate wave (C), no second wave correction may move beyond the start of its first wave above 2,187.87.
Primary wave 2 may not move beyond the start of primary wave 1 below 1,810.10. A new low below this point would see the degree of labelling within cycle wave V moved up one degree. At that stage, a trend change at Super Cycle degree would be expected and a new bear market to span several years would be confirmed.
HOURLY CHART
Click chart to enlarge.
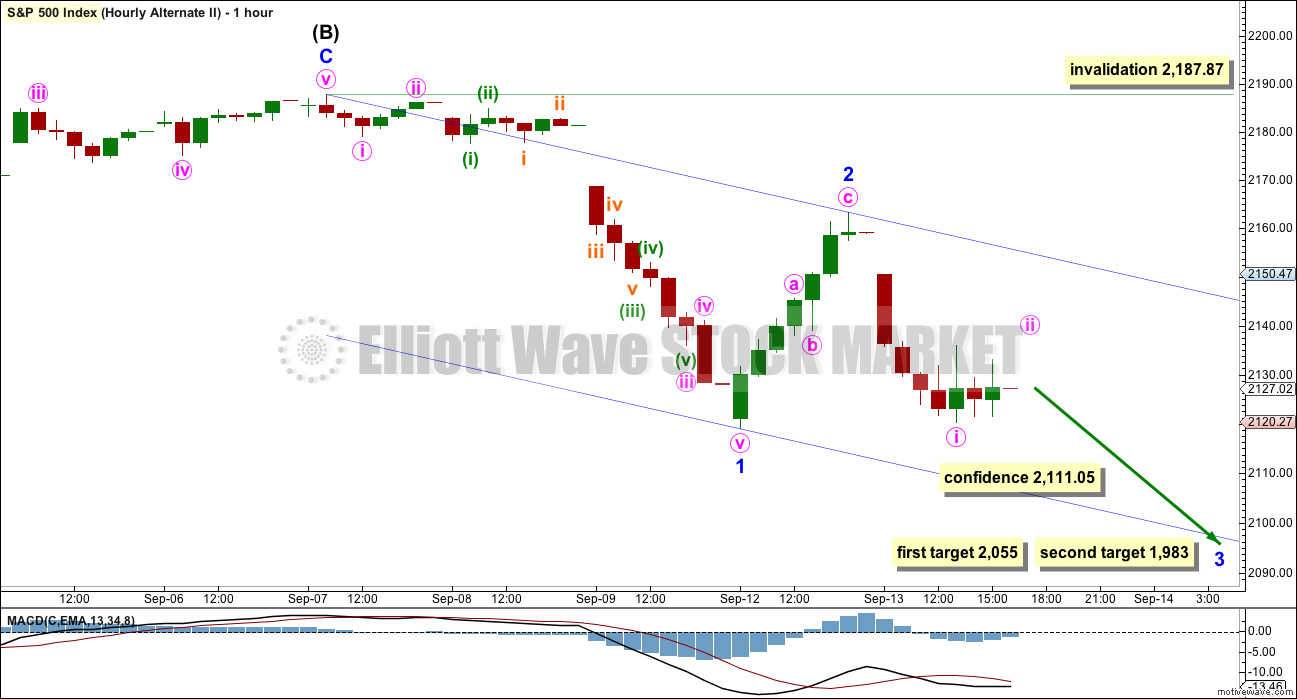
Downwards movement would be either intermediate wave (C) if the degree of labelling on the daily chart is correct, or intermediate wave (3) if the degree of labelling is moved up one degree. Both ideas should see a five wave impulse complete lower for this alternate wave count.
Minor wave 2 may be over, or it may continue sideways and / or higher as a flat correction. It may not move beyond the start of minor wave 1 above 2,187.87.
At 2,055 minor wave 3 would reach 1.618 the length of minor wave 1. If price gets to this first target and just keeps falling, or if it gets there and the structure is incomplete, then the second target would be used. At 1,983 minor wave 3 would reach 2.618 the length of minor wave 1.
If minor wave 2 continues higher, then these targets must be recalculated.
If price makes a new low tomorrow below 2,111.05, then this alternate wave count would be used. At that stage, several more days of overall downwards movement, if not weeks, would be expected.
TECHNICAL ANALYSIS
WEEKLY CHART
Click chart to enlarge. Chart courtesy of StockCharts.com.
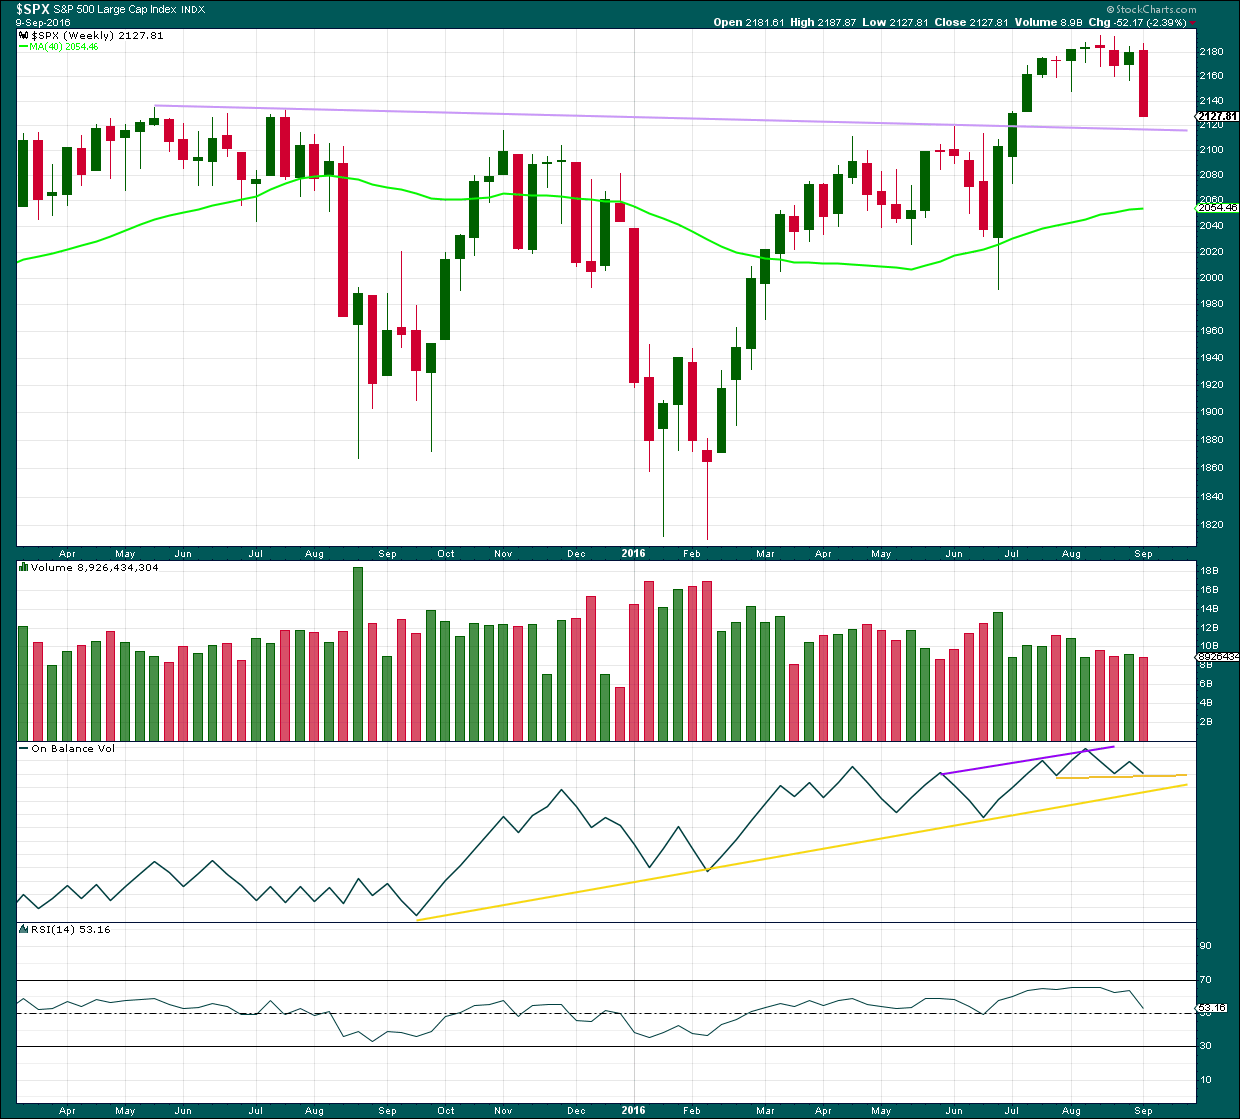
Last week has closed below an important resistance point at 2,134. This is the prior all time high from May 2015. This close is significant. On its own it is not enough to turn to full bearish, but it is one piece of evidence to weigh up.
The long held lilac trend line should be expected to offer strong support for price along the way down. Draw it from the prior all time high in May 2015 to the first small swing high in July 2015. This line is drawn also on weekly Elliott wave charts.
Volume for last week is lighter than the prior upwards week. The fall in price at the weekly chart level does not look like it was supported by volume, but to get a clearer picture it is necessary to look inside last week at daily volume bars.
On Balance Volume has come down to find support at a short term yellow line. The next support line is close by. These lines may assist to halt the fall in price.
RSI is just above neutral. There is plenty of room for price to rise or fall. There is no divergence at the weekly chart level to indicate weakness.
DAILY CHART
Click chart to enlarge. Chart courtesy of StockCharts.com.
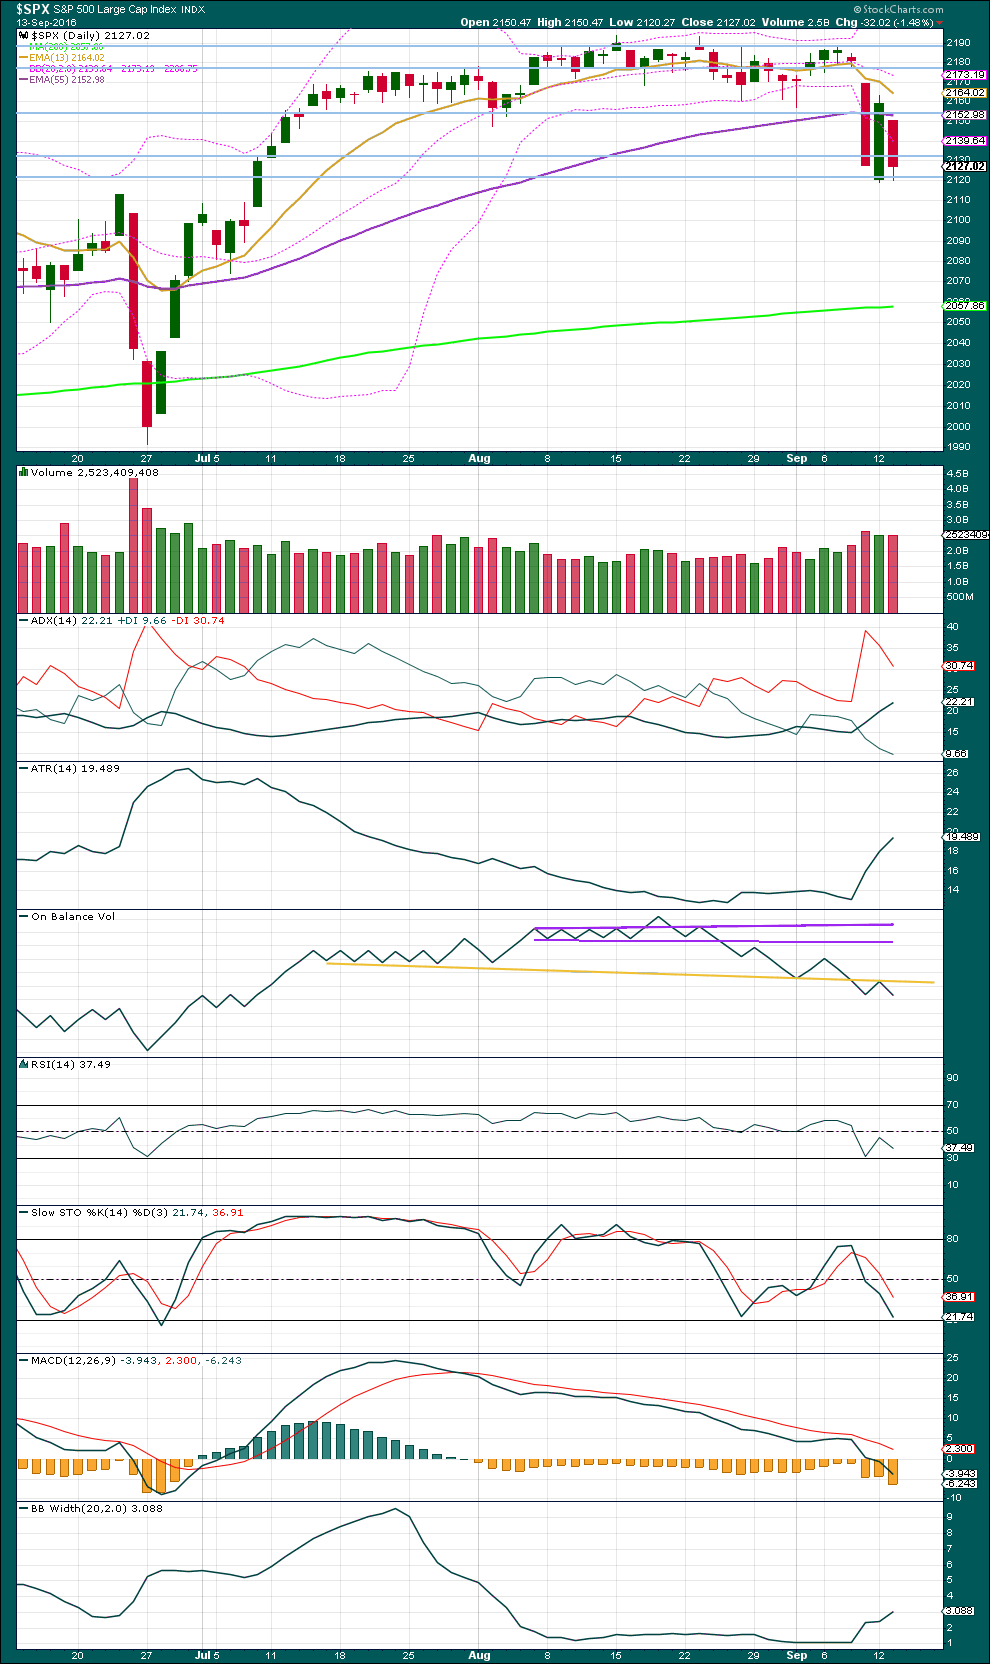
Another strong downwards day comes with slightly higher volume than the prior upwards day. The fall in price is supported by volume. This supports the idea of more downwards movement ahead, and it supports the alternate Elliott wave count over the main Elliott wave count.
ADX is clearly increasing and the -DX line is above the +DX line. A downwards trend is indicated.
ATR is strongly increasing after a long period of decline. The market is again trending. Bollinger Bands too are widening.
With all three of these indicators signalling a new trend, this strongly supports the alternate Elliott wave count.
On Balance Volume has given another bearish signal today with a move below the yellow line. This also supports the alternate Elliott wave count.
RSI is not yet extreme and at this stage still exhibits no divergence with price to indicate weakness. There is room for price to fall further.
Stochastics is close to oversold but not there yet. There is room for price to fall further.
This classic technical analysis supports the alternate Elliott wave count.
VOLATILITY – INVERTED VIX CHART
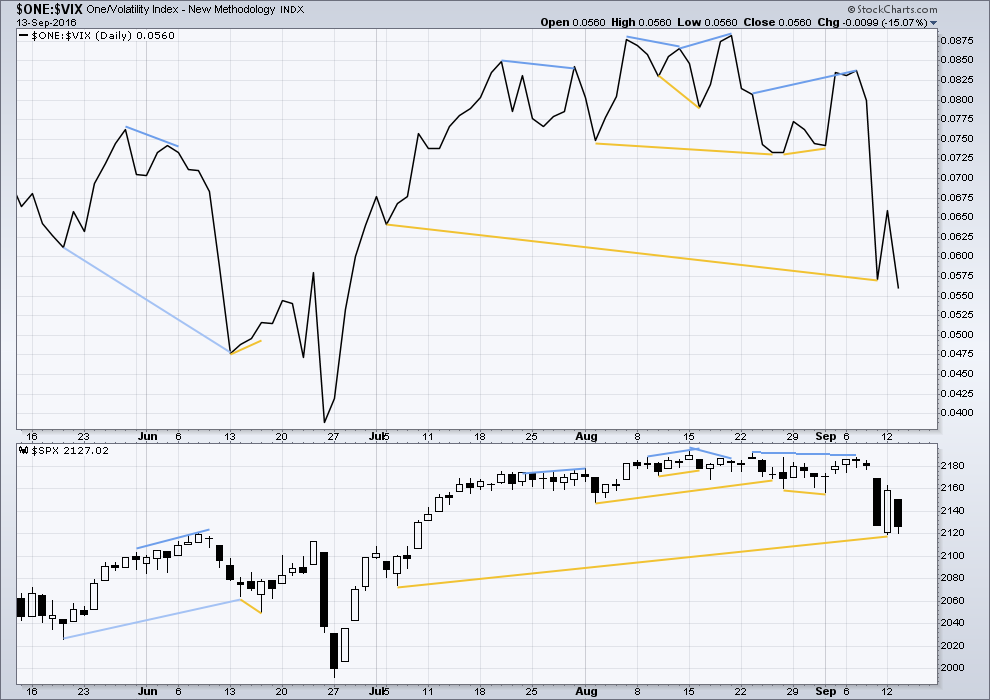
Click chart to enlarge. Chart courtesy of StockCharts.com.
Volatility is declining as price is rising. This is normal for an upwards trend.
There are a few instances of multi day divergence between price and inverted VIX noted here. Bearish divergence is blue. Bullish divergence is yellow. It appears so far that divergence between inverted VIX and price is again working to indicate short term movements spanning one or two days.
There is now longer term divergence noted between price and VIX. From the lows of 6th July to Friday’s low, VIX has made a lower low but price has made a higher low. This divergence is bullish and indicates weakness in price. This bullish divergence has proven to correctly predict a following movement from price: yesterday price moved upwards. At this stage, it looks like the divergence may now be resolved with only one day of upwards movement.
VIX has today made a new low below the low of 9th of September, and price has also made a lower low below that date. There is no divergence between these dates for VIX and price.
BREADTH – AD LINE
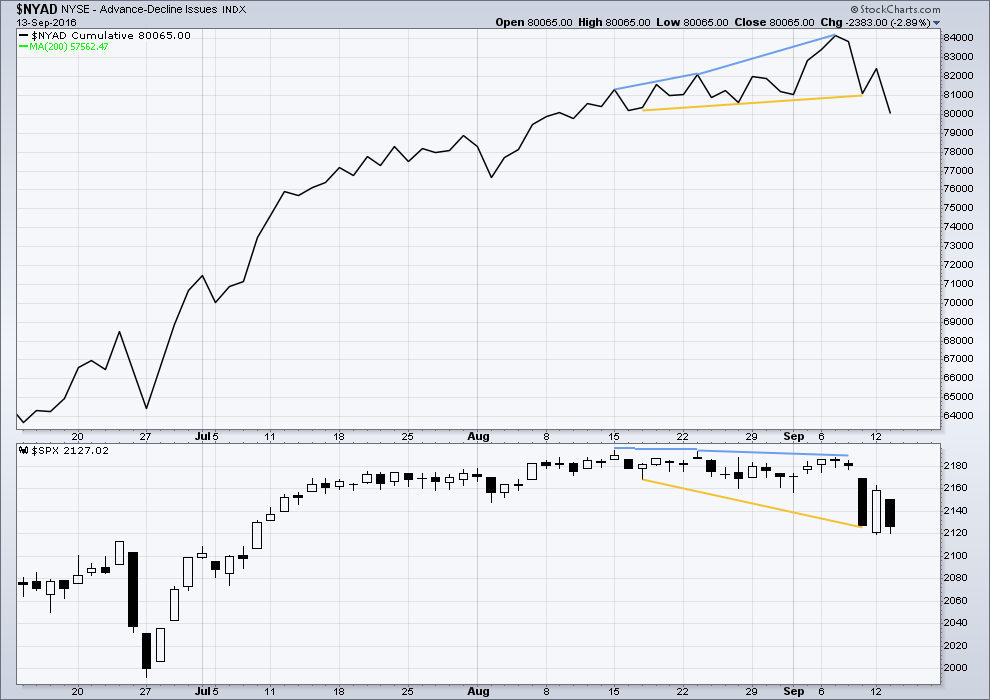
Click chart to enlarge. Chart courtesy of StockCharts.com.
There is support from market breadth as price is rising.
Short term bullish and bearish divergence is again working between price and the AD line to show the direction for the following one or two days.
There is now mid term bullish divergence between price and the AD line: from the low of 17th of August to 9th September price has made a lower low but the AD line has made a higher low. This indicates weakness in price.
This bullish divergence has now been followed by one day of upwards movement, so it correctly predicted the direction for price on the following day. It looks like the divergence is now resolved and may not be followed by any more upwards movement.
The AD line today made a new low below its prior swing low of 9th of September. Price has also made a lower low below this date. There is no divergence here to indicate any weakness; the downwards movement from price has a corresponding decline in market breadth.
DOW THEORY
Major lows within the old bull market:
DJIA: 15,855.12 (15th October, 2014) – closed below on 25th August, 2015.
DJT: 7,700.49 (12th October, 2014) – closed below on 24th August, 2015.
S&P500: 1,821.61 (15th October, 2014) – has not closed below this point yet.
Nasdaq: 4,117.84 (15th October, 2014) – has not closed below this point yet.
Major highs within the bear market from November 2014:
DJIA: 17,977.85 (4th November, 2015) – closed above on 18th April, 2016.
DJT: 8,358.20 (20th November, 2015) – has not closed above this point yet.
S&P500: 2,116.48 (3rd November, 2015) – closed above this point on 8th June, 2016.
Nasdaq: 5,176.77 (2nd December, 2015) – closed above this point on 1st August, 2016.
Dow Theory Conclusion: Original Dow Theory still sees price in a bear market because the transportations have failed to confirm an end to that bear market. Modified Dow Theory (adding S&P and Nasdaq) has failed still to confirm an end to the old bull market, modified Dow Theory sees price still in a bull market.
This analysis is published @ 6:26 p.m. EST.
No volume data from StockCharts as yet…. A doji with an upper wick much longer than lower is bearish.
But as Verne notes below, the Dow’s moping around the 18,000 pivot is concerning for a bear case. That point should be smashed decisively if a deep pullback or new bear market is in place.
EW: the alternate II hourly chart has a slightly better look IMO. At this stage. But really, at this stage I don’t think that observation is worth much.
Second bounce off the 18,000.00 pivot near term bullish. L expect we will see another upside ramp of a few hundred DJI points tomorrow which might be a good shorting opportunity. Hesitation in this area militates against any short side trades.
If I am wrong, futures wll signal a decisive take-out of the pivot tomorrow.
Have a great evening everyone!
This is a chart of the weekly on XIV. Based off of fib retracements, the 38.2% would be in the $27.50 area. If it gets there within a week, that would potentially put UVXY in the 32’s – 33’s…I would personally be looking for a bit lower than that, but potentially later this month or into next month, XIV could drop even lower, possibly down to the $20 area…that’s a way’s away for now…just food for thought.
…Now thirty….
DJI is now a mere fifty handles from putting a big smile on my face (and hopefully yours) ….
Come on and move it move it!
Come on and… 🙂
Market making the Bulls feel safe…
Next the market will take a bat and break both of the Bull’s knee caps.
As safe as a goldfish in a piranha tank..
ROTFL
Your comments amuse me every day Verne 🙂 🙂 🙂
If we could not find a bit of mirth in this market we would all go nuts! 🙂
If, and I mean IF the VIX holds up and the SPX breaks to see new lows, and we visit the 200 day, then I project that UVXY would get close to $28…that would be a potential target to buy puts on UVXY…
I may in fact consider holding some UVXY shares being ready to sell at breakeven in case the VIX drops below 15, while buying puts against that position…imo we are due for a huge volatility spike, but it might also not happen as there is ~15% probability that the VIX remains below 25 the rest of this year–my educated guess.
We’re not there yet on the VIX…trendline resistance is holding it down…17.50 is not enough, we need to break above 18 to have confidence for a probability in a market break lower…
As noted before, the market is moving with AAPL…
It is all a matter of psychology. The bulls are supremely confident BTFD still obtains. They will be initially disabused of that notion with a pivot break, followed by a spike in volume as they run for the exits, screaming with hair ablaze…. (thanks to Olga for that imagery) 🙂
Yup, and right now, bears have the advantage unless the market magically gaps up higher tomorrow…eventually BTD will be the new summer volatility …
Can’t wait for the bulls to get stuck for a change. The recent drop is nothing compared to what should happen.
Yes, good imagery.
Another boring rising wedge? The one on Monday was steeper showing more buying enthusiasm. We should eventually break from it to the downside….*Yawn*
The tug-of-war continues. It looks like the bulls are tiring. I want to see a demolition of DJI 18,000.00 – a smash through it with real authority, and bull carcasses scattered to the four winds…. 🙂
Lol, that would be fantastic! However, given the past on these MMs, we have seen when bulls tire, overnight gaps higher above strong resistance happen just to let these *&^#($&(@) get whatever they want.
Interestingly, oil companies are down for a change after there was a draw in the EIA report–doesn’t make much sense, so there must be another underlying issue there. That’s not helping equities…they are overpriced, high P/E ratios mostly, and with a lower oil price, I expect investors will drop their oil stocks in search of better P/E ratios, hence the rally in utilities this year. It’s only a matter of time before everything gets thrown out.
I’m surprised at the strength of the move in AAPL. My chart said there was resistance at 110.40 earlier today, but of course it broke higher…this is one thing that is holding the market up. If gravity takes effect and AAPL drops, it could take everything down with it…
Verne,
I simply love your metaphors…
bull carcasses offered to the FED-Hyenas.. -:)
Glad you get a smile or two… 🙂
If the VIX can get back above 17, then the bears might seek Verne’s target of the 200 dma. Otherwise, if the 17 level is rejected, and a move below 15 would likely trigger an equity bull run (short squeeze).
BTW, I would consider the simultaneous filling of DJI and SPX gaps from last week Thursday’s close at 18,479.90 and 2181.30 respectively to signal an “all- clear” for the final ride higher. Considering how crazy this market has been, nothing would surprise me, including a bolt for those levels the next few days….
Well, Mr. Market yet has to make his true intentions clear. I lean toward the bearish case but as we all know well, Mr. Market is tricksy.
We saw a plunge last Friday, then the FED induced whipsaw on Monday, followed by the re-plunge yesterday. There are so many competing forces, from FED jawboning, IHS neck-line testing, and extraordinarily compressed BBs.
The FED variable has now been removed from the equation as they have entered their “quiet” period and are prohibited from making comments prior to next Wednesday’s pow wow. Good riddance. Glad they are muzzled.
The IHS neckline is being tested as we speak and either the retest holds and we shoot higher, or it breaks and we head toward the 200 dma with gusto.
I will be using DJI as a proxy for the markets in general. I think the key is DJI 18,000.00.
For me to be fully convinced of the bearish case that level has to be taken out suammarily; no ifs, ands or butts, period.
Any meandering, moping around or otherwise useless perambulating around that pivot spells doom for the bears. We have seen that movie too often before and we know how it typically ends. A failure to take out DJI 18.000.00 in the first few hours of trading and I am back to the sidelines for the time being. In the absence of any clear signals from futures we will just have to see what Mr. Market does at the open. Have a great trading day everyone!
The failure to re-capture the 50 day (the attempt was roundly re-buffed) means the 200 DMA is the next likely stop. As fortuition would have it, the 200 dma is around 2057, the same area as the target for minor three at 2055. It is great to have such a confluence of price points to plan our next trades. I will be looking for the initial capitulation spike in volatility at the end of minor three, followed by a slightly lower (or equal) high to signal the end of minor five…and then….off to the races, and the bulls’ and banksters’ last shindig! The next few days should be loads of fun….I am sure many of you will be settling some old scores with Mr. Market! 🙂
First!! Whoop