
The short term expectation for Monday was for a little downwards movement to a target at 2,122 before a turn and upwards movement.
The low for Monday was 2,119.12, 2.88 points below the target.
Summary: Friday’s 90% down day is likely to be followed by at least 2-7 days of rebound. A new alternate wave count has a good look, and it expects Friday was the start of a deeper correction to about 1,950. This would be confirmed below 2,111.05. A larger bear market requires price confirmation below 1,810.10. On Balance Volume and volume bars favour the new alternate Elliott wave count. If price makes a new high above 2,187.87 this week, then the alternate would be invalidated and the main wave count confirmed. At that stage, the target for upwards movement to end would be at 2,233.
Last monthly chart for the main wave count is here.
New updates to this analysis are in bold.
MAIN WAVE COUNT
WEEKLY CHART
Click chart to enlarge.
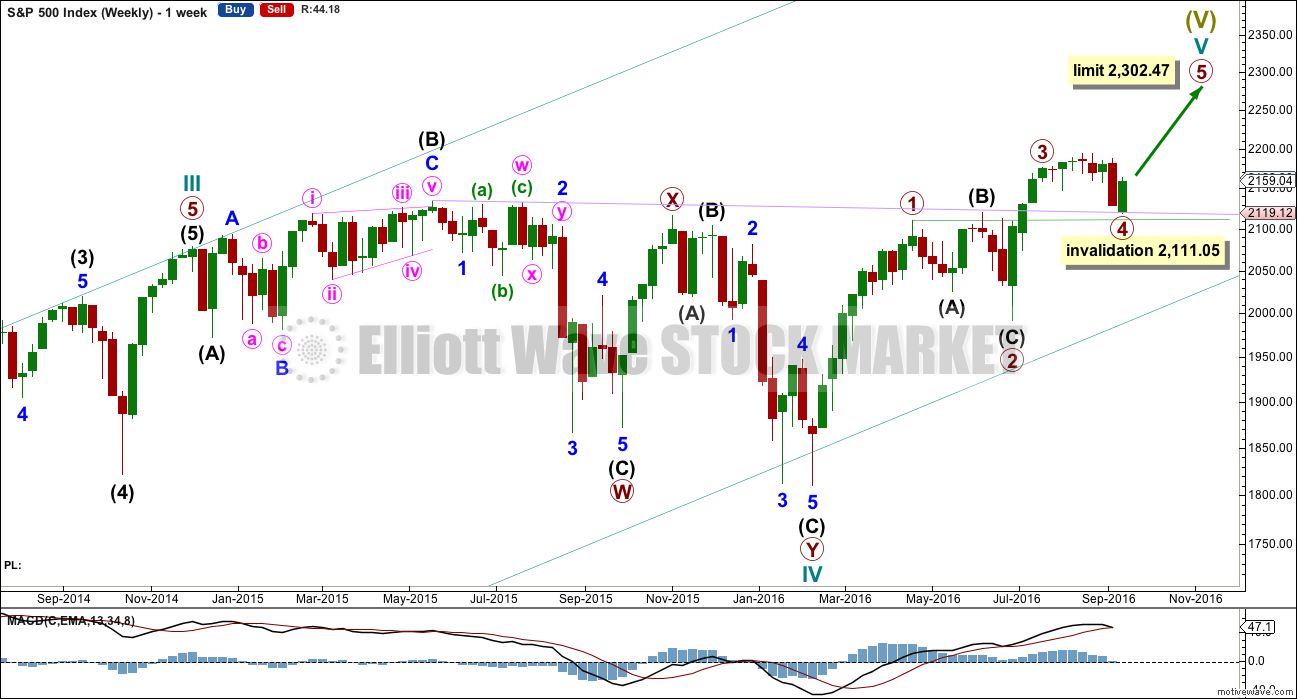
Cycle wave V must subdivide as a five wave structure. I have two wave counts for upwards movement of cycle wave V. This main wave count is presented first only because we should assume the trend remains the same until proven otherwise. Assume that downwards movement is a correction within the upwards trend, until proven it is not.
Primary wave 3 is shorter than primary wave 1, but shows stronger momentum and volume as a third wave normally does. Because primary wave 3 is shorter than primary wave 1 this will limit primary wave 5 to no longer than equality in length with primary wave 3, so that the core Elliott wave rule stating a third wave may not be the shortest is met. Primary wave 5 has a limit at 2,302.47.
Primary wave 2 was a shallow 0.40 expanded flat correction. Primary wave 4 may be exhibiting alternation as a more shallow triangle.
Primary wave 4 may not move into primary wave 1 price territory below 2,111.05.
It is also possible to move the degree of labelling within cycle wave V all down one degree. It may be that only primary wave 1 unfolding. The invalidation point for this idea is at 1,810.10. That chart will not be published at this time in order to keep the number of charts manageable. The probability that this upwards impulse is only primary wave 1 is even with the probability that it is cycle wave V in its entirety.
DAILY CHART
Click chart to enlarge.
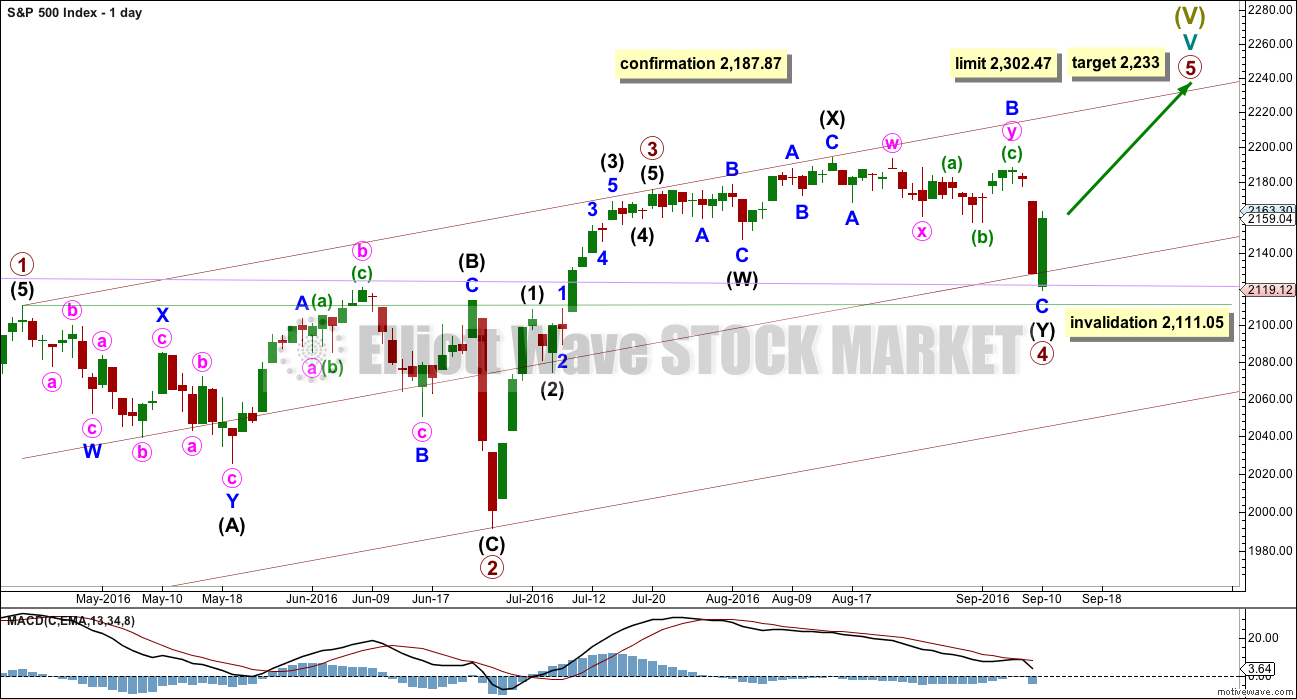
Primary wave 4 may be now complete as a double combination.
The first structure in the double is labelled intermediate wave (W) and is an expanded flat correction. The double is joined by a three in the opposite direction labelled intermediate wave (X). The second structure in the double is a zigzag labelled intermediate wave (Y).
The whole structure for primary wave 4 has a mostly sideways look, but the fact that intermediate wave (Y) has ended comfortably below the end of intermediate wave (W) must necessarily reduce the probability of this wave count. To achieve the purpose of taking up time and moving price sideways the second structure in a double should end close to the same level as the first and this one does not.
Primary wave 4 may not move into primary wave 1 price territory below 2,111.05.
Primary wave 1 lasted 47 days, primary wave 2 was even in duration at 47 days, primary wave 3 lasted 16 days, and so far primary wave 4 has lasted 39 days. The proportions between these waves are acceptable giving the wave count the right look.
If primary wave 5 has begun here, then at 2,233 it would reach 0.618 the length of primary wave 1.
A new high above 2,187.87 would invalidate the alternate daily wave count below and provide some confirmation of this main wave count.
HOURLY CHART
Click chart to enlarge.
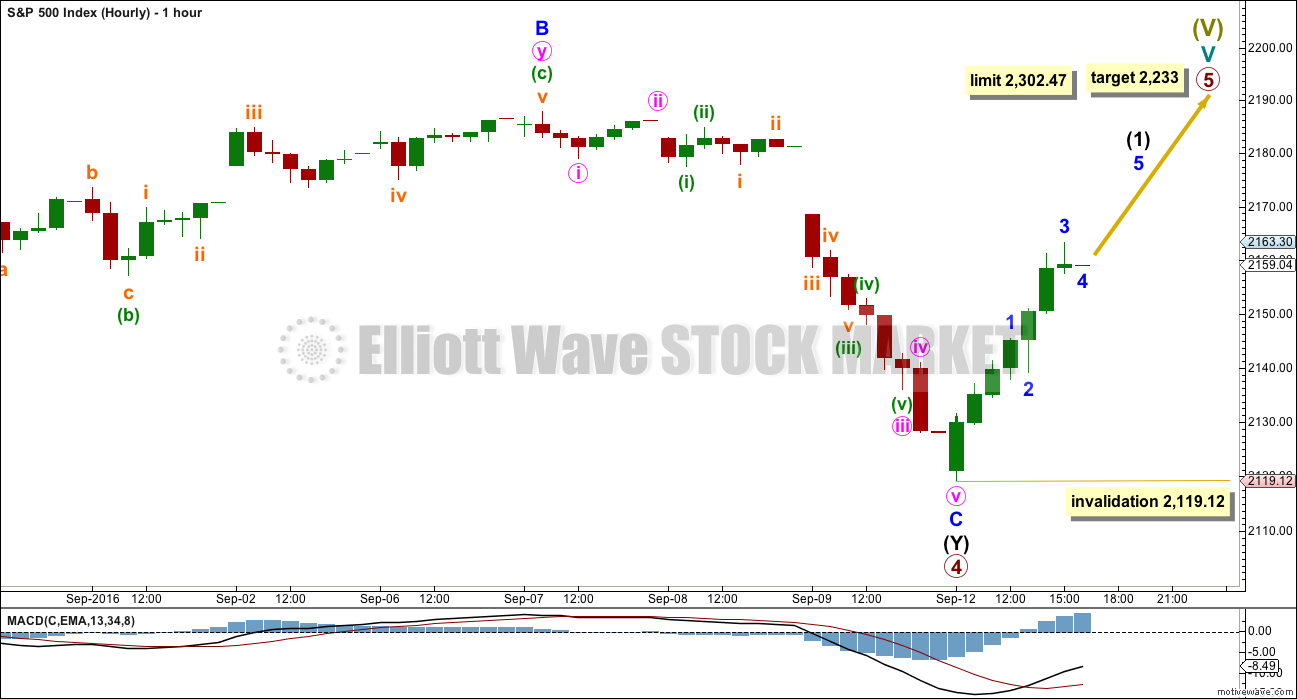
Within the zigzag of intermediate wave (Y), minor wave C is just 2.49 points longer than 2.618 the length of minor wave A. The structure is complete.
So far, within upwards movement, an impulse may be close to completion. This may be intermediate wave (1). These subdivisions fit on the five minute chart.
Within upwards movement, so far minor wave 3 is slightly shorter than minor wave 1. This limits minor wave 5 to no longer than equality in length with minor wave 3, so that minor wave 3 is not the shortest wave and the core Elliott wave rule is met. The limit for minor wave 5 is 24.25 points.
When the impulse upwards is complete, then a second wave correction should unfold and should show up clearly on the daily chart as at least one red candlestick, or most likely two to four red candlesticks or doji. Intermediate wave (2) may not move beyond the start of intermediate wave (1) below 2,119.12.
At this stage, this hourly chart will assume that primary wave 5 will unfold as a more common impulse. It is also possible that primary wave 5 may unfold as an ending diagonal. If upwards movement looks like an unfolding zigzag, then an ending diagonal would be indicated; all sub-waves of ending diagonals must subdivide as zigzags. If an ending diagonal is indicated, then it would be charted and published. For now an upwards wave needs to complete.
ALTERNATE WAVE COUNT
WEEKLY CHART
Click chart to enlarge.
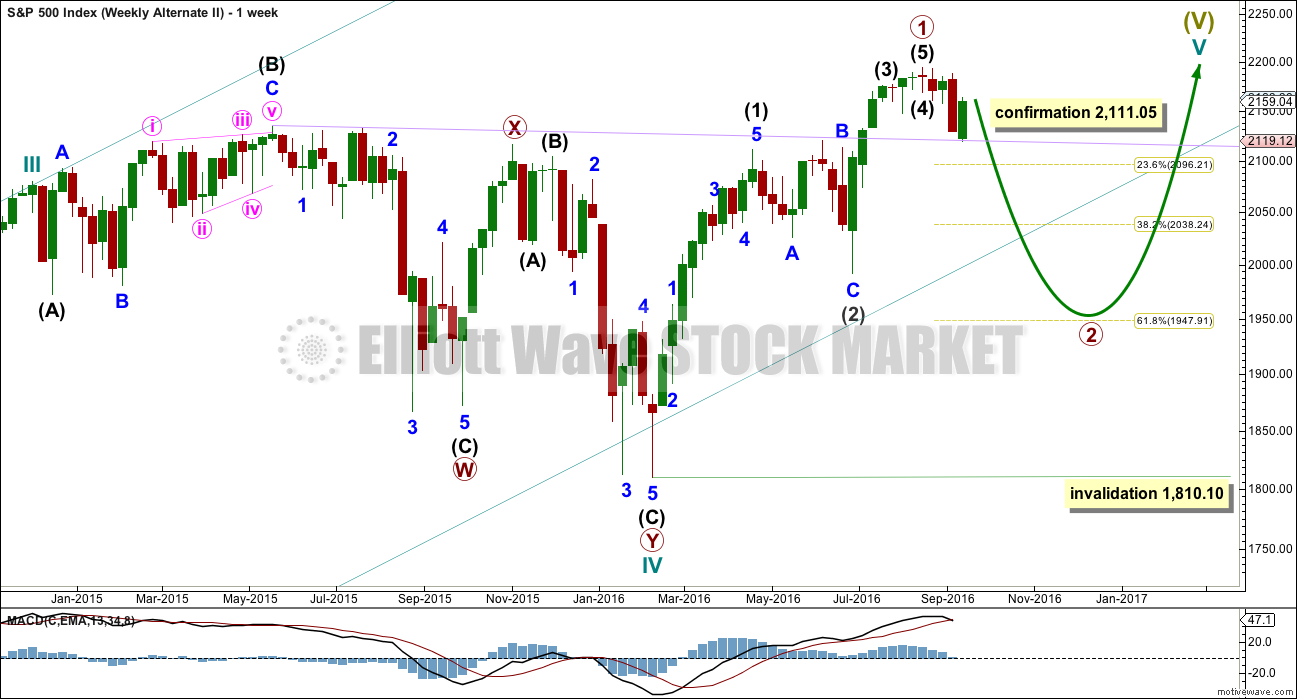
What if an impulse upwards is complete? The implications are important. If this is possible, then primary wave 1 within cycle wave V may be complete.
If the degree of labelling within cycle wave V is moved up one degree, then it is possible that recently Super Cycle wave (V) ended and the S&P has just begun a very large bear market to span several years. This scenario is possible, but absolutely requires price confirmation before it can be taken seriously. Only a new low below 1,810.10 would confirm this very bearish scenario.
If an impulse upwards is complete, then a deep second wave correction may be unfolding for primary wave 2.
Primary wave 2 may not move beyond the start of primary wave 1 below 1,810.10.
DAILY CHART
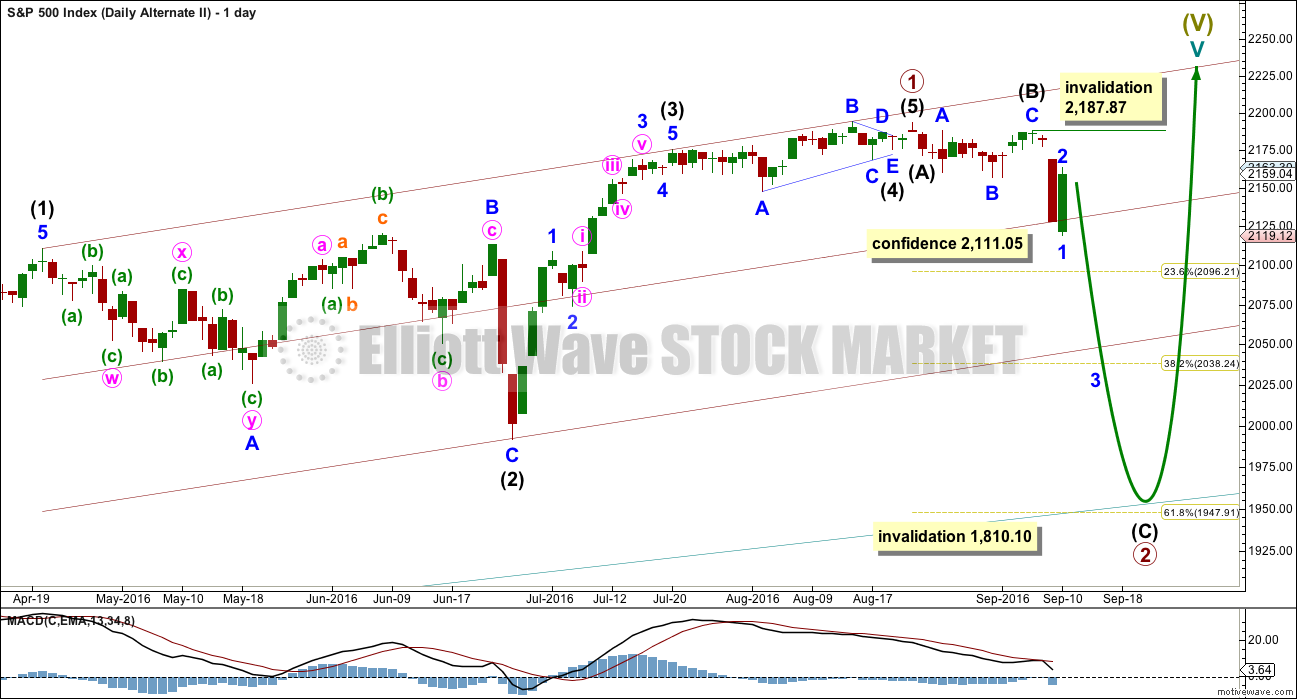
Click chart to enlarge.
If an impulse upwards is complete, then how may it subdivide and are proportions good?
Intermediate wave (1) was an impulse lasting 47 days. Intermediate wave (2) was an expanded flat lasting 47 days. Intermediate wave (3) fits as an impulse lasting 16 days, and it is 2.04 points short of 0.618 the length of intermediate wave (1). So far this alternate wave count is identical to the main wave count (with the exception of the degree of labelling, but here it may also be moved up one degree).
Intermediate wave (4) may have been a running contracting triangle lasting 22 days and very shallow at only 0.0027 the depth of intermediate wave (3). At its end it effected only a 0.5 point retracement. There is perfect alternation between the deeper expanded flat of intermediate wave (2) and the very shallow triangle of intermediate wave (4). All subdivisions fit and the proportion is good.
Intermediate wave (5) would be very brief at only 18.29 points. Intermediate wave (5) is 1.43 points longer than 0.056 the length of intermediate wave (1).
So far primary wave 2 may be unfolding as a zigzag. The common depth for a second wave is the 0.618 Fibonacci ratio of the first wave it is correcting, so a reasonable expectation for primary wave 2 would be to end about 1,950.
Within intermediate wave (C), no second wave correction may move beyond the start of its first wave above 2,187.87.
Primary wave 2 may not move beyond the start of primary wave 1 below 1,810.10. A new low below this point would see the degree of labelling within cycle wave V moved up one degree. At that stage, a trend change at Super Cycle degree would be expected and a new bear market to span several years would be confirmed.
TECHNICAL ANALYSIS
WEEKLY CHART
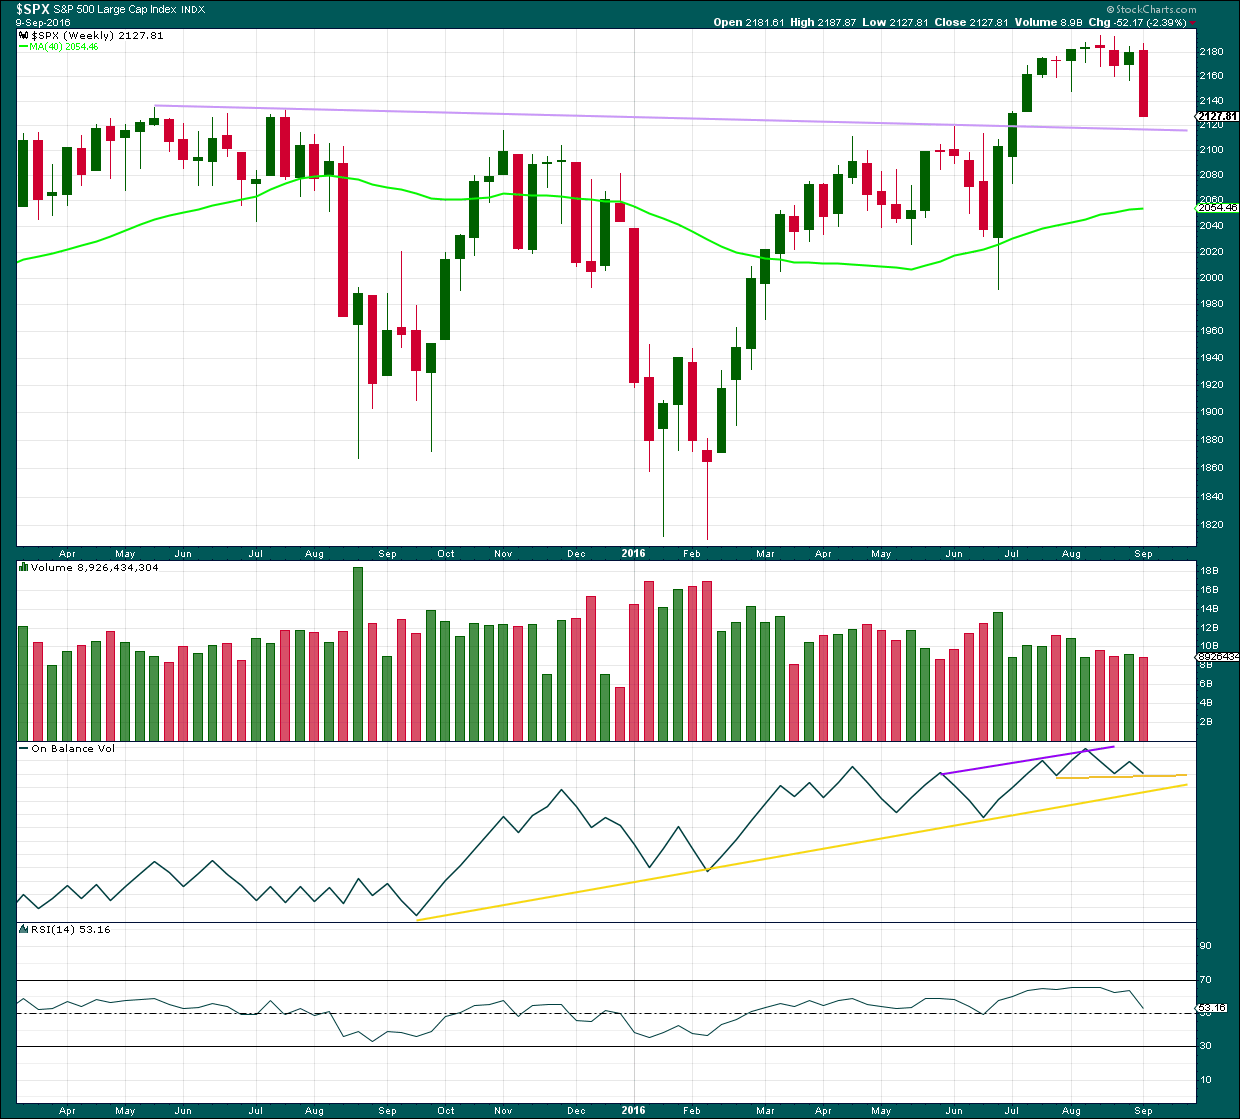
Click chart to enlarge. Chart courtesy of StockCharts.com.
Last week has closed below an important resistance point at 2,134. This is the prior all time high from May 2015. This close is significant. On its own it is not enough to turn to full bearish, but it is one piece of evidence to weigh up.
The long held lilac trend line should be expected to offer strong support for price along the way down. Draw it from the prior all time high in May 2015 to the first small swing high in July 2015. This line is drawn also on weekly Elliott wave charts.
Volume for last week is lighter than the prior upwards week. The fall in price at the weekly chart level does not look like it was supported by volume, but to get a clearer picture it is necessary to look inside last week at daily volume bars.
On Balance Volume has come down to find support at a short term yellow line. The next support line is close by. These lines may assist to halt the fall in price.
RSI is just above neutral. There is plenty of room for price to rise or fall. There is no divergence at the weekly chart level to indicate weakness.
DAILY CHART
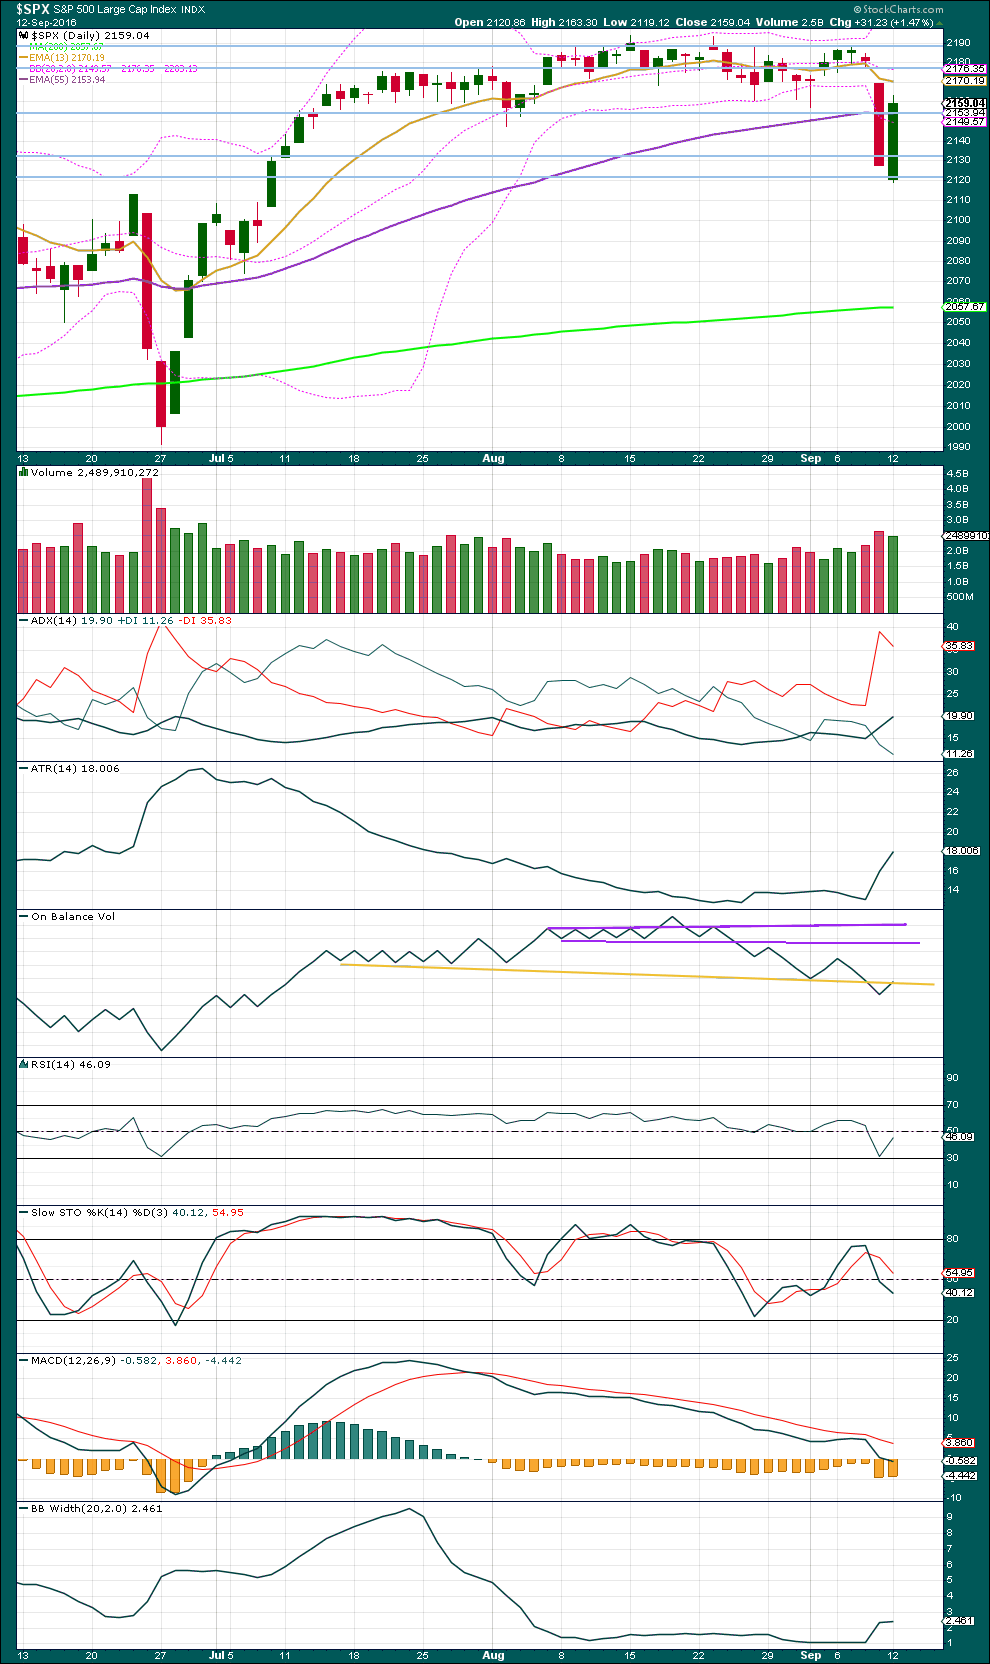
Click chart to enlarge. Chart courtesy of StockCharts.com.
The downwards breakout of Friday has been reversed: price has closed back above prior support at 2,155 for Monday. Volume for Monday is lighter than Friday’s strong downwards day, so the rise in price is not supported by volume. There is more support for downwards movement than upwards. However, volume for both days is substantially higher then almost all days within the prior consolidation.
At this stage, it is looking like the potential downwards breakout of Friday may have been false because most of Friday’s losses have been reversed and price is back within the consolidation zone.
ADX is increasing and the -DX line is above the +DX line. ADX is indicating a downwards trend is in place. ATR strongly agrees as it too is increasing.
Bollinger Bands widened on Friday, but are flat for Monday. On its own this signal is not enough to say a downwards trend is not in place and it offers only a very small cause for concern over a possible downwards trend.
On Balance Volume gave a bearish signal on Friday when it broke below the yellow line. Now it has come up to touch the yellow line. A break above this line tomorrow would negate the prior bearish signal from OBV. If OBV moves down and away tomorrow from this line, it would be another bearish signal and it would be given weight in this analysis.
RSI is not yet extreme. There is room for price to fall further.
Stochastics is not extreme. It exhibits divergence with price from the low of 26th of August to today’s low of 12th September: price has made a substantially lower low but Stochastics has made a higher low. This is bullish and indicates weakness in price. However, divergence with Stochastics is not always reliable. This signal is given very little weight in this analysis.
With more weight given to the signal from On Balance Volume than divergence, on balance it is my judgement that this classic technical analysis is more bearish than bullish at this stage.
VOLATILITY – INVERTED VIX CHART
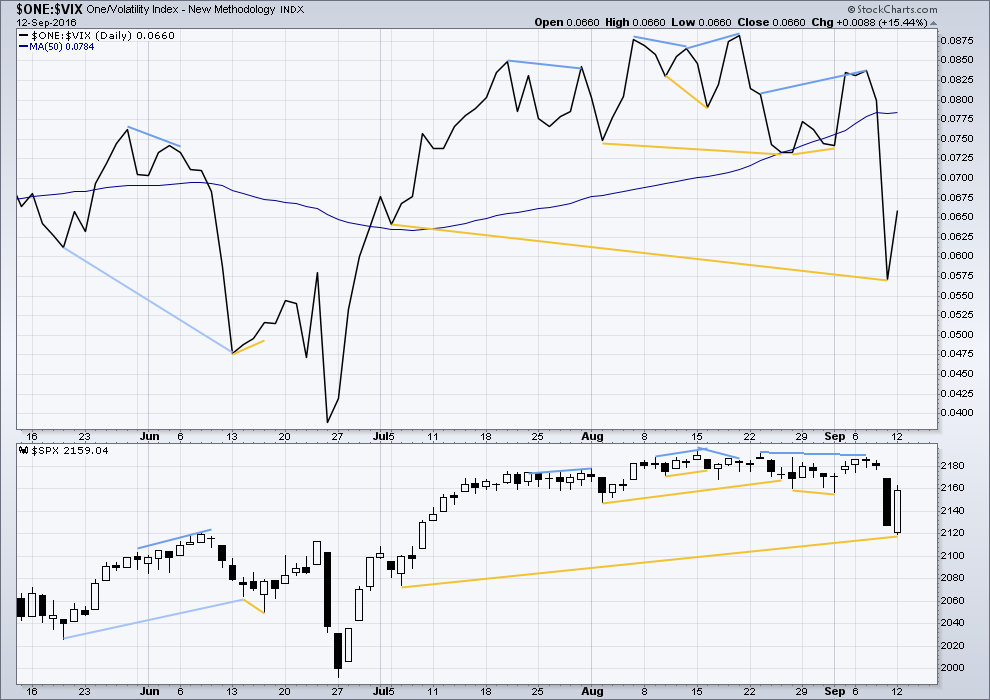
Click chart to enlarge. Chart courtesy of StockCharts.com.
Volatility is declining as price is rising. This is normal for an upwards trend.
There are a few instances of multi day divergence between price and inverted VIX noted here. Bearish divergence is blue. Bullish divergence is yellow. It appears so far that divergence between inverted VIX and price is again working to indicate short term movements spanning one or two days.
There is now longer term divergence noted between price and VIX. From the lows of 6th July to Friday’s low, VIX has made a lower low but price has made a higher low. This divergence is bullish and indicates weakness in price. This bullish divergence has proven to correctly predict a following movement from price: today price moved upwards. At least one more day of upwards movement would be a reasonable expectation to resolve this divergence.
At this stage, this bullish divergence between VIX and price may now be considered to favour both Elliott wave counts, as it may only be useful to predict price direction for a couple of days. This divergence makes no comment on how far price may move, only on the direction.
BREADTH – AD LINE
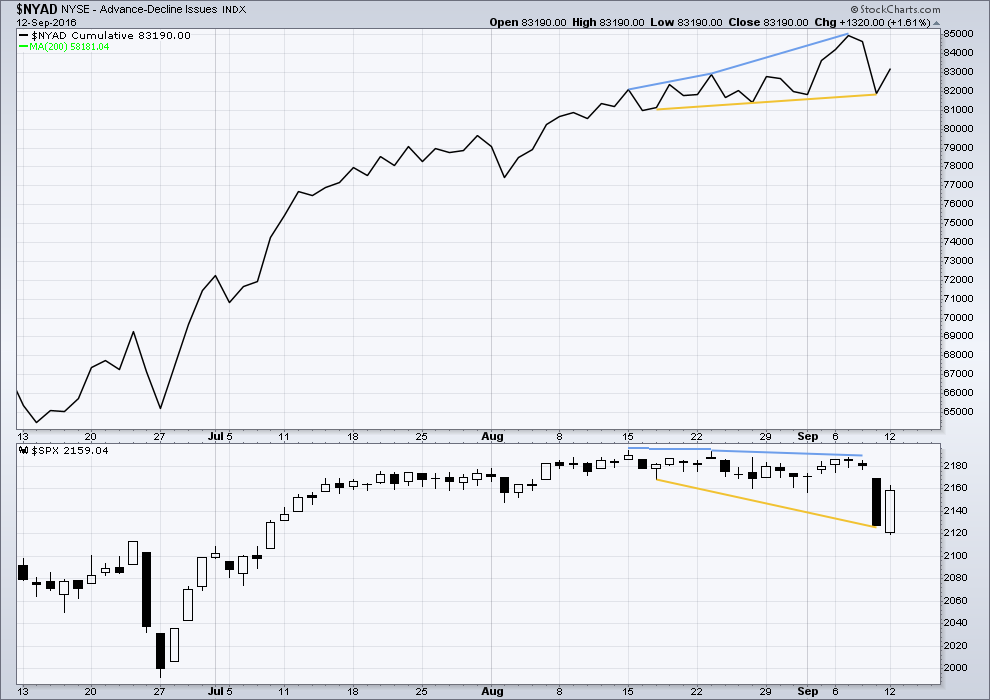
Click chart to enlarge. Chart courtesy of StockCharts.com.
There is support from market breadth as price is rising.
Short term bullish and bearish divergence is again working between price and the AD line to show the direction for the following one or two days.
There is now mid term bullish divergence between price and the AD line: from the low of 17th of August to 9th September price has made a lower low but the AD line has made a higher low. This indicates weakness in price.
This bullish divergence has now been followed by one day of upwards movement, so it correctly predicted the direction for price on the following day. It may be reasonably expected to be followed by at least one more day of upwards movement. At this stage, it makes no comment on how far price may move and so can no longer favour either the main or alternate Elliott wave count.
DOW THEORY
Major lows within the old bull market:
DJIA: 15,855.12 (15th October, 2014) – closed below on 25th August, 2015.
DJT: 7,700.49 (12th October, 2014) – closed below on 24th August, 2015.
S&P500: 1,821.61 (15th October, 2014) – has not closed below this point yet.
Nasdaq: 4,117.84 (15th October, 2014) – has not closed below this point yet.
Major highs within the bear market from November 2014:
DJIA: 17,977.85 (4th November, 2015) – closed above on 18th April, 2016.
DJT: 8,358.20 (20th November, 2015) – has not closed above this point yet.
S&P500: 2,116.48 (3rd November, 2015) – closed above this point on 8th June, 2016.
Nasdaq: 5,176.77 (2nd December, 2015) – closed above this point on 1st August, 2016.
Dow Theory Conclusion: Original Dow Theory still sees price in a bear market because the transportations have failed to confirm an end to that bear market. Modified Dow Theory (adding S&P and Nasdaq) has failed still to confirm an end to the old bull market, modified Dow Theory sees price still in a bull market.
This analysis is published @ 08:50 p.m. EST.
I hope everyone doesn’t mind me hooting my own horn here. UVXY hit my initial target between 25-28. I was very pleased. Unfortunately, I haven’t been watching and I have no idea where we go from here on out.
The VIX did not spike as high as Friday, so since UVXY is still up, I conclude that probability says further market downside. But that is a brief assessment of 5 minutes. Verne would know better than I on this area…
Hoot away Russell. Nicely done 🙂
Thanks, Lara. 🙂
It will be interesting to watch the market if 2100 is taken out….a lot of stops could be hit in a hurry. Coincidently trump leading in polls…market tanking….ppt all dems. Hmmmm…. Ok it’s just a coincidence. It will be tough to resusitate the market if 2100 taken out. The resistance there could prove a heavy overhang for a while. I wonder how far the market needs to fall to effect trump. The talking heads will have to really work hard to tie the drop in the market to him….but if they can the market could make a mighty push up thru election day. Either way the jig is up after the elections and maybe until the end of the year. 2017 is going to hurt bad.
The Current Market Action has absolutely NOTHING to do with the Election POLLS… ZERO… NOTHING! The Powers that be would like you all to believe that it does… It Doesn’t!!!!
It has EVERTHING to do with the Fed and other Economic Factors and more importantly specific Company Valuations, Revenue and Real GAAP Earnings!
Absolutely correct Joseph. They are brain washing folks into thinking Trump is the cause of this meltdown.
The timing of this is EXTREEMLY Interesting! LOOK OUT BELOW!!!!!!!!!!!!!!!
A Disturbing Development: Interactive Brokers Implements Price Caps; Are Trade Controls Next?
by Tyler Durden
Sep 13, 2016 3:41 PM
In a rather stunning development, moments ago Interactive Brokers unveiled a previously unseen warning, one called a “Mandatory Cap Price”, which warns traders that the brokerage may set a cap, a floor or outright cancel any order that would otherwise be marketable, due to a “price that is not consistent with a fair and orderly market.”
Needless to say, for traders agreeing that they are willing to “trade” only based on what some arcane algorithm decides is a “fair and orderly market”, or otherwise get kicked out, leads to numerous questions, chief among which is: just what does IB know about what may be about to happen, and why is the most basic function of a marketplace – the exchange between a willing buyer and seller – suddenly compromised?
http://www.zerohedge.com/news/2016-09-13/troubling-development-interactive-brokers-implements-price-caps-are-trade-controls-n
Dogfight around DJI 18,000.00.
The banksters seem to think this is a psychologically important pivot and they are right. Four huge cash dumps in the last few hours attempting to stave off a break….
If we don’t see a sell-off into the close we are going to once again have to wait on futures to tell us what probably comes next…’Bye all!
The banksters in battle array over DJI 18,000.00
Will they hold it?!
Hey Russell;
You may want to tighten your stop on your UVXY shares. I just moved mine (trailing) from five points to three….I know you’re happier today…. 🙂
Yes, Verne, very much happier about today…hard to tell which way the market goes now, but bears seem to finally have an advantage. Everyone, please forgive me, haven’t had a chance to watch the market today as I’ve been in class; plus I slept in due to being upset–I’m an emotional person which doesn’t make for a very good trading personality.
Moment of truth approaching. Let’s see if DJI 18,000.00 bites the dust. If it does, I start loading up on UVXY bullish put spreads for the big event. Go bears! 🙂
Bill Clinton is a most intriguing character. I saw a clip from an upcoming Larry King interview where he has that head down, slightly side ways look at the camera and says with a completely straight face: ” She was dehydrated…) 🙂
You mean the interview with Larry King on RT?
RT = Russian TV
Yup!
Is the media going to make a huge issue him being interview by Larry King?
I seem to recall that’s exactly what they did when someone else was recently interviewed by Larry King. It was an earth is ending issue!
Looking for a break of the pivots to signal more downside. Of course being the inveterate gunslinger, I already closed out a few doubles today based on the futures action. I STILL do not think the implications of those compressed BBs have been fully realised. I expect the real action to the downside remains ahead….
Looking like we will get that volatillity 10X trade in a day or two…. 🙂
Marty Feldstein on Bloomberg this morning:
“I think the FED keeps looking for reasons to not raise rates…”
Ya think????!!!!!
Fed has NO Credibility…. ZERO! This is all BS Fed Propaganda… they will NEVER raise Rates again! Groundwork for banning Cash is in full swing and negative interest rates in the USA will Follow in 2017.
Lockhart… stepping down!
The thing I cannot figure out is exactly who do these guys think is buying any of their balderdash! Nothing but pure bunkum I tell ya…! 🙂
FED will raise rates minimum 1 time this year. At least twice next year. The 32 year bond market bubble is done. They may have bounces now and then but for long term guys, selling bonds will be a great trade. Bonds are the greatest bubble out there.
🙂
That’s what they said in 2015… again in 2014… again in 2013. Yea… Yea… Yea… right! Ahhh BS!
DOT PLot my… A_S!
Fed has NO Credibility…. ZERO!
They won’t normalize rates and haven’t stared to normalized rates (They should have started to normalize in 2011/2012) because…
THE TRUTH and The ONLY valid reason is… They Know the economic numbers that are put out are COMPLETELY BOGUS!
If the economic numbers were valid and real since 2011/2012 they would have raised and normalized the Fed Funds rate to at least 3.50%- 4.00% by 2015!
They won’t even move a quarter of 1% because the economies worldwide have been and continue to be in recession! NO OTHER VALID REASON!
You all have been served the biggest Con Job in the History of the World! AND that continues to this day!
I don’t think too many folk understand what is going to happen when the FED is FORCED to raise rates and why they will not, cannot do it unless under tremendous duress. Is the general public really that clueless??!! I just cannot believe it!! 🙂
interest rates increasing by 1 percentage point on average will cause interest payments to increase by $2 Trillion. Rates are not going up. They have painted themselves into a corner and we will default on it…sooner or later.
Hold cash under your mattress.
Bingo! I think too many folk simply have no clue what it means for debt servicing and why the hands of the FED are tied….
While there are trillions of bonds, mostly government debt currently with negative yields, there had never been a case in all of recorded history when any bond has sported a negative yield on the bond’s initial issuance…until today that is. A German and a French company (Henkel and Sanofi) have both now issued bonds that are guranteed to loose you money if held to maturity with a yield on issue of – 0.5%
Will somebody tell please me exactly who the financial morons are that are willing to PAY an entity to loan them money???!!!!!
We just gotta be close to a top…just gotta…!
Wow, there’s no where safe to put your money anymore…nowhere! 🙁
Lara,
I understand the each market has its own character, but I also see that some markets are very correlated. For example, I see that the S&P e-mini may follow the Nasdaq e-mini. My question is, if this correlation is true, should the wave counts be similar and can you use the wave count of one to clarify the wave count of the other?
In theory it is possible, but in practice it doesn’t actually help much.
Only if the wave count of one correlated market is really clear and the other is unclear would this help.
Often neither are clear, and always there will be alternates.
Then the question becomes, which one is right and which one is wrong? Only subsequent price answers the question.
I hope this makes sense.
I do keep wave counts update for Nasdaq. I do follow what it’s doing. But for that particular market I suspect it does not have EW structures that are as clear as the S&P. Nasdaq appears to have truncations commonly, and that makes it really hard to analyse.
The banksters are slowly unwinding their futures contracts they entered to defend key pivots in DJI and SPX. It is really amazing that they are being allowed to do so in such a leisurely fashion. They have the heavy-hitting short sellers so intimidated that they can get away with a “managed decline”. That, however, could rapidly change if we break those privots….
Keep a sharp eye on VIX. If it takes out 20.51 today, it will be the set-up for a possible ten-bagger trade on volatility. The trigger will be a close back beneath the upper BB. The more conservative trigger is the second close below the upper band as one occasionally sees another pop above it after the first close below. If we take out 20.51 tomorrow I do not expect this to happen prior to at least another few days of declines.
I am starting to wonder if the absence of these formerly typical capitulation spikes is betraying the remarkable dearth of traders participating in these markets….nevertheless, VIX is the one instrument the least susceptible to bankster legerdemain…when the trigger comes don’t le the ridiculous bid/ask deter you! 🙂
There have been a few instances in which the banksters bought futures out of being deep in the red with the following day seeing a huge run-up. It has not happened very often, but for what its worth, when this happened in divergence from global markets which were down significantly as was the case today, the gains were all given back, and more, a day or two later. I am keeping a very close eye on futures and if they do the opposite from last night and keep heading lower overnight, tomorrow will be a good day for the bears…if the pattern holds, we will handily take out both DJI 18,000.00 and SPX 2000.00; we should know in a few hours…
FTSE and Shanghai were down a lot.
You’re right Verne, that divergence is important. We may have clarity as to which wave count is right tomorrow.
The fact that in Lara’s count wave 3 is shorter than wave 1 gives us some extremely powerful strategic information and it is important not to miss it folks, namely, the limitation to the length of wave five at about 2302.47. That is less than 150 points away in a bull market that has now lasted in excess of seven years! I am placing a June 2017 SPY 229/230 bear call spread in my trading accounts that I will be observing with great interest over the coming months and adding a few contracts every week once wave five up is confirmed. I am sure other members can think of inventive ways to use this information in setting up trades. Please share! Thank you!! 🙂
Foist!