
Last analysis expected a little downwards movement for Tuesday’s session.
Price moved higher in a small range.
Summary: While price remains below 2,193.42, it is still likely that a final small wave down will end the consolidation. A new high above 2,193.42 would indicate that the consolidation is over and price should then continue higher to 2,287 but not above 2,357.54.
Last monthly chart for the main wave count is here.
New updates to this analysis are in bold.
MAIN WAVE COUNT
WEEKLY CHART
Click chart to enlarge.
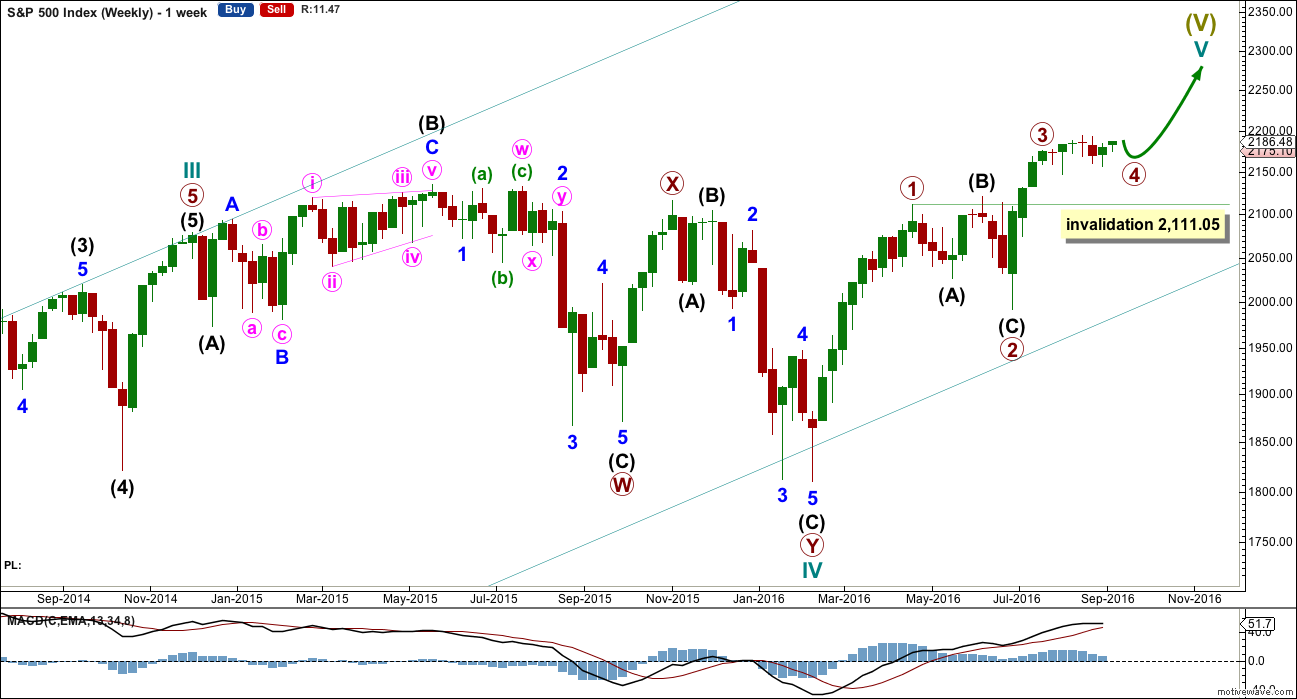
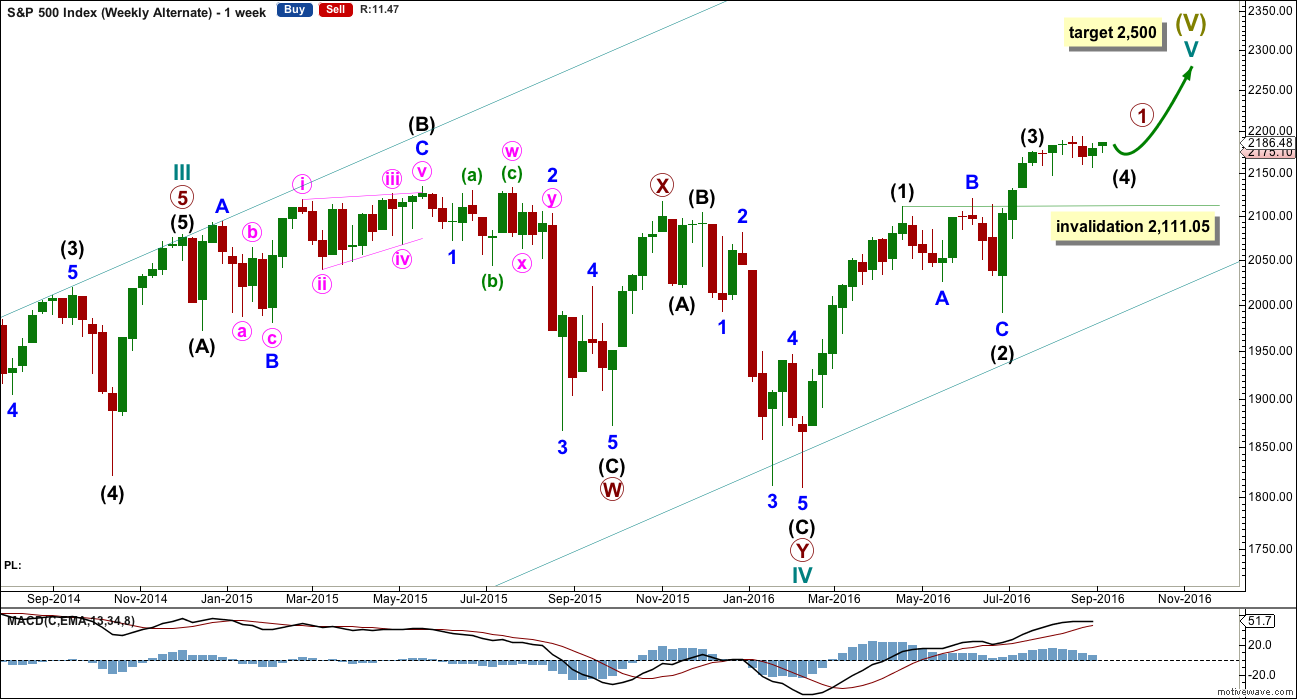
Cycle wave V must subdivide as a five wave structure. So far upwards movement is unfolding as an impulse with the fourth wave completing. This may be primary waves 1, 2, 3 and now 4, with primary wave 5 upwards still to come.
Primary wave 3 is shorter than primary wave 1, but shows stronger momentum and volume as a third wave normally does. Because primary wave 3 is shorter than primary wave 1 this will limit primary wave 5 to no longer than equality in length with primary wave 3, so that the core Elliott wave rule stating a third wave may not be the shortest is met. Primary wave 5 will be limited to no longer than 183.95 points in length.
Primary wave 2 was a shallow 0.40 expanded flat correction. Primary wave 4 may be exhibiting alternation as a more shallow triangle.
Primary wave 4 may not move into primary wave 1 price territory below 2,111.05.
DAILY CHART
Click chart to enlarge.
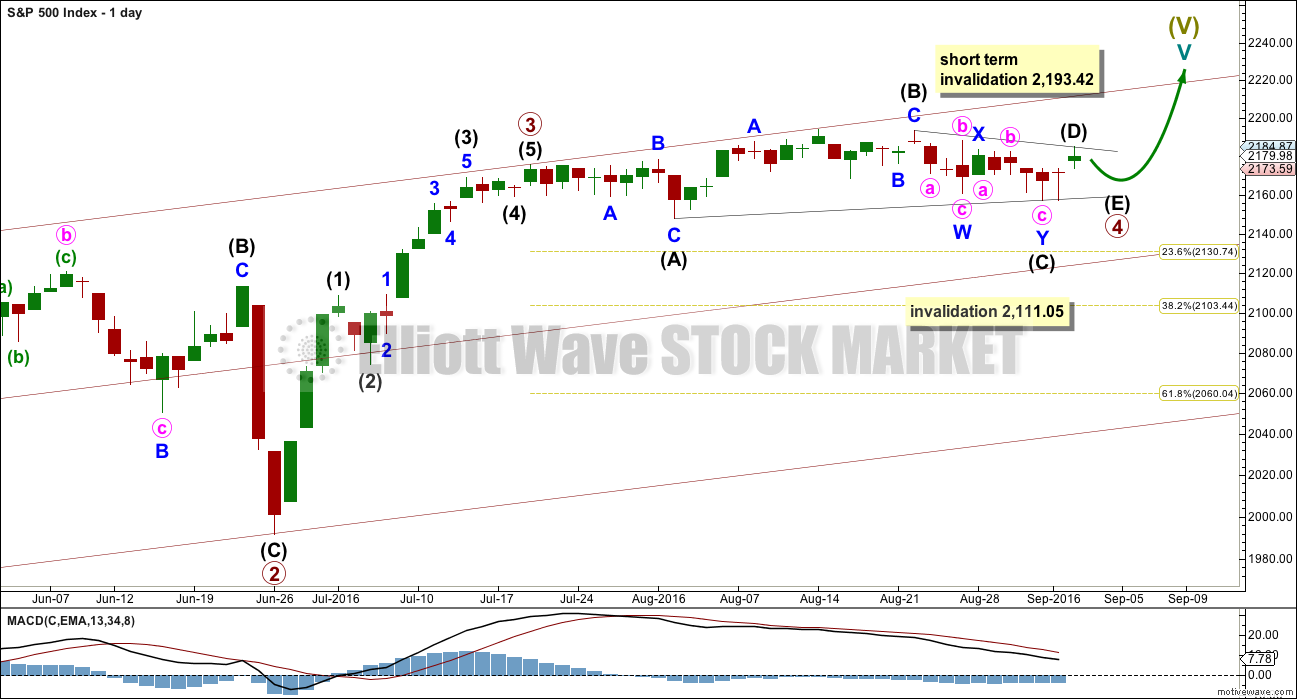
Primary wave 2 lasted 47 days (not a Fibonacci number). Primary wave 3 lasted 16 days (not a Fibonacci number).
If primary wave 4 was over on 2nd of September, as per the alternate hourly count below, then it would have lasted a Fibonacci 34 days. If it continues for another one or few days, as per the main hourly wave count below, then it may not exhibit a Fibonacci duration.
The maroon channel is redrawn at the end of this week. Draw it first from the end of primary wave 1 (this can be seen on the weekly chart) to the end of primary wave 3, then place a parallel copy on the end of primary wave 2. If primary wave 5 comes up to touch the upper edge of this channel, then look out for a possible end to this structure there.
HOURLY CHART
Click chart to enlarge.
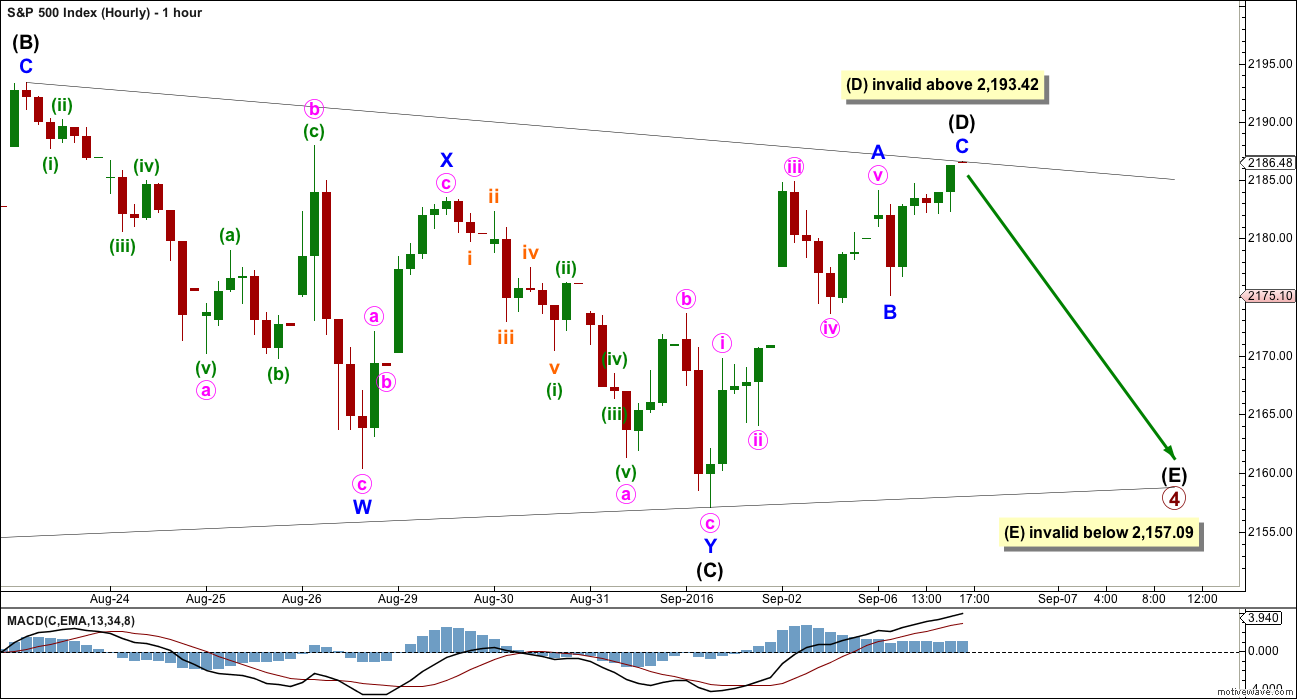
Intermediate wave (C) fits well as a double zigzag. One of the five sub-waves of a triangle should be a double.
Intermediate wave (D) no longer has a good fit as a completed zigzag. Minute wave v of minor wave A is slightly truncated, and minor wave C does not look like a five. If it continues any higher, then it may not move substantially above the end of intermediate wave (B) at 2,193.42.
If primary wave 4 is a contracting triangle, then intermediate wave (D) may not move beyond the end of intermediate wave (B).
If primary wave 4 is a barrier triangle, then intermediate wave (D) should end about the same level as intermediate wave (B), so that the (B)-(D) trend line is essentially flat. Unfortunately, this means that intermediate wave (D) may end slightly above the end of intermediate wave (B). This rule is not black and white.
Intermediate wave (E) is most likely to end short of the (A)-(C) trend line. The next likely point for it to end would with an overshoot of the (A)-(C) trend line. Intermediate wave (E) may not move beyond the end of intermediate wave (C) below 2,157.09. This invalidation point for the triangle is black and white.
ALTERNATE HOURLY CHART
Click chart to enlarge.
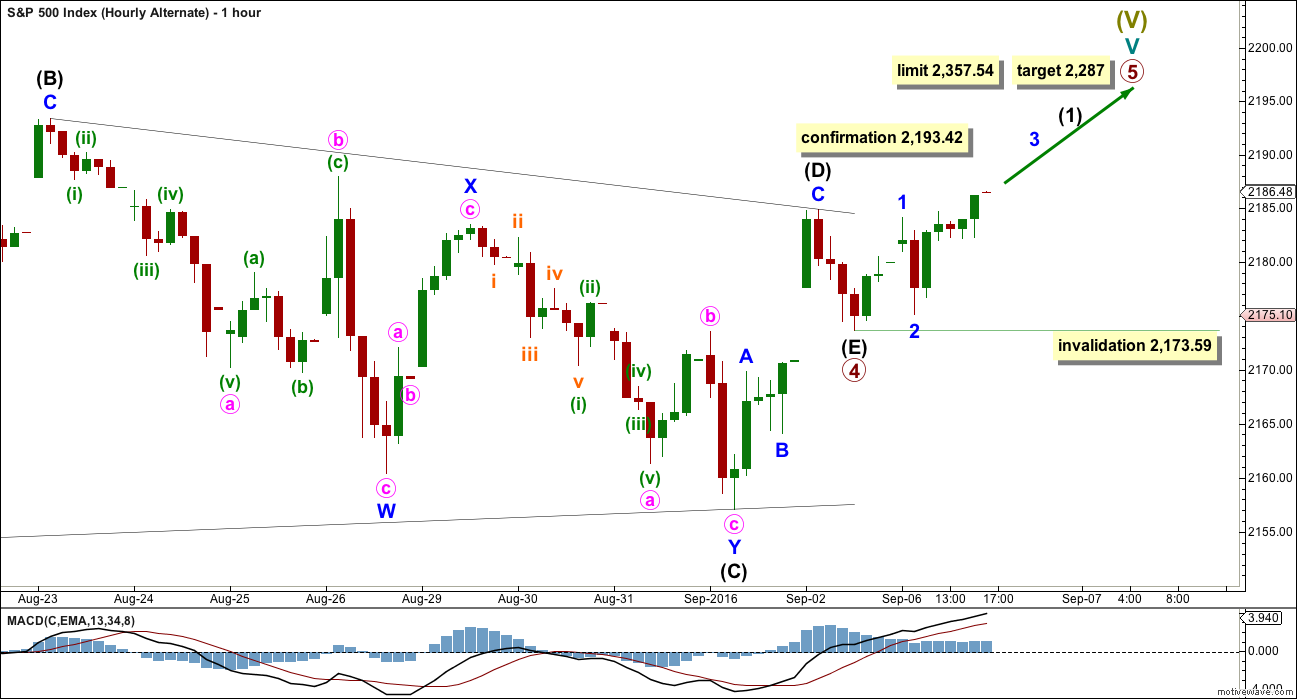
If price continues higher and moves reasonably above 2,193.42, then this alternate hourly wave count would be confirmed.
It is possible to see the triangle for primary wave 4 as complete. Intermediate wave (E) may have fallen well short of the A-C trend line and been very brief. This is possible.
The structure for intermediate wave (D) now fits again as a three.
If primary wave 4 is over here, then the limit for primary wave 5 is at 2,357.84 where it would reach equality in length with primary wave 3. Primary wave 5 may not be longer than equality in length with primary wave 3, so that primary wave 3 is not the shortest actionary wave.
Within primary wave 5, no second wave correction may move beyond the start of its first wave below 2,173.59.
At 2,287 primary wave 5 would reach 0.618 the length of primary wave 3.
ALTERNATE WAVE COUNT
WEEKLY CHART
Click chart to enlarge.
This alternate is identical to the main wave count with the exception of the degree of labelling within cycle wave V.
Here the degree of labelling is moved down one degree. It is possible that only primary wave 1 is completing as a five wave impulse. When it is complete, then primary wave 2 would be expected to be a deep pullback which may not move beyond the start of primary wave 1. At that stage, the invalidation point would move down to the start of cycle wave V at 1,810.10. At that stage, a new low below this point would confirm a bear market for both Elliott wave and Dow Theory.
At 2,500 cycle wave V would reach equality in length with cycle wave I. This is the most common ratio for a fifth wave, so this target has a good probability.
At this stage, this alternate wave count differs only in the degree of labelling to the main wave count, so subdivisions for daily and hourly charts would be labelled the same.
TECHNICAL ANALYSIS
WEEKLY CHART
Click chart to enlarge. Chart courtesy of StockCharts.com.
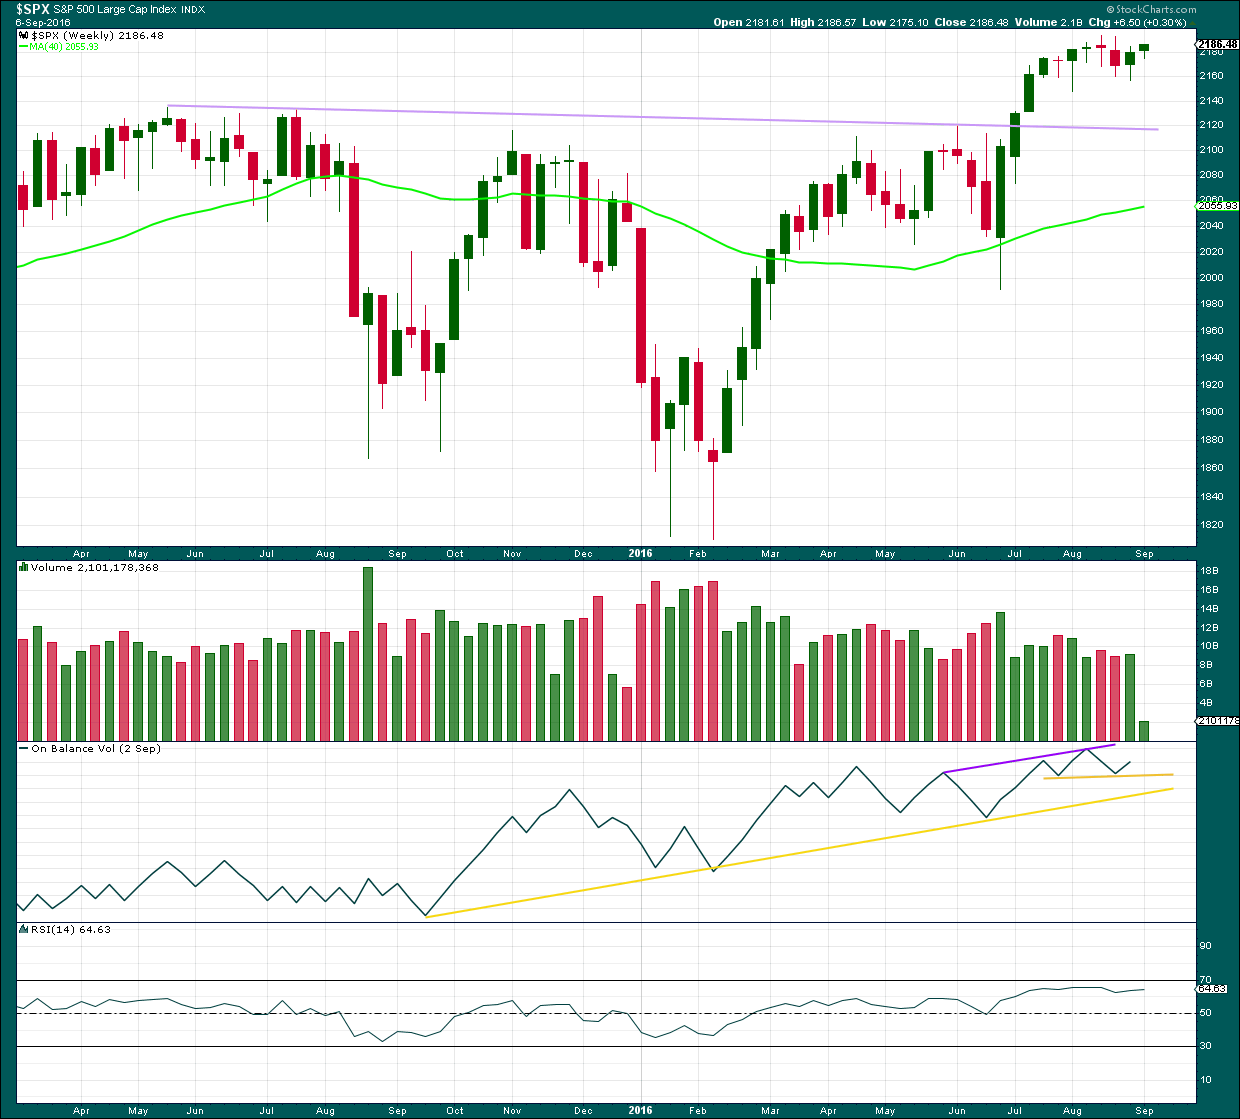
Last week completed a green weekly candlestick with a long lower wick. The colour and lower wick are bullish. The slight increase in volume supports the rise in price and is also bullish.
On Balance Volume gave a bullish signal last week as it moved up and away from the upper yellow support line.
RSI is not extreme and exhibits no divergence with price. There is still room for price to rise.
DAILY CHART
Click chart to enlarge. Chart courtesy of StockCharts.com.
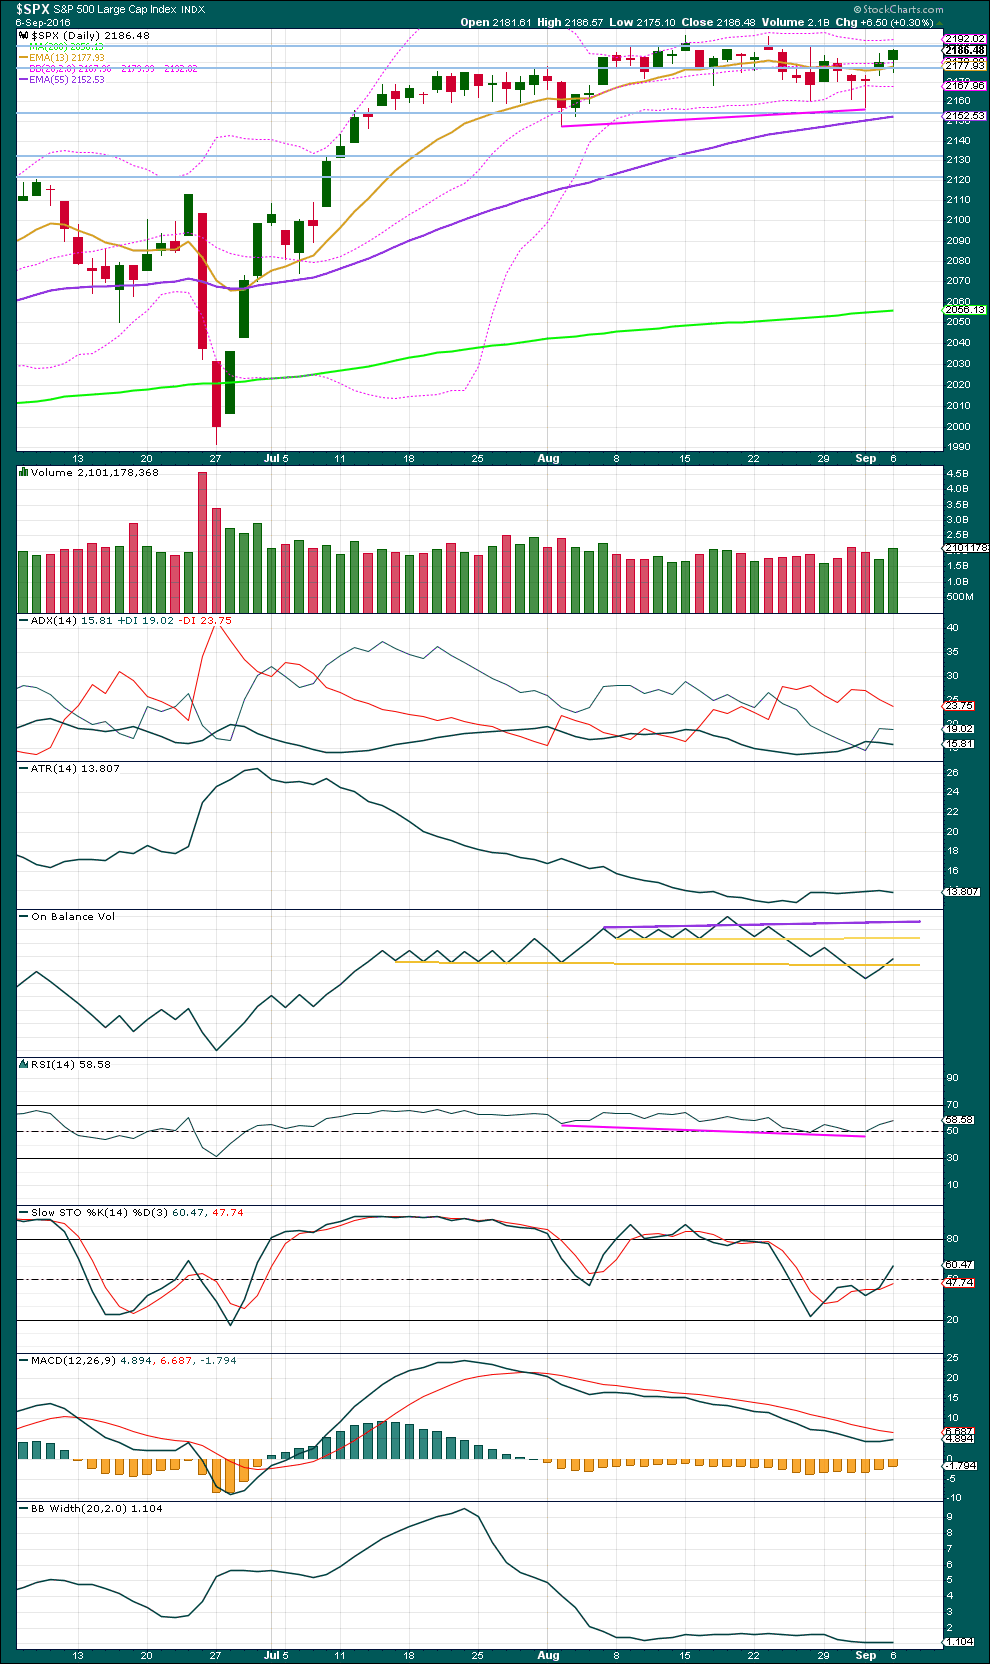
Tuesday’s upwards day with an increase in price is bullish and supports the alternate hourly Elliott wave count. The long lower wick on today’s candlestick is bullish.
Price may find resistance here about 2,190. A break above this resistance line on a day with high volume would indicate a classic upwards breakout from the consolidation.
ADX is declining, indicating the market is not trending. ATR agrees as it is overall flat to declining. Bollinger Bands remain tightly contracted.
RSI is not extreme. The divergence between RSI and price from 2nd of August to 1st of September may now be resolved by two days of upwards movement.
Stochastics is returning from almost oversold. It is at neutral. There is room for price to rise further.
VOLATILITY – INVERTED VIX CHART
Click chart to enlarge. Chart courtesy of StockCharts.com.
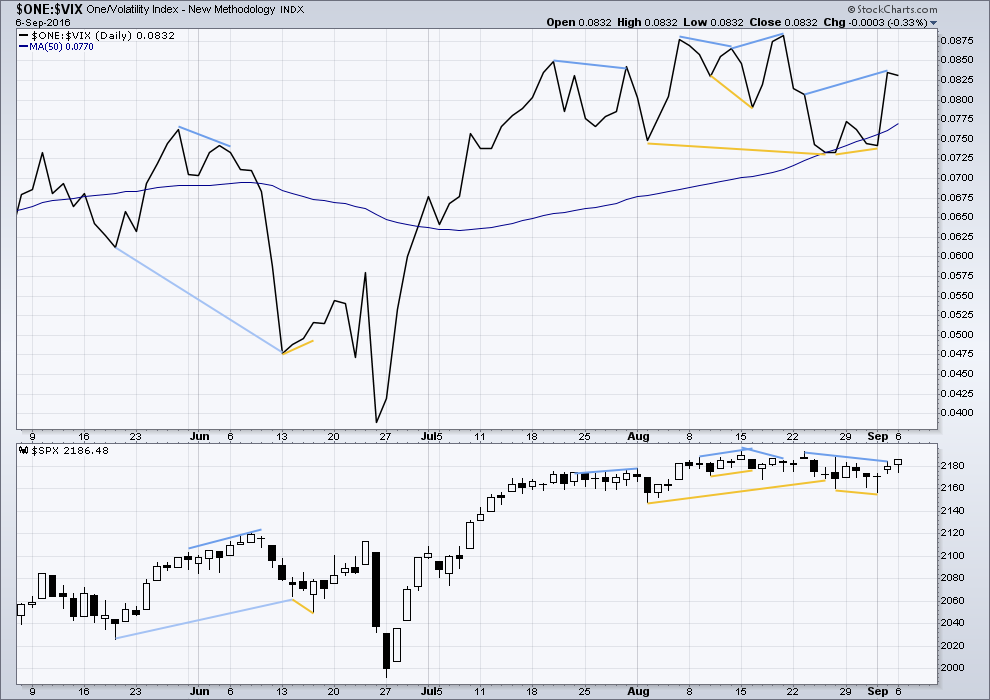
Volatility is declining as price is rising. This is normal for an upwards trend.
There are a few instances of multi day divergence between price and inverted VIX noted here. Bearish divergence is blue. Bullish divergence is yellow. Each of these instances was followed by expected price movement if only for two days. Divergence with VIX and price is not always working, but it is still sometimes working. So it will be noted.
It appears so far that divergence between inverted VIX and price is again working to indicate short term movements spanning one or two days.
At the end of last week, there is some bearish divergence between price and VIX from the highs of 23rd of August to 2nd of September: VIX has made a higher high but price has made a lower high. This divergence indicates weakness in price. This bearish divergence has not been followed by downwards movement for the next day. It may not have worked in this instance.
Price today moved higher but VIX moved lower. This is very short term further bearish divergence. It remains to be seen if it will work.
BREADTH – AD LINE
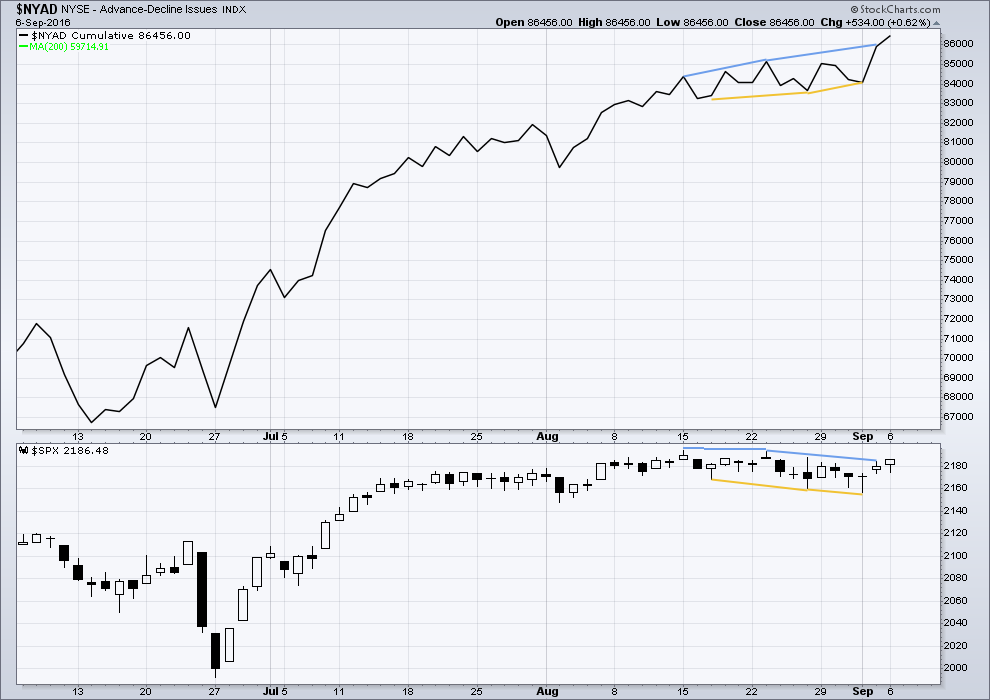
Click chart to enlarge. Chart courtesy of StockCharts.com.
There is support from market breadth as price is rising.
Short term bullish and bearish divergence is again working between price and the AD line to show the direction for the following one or two days.
Some mid term bearish divergence is noted between the AD line and price at the end of last week: from the high of 23rd August to the high of 2nd September, the AD line has made a higher high but price has made a lower high. This indicates weakness in price. This bearish divergence has not been followed by downwards movement on the following day. It may not be working or it may yet develop further before price moves lower.
DOW THEORY
Major lows within the prior bull market:
DJIA: 15,855.12 (15th October, 2014) – closed below on 25th August, 2015.
DJT: 7,700.49 (12th October, 2014) – closed below on 24th August, 2015.
S&P500: 1,821.61 (15th October, 2014) – has not closed below this point yet.
Nasdaq: 4,117.84 (15th October, 2014) – has not closed below this point yet.
Major highs within the new bear market:
DJIA: 17,977.85 (4th November, 2015) – closed above on 18th April, 2016.
DJT: 8,358.20 (20th November, 2015) – has not closed above this point yet.
S&P500: 2,116.48 (3rd November, 2015) – closed above this point on 8th June, 2016.
Nasdaq: 5,176.77 (2nd December, 2015) – closed above this point on 1st August, 2016.
Dow Theory Conclusion: Original Dow Theory still sees price in a bear market because the transportations have failed to confirm an end to that bear market. Modified Dow Theory (adding S&P and Nasdaq) has failed still to confirm an end to the old bull market, modified Dow Theory sees price still in a bull market.
This analysis is published @ 10:10 p.m. EST.
It would appear that the rising wedge is the price structure of persistent intervention in an attempt to maintain a tiring trend. The last time two wedges appeared in tandem the break from the second one was to the upside. The current move still appears corrective to me but in a bizarro market things are rarely what they seem. Will hold spreads for one more day in what clearly continues to be a moribund market. ‘Bye all!
Northman Trader article on central bank “intervention bonanza”
https://northmantrader.com/2016/09/07/time-to-get-real-part-i/
Yep. The situation is becoming the theatre of the the absurd. I cannot remember the last time we saw any serious directional indication in overnight futures so it makes one wonder if the banksters are loosing their mojo after being turned back from resistance so often. On the other hand, there are simply no sellers willing to step up to the plate ergo we remain the in the arena of the undead. I suspect any attempted break to the upside is going to be sold. Considering the market’s torpidity in the absence of sellers, I expect any break to the downside is going to unfold like a run-away train. I plan on being off the tracks…
Another day…. another down move followed by an “unexpected (?) ” invisible hand …and the SP is almost back into positive territory.
As I mentioned a few weeks ago, I am new into Elliot Waves Theory. I really and sincerely appreciate Lara’s work and your comments.
My intuitive feeling is that we are not facing human behaviour in this market. We are facing some kind of “artificial intelligence” (let’s call it this way), a mix of algos and central banks policies with a lot of investment power watching from behind the scenes. So the market “waves” are not real waves. They are not issued from any normal human behaviour, on which all of Eliott’s theory is based. We cannot try to understand this market with a theory based on human psychology, because there is no psychology at all. Something is gonna happen. When it will happen, the market will suddenly move, and then, only then, we will better understand…
Please, english is not my mother tongue so no offense to anyone at all. I appreciate a lot being part of this group. I just try to understand what is happening…
Thank you all and … wait and see
Movement below 2173.59 will invalidate alternate and confirm main count with fourth wave still incomplete…
Downside break underway. Should head for the 2165 area followed by sharp reversal to the upside…
Yet another rising wedge. We should get a break from it later today. Wave count suggests initial break will be to down side to complete a fourth wave. I expect it will be quickly reversed to begin final fifth wave up…2160 should hold imo for the bullish case…
I am re-posting my post from yesterday because of a great article posted overnight on the same topic, a link will follow my repost to that full article…
Joseph
September 6, 2016 at 7:25 am
AND it begins…
The promotion of the Narrative to do away with CASH… Starting with the $100 Bill!
The ground work being laid by Kenneth S Rogoff with the book The Curse of Cash! An Obama and Clinton Crony from Harvard.
He is spewing his garbage on CNBC this morning and the Federal Reserve Lovers on that station are playing along with the Narrative like a bunch of foolish children!
Negative Interest Rates will be arriving in the USA in 2017/2018! So you will be paying anywhere from .5% to 2.0% in negative interest on any dollars held in checking or savings accounts.
ALL these people laying the foundation of this narrative should be thrown into jail for life… ALL of them!
Wake up people! Don’t Buy the Sales Pitch!!!
Now parts of the article from overnight + the link:
{ “Another 25% of the portfolio is allocated to cash.
But cash is becoming dangerous to own, with more and more governments floating the idea of cash controls or all-out cash bans.
The latest assault from the establishment on physical cash comes via Harvard Professor Ken Rogoff, who advocates for the abolition of cash in a recent essay ‘The curse of cash’.
Rogoff, of course, relies on the old fascistic premise that physical cash can only be used for the purposes of crime.
This is just a convenient excuse to be marketed to the gullible.
The fundamental reason why the establishment wants to abolish cash is as a necessary precursor to the imposition of negative interest rates.
As interest rates head below zero, savers will rightly be resistant to the idea of paying banks for keeping cash on deposit.
The obvious answer for any responsible, sensible saver is to remove his/her savings from the bank and hold physical cash.
Policymakers will try to prevent this from happening at all costs; even a small uptick in cash withdrawals poses extreme risk for many already-fragile banking systems.
Rogoff and like-minded policy wonks also claim that when people ‘hoard cash’ it’s bad for the economy; in their view, people should be spending, not saving.
This is an incredibly disturbing view shared by many policymakers with God complexes; as Jay Hughes responded to Rogoff in a Wall Street Journal editorial,
“When someone uses the term ‘hoarding’ instead of ‘saving’, it means deep down they believe that others are more entitled to your money than you are.”
Hughes is right.
Our entire central bank controlled financial system is based on the premise that unelected, unaccountable bureaucrats should be able to direct individuals’ consumption and production behavior from ivory tower conclaves.
And they have abused their authority to the point that two entire asset classes are now poisonous.” }
http://www.zerohedge.com/news/2016-09-06/when-they-say-hoarding-instead-saving-you-know-youre-trouble
This gentleman aptly illustrates that just because you are a professor at Harvard does not imply native intelligence. His last name would lend itself well to a pejorative that easily comes to mind if you get my drift.
What he is suggesting is such amazing lunacy it is hard to imagine someone in his position suggesting it with a straight face. I guess he has forgotten that our monetary system is fractional in nature. It would be interesting to watch the complete collapse of the banking system as everybody and his grandmother rush to withdraw every last penny in the broken banks. Then again maybe he is assuming that Americans are so docile and stupid that they will acquiesce to to having banks charge them to deposit their hard-earned money, then when they do the logical thing and remove said money from such outright theft, they would then go along with having their cash outlawed. There is a reason why Europe exempted retail depositors from negative rates so far. Jerk….er..I mean Rogoff may not be as dumb as he sounds. Perhaps he understands there is no way Americans would stand still for the insanity of negative rates unless cash was actually outlawed…
That is starting to change and will change for all the longer this goes on…
Bank Of Ireland And RBS To Charge Negative Interest Rates To Depositors
http://www.forbes.com/sites/timworstall/2016/08/20/bank-of-ireland-and-rbs-to-charge-negative-interest-rates-to-depositors-remember-mf-global/#373921857a1f
More on this CASH thing…
Negative Rates & The War On Cash, Part 1: “There Is Nowhere To Go But Down”
http://www.zerohedge.com/news/2016-09-04/negative-rates-war-cash-part-1-there-nowhere-go-down
Negative Rates & The War On Cash, Part 2: “Closing The Escape Routes”
http://www.zerohedge.com/news/2016-09-07/negative-rates-war-cash-part-2-closing-escape-routes
I agree Joe, it’s an alarming idea for people in positions of power to be expressing.
If there is no cash then the other consequence is we cannot avoid the government knowing exactly where we are and what we are doing. All transactions would have to be digital, we could not avoid every transaction being captured in our meta data.
I have a really big problem with mass state surveillance. No cash would make it worse.
The masses will simply return to bartering, if they don’t wholesale revolt… 🙂
Vern,
They would make us believe that we are better without cash and somehow a cashless society will stop money laundering, limit illegal activities etc and therefore people will line up for cashless society. Just like how we lined up to give up our freedoms after 9-11.
The reasons they are offering for this idiotic notion is entirely disingenuous. They in no way believe that either the economy or individuals will be better off in a cash-less society. It is all about control, pure and simple.
Agree . However most people are more interested in Football, Basketball (both pro and college) etc., then real issues facing us. Hence easier to sway masses.
Leads to ZERO Privacy, Loss of Liberty & Freedom…
Plus complete control on everything you do… Additional Tax for unhealthy activities or what the Government Deems unhealthy activity.
The World populations to be Surfs!
Yet the Obama Administration gave IRAN $1.7 Billion Dollars in equivalent physical CASH for payoffs of Iranian politicians and terrorist activities.
Joseph watching too much Fox news. Everything cannot be Obama’s fault and Trump for sure if not a solution. But I will not engage in politics here. Simply my observation for few months and hence wanted to say my 2 lines.
FACT:
The Obama Administration gave IRAN $1.7 Billion Dollars in equivalent physical CASH without the knowledge and consent of Congress!
That is a pure undisputed FACT!
“They” want to take away access to physical Cash from populations… Yet Obama has no problem giving out $1.7 Billion Dollars in physical CASH to leaders of Iran!
How Ironic!!!!
If you think that Physical CASH is going to be used for the benefit of the citizens of Iran… I have a bridge in Brooklyn that I would like to sell you… cheap!
It will be coming to an exploding body near you!
F i r s t.