
Overall downwards movement was again expected.
Summary: Price may move a little higher tomorrow. There is divergence between price and VIX and the AD line suggests one or two days of upwards movement. Thereafter, some more downwards movement may be expected. Overall, some more downwards movement to end close to 2,147.58 next week is still expected. Thereafter, the upwards trend should resume for a short fifth wave.
Last monthly chart for the main wave count is here.
New updates to this analysis are in bold.
MAIN WAVE COUNT
WEEKLY CHART
Click chart to enlarge.
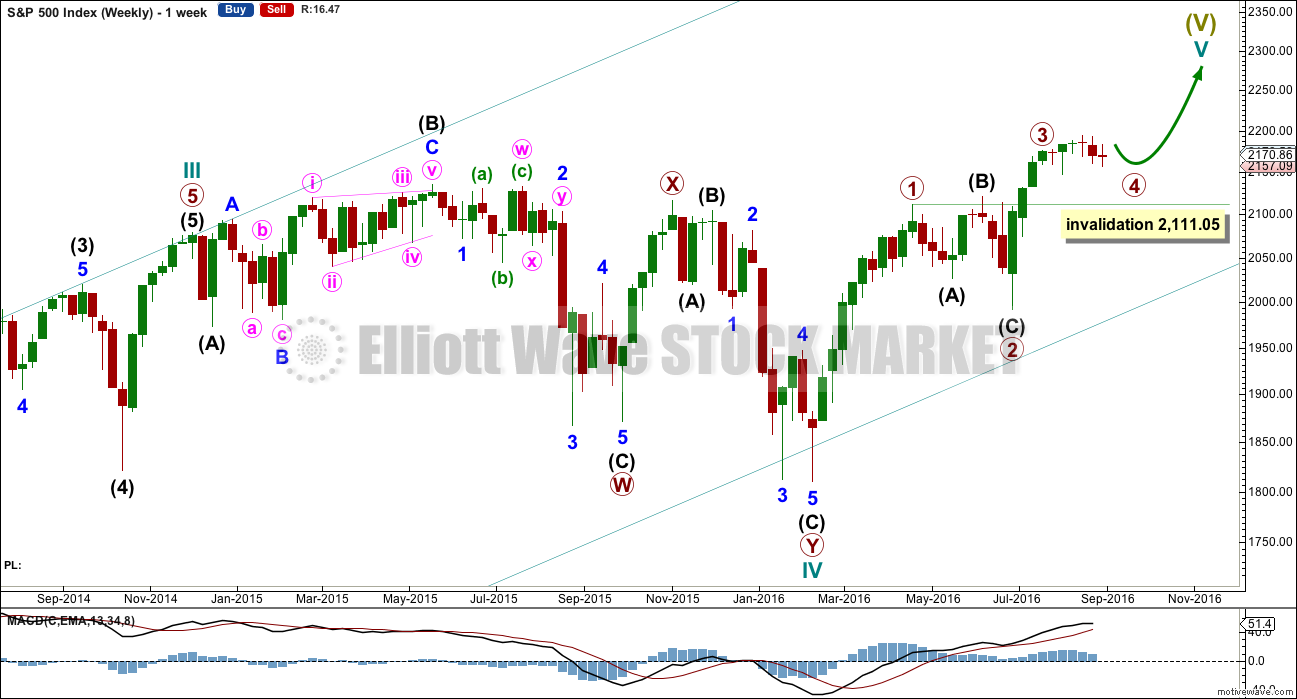
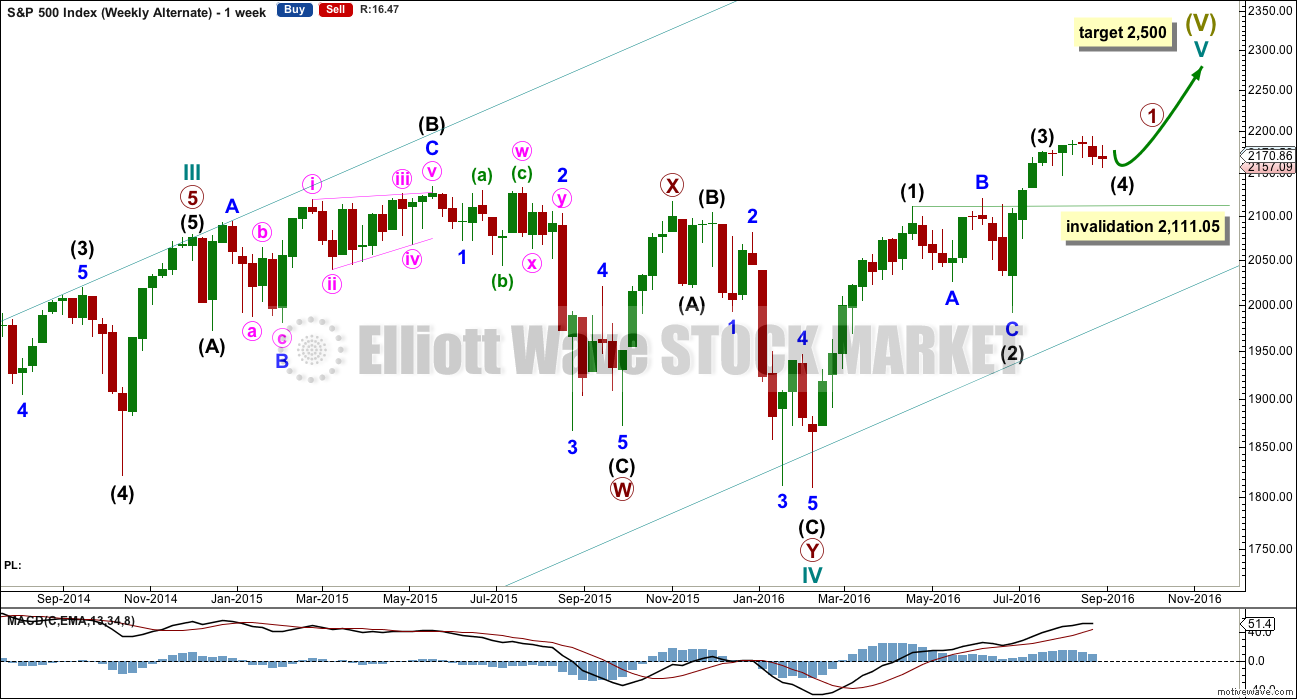
Cycle wave V must subdivide as a five wave structure. So far upwards movement is unfolding as an impulse with the fourth wave completing. This may be primary waves 1, 2, 3 and now 4, with primary wave 5 upwards still to come.
Primary wave 3 is shorter than primary wave 1, but shows stronger momentum and volume as a third wave normally does. Because primary wave 3 is shorter than primary wave 1 this will limit primary wave 5 to no longer than equality in length with primary wave 3, so that the core Elliott wave rule stating a third wave may not be the shortest is met. Primary wave 5 will be limited to no longer than 183.95 points in length.
Primary wave 2 was a shallow 0.40 expanded flat correction. Primary wave 4 may be exhibiting alternation as a more shallow double combination.
Primary wave 4 may not move into primary wave 1 price territory below 2,111.05.
DAILY CHART
Click chart to enlarge.
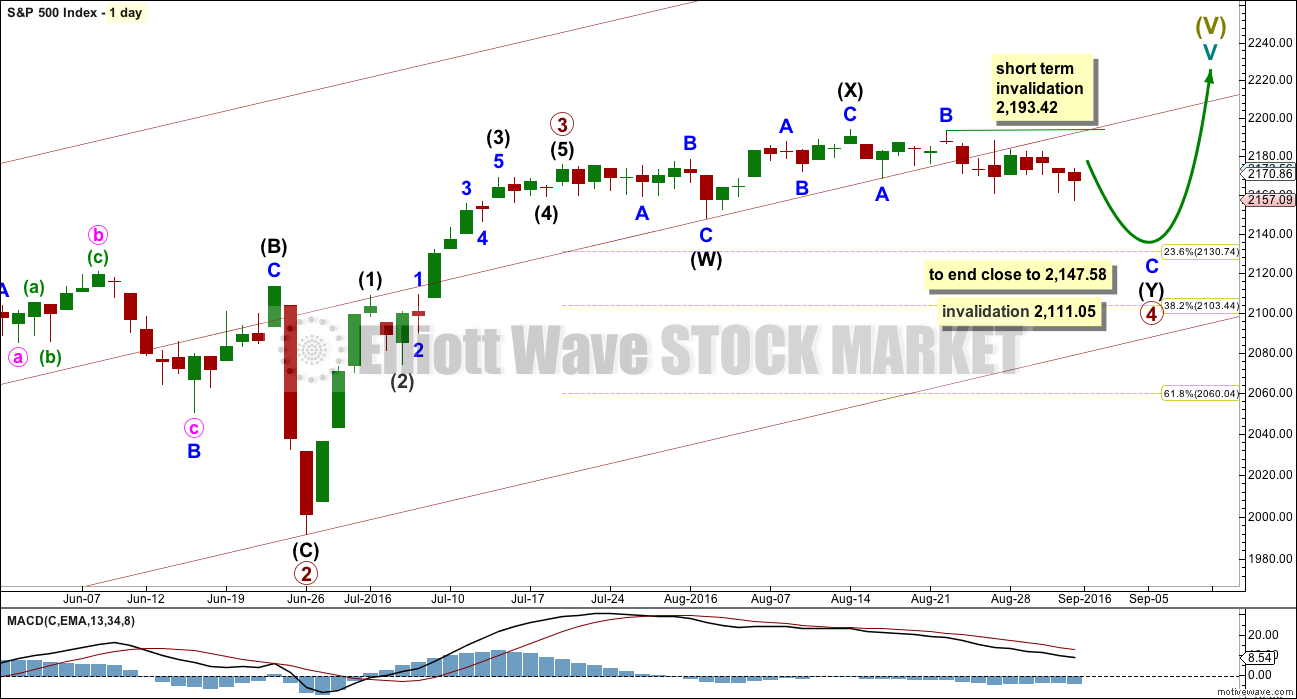
Primary wave 2 lasted 47 days (not a Fibonacci number). Primary wave 3 lasted 16 days (not a Fibonacci number). So far primary wave 4 has lasted 32 days. So far the proportion between primary waves 2 and 4 give this wave count the right look, especially if primary wave 4 continues further.
If primary wave 4 exhibits a Fibonacci number in days of duration, then the next Fibonacci number in the sequence is 34. It may end in another two days.
Within primary wave 4, the first structure in the double is an expanded flat labelled intermediate wave (W). The double is joined by a three in the opposite direction, a zigzag labelled intermediate wave (X). There is no limit to X waves within combinations, and they may make new price extremes beyond the start of the correction in the same way as B waves within flat corrections may.
The second structure in the double is unfolding as a zigzag labelled intermediate wave (Y). Double combinations have a purpose to take up time and move price sideways. To achieve this purpose the second structure in the double normally ends close to the same level as the first. Intermediate wave (Y) is likely to end close to 2,147.58.
While double combinations are relatively common, triples are very rare. When the second structure in the double is complete, then the probability that the whole correction is over would be very high.
In the short term, while the structure of minor wave C is incomplete, no second wave correction within it may move beyond the start of its first wave above 2,193.42.
When primary wave 4 is complete, then a target may be calculated for primary wave 5 to end. That cannot be done yet.
Primary wave 3 is shorter than primary wave 1 for this wave count. Because a core Elliott wave rule states a third wave may not be the shortest, this will limit primary wave 5 to no longer than equality in length with primary wave 3 at 183.95 points so that the rule is met.
HOURLY CHART
Click chart to enlarge.
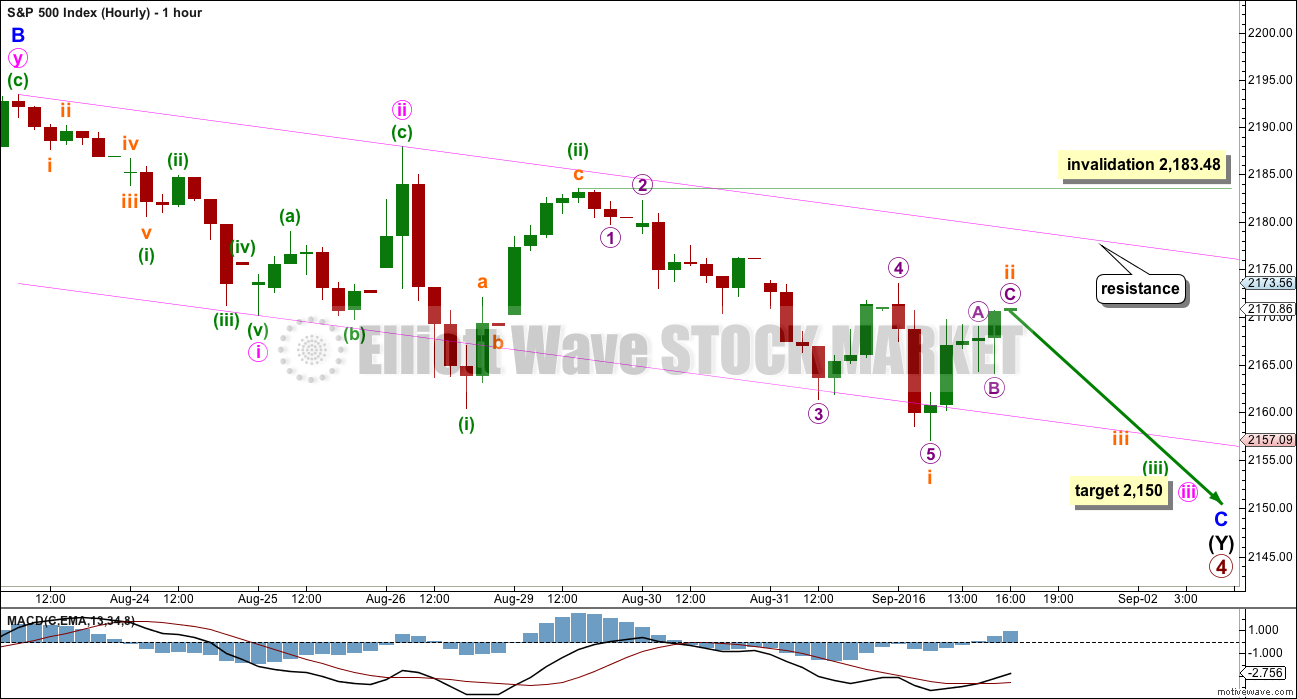
Minor wave C must subdivide as a five wave structure, either an impulse or an ending diagonal. An impulse is more common, so this is the main hourly wave count. A diagonal is less common, so this is covered in an alternate hourly wave count below.
At 2,150 minute wave iii would reach 1.618 the length of minute wave i.
Minute wave iii must subdivide as an impulse. Within minute wave iii, minuette wave (ii) should now be complete.
Subminuette wave ii may not move beyond the start of subminuette wave i above 2,183.48.
Minuette wave (iii) should have the power to break below support at the lower edge of the channel. Once it has done that, then the lower edge may provide resistance. The fact that it has not been able to do this so far is reducing the probability of this main wave count. The alternate hourly wave count at this stage is starting to have more of the right look.
There may now be a series of three overlapping first and second waves. This main hourly wave count expects to see an increase in volatility and an increase in downwards momentum tomorrow.
ALTERNATE HOURLY CHART
Click chart to enlarge.
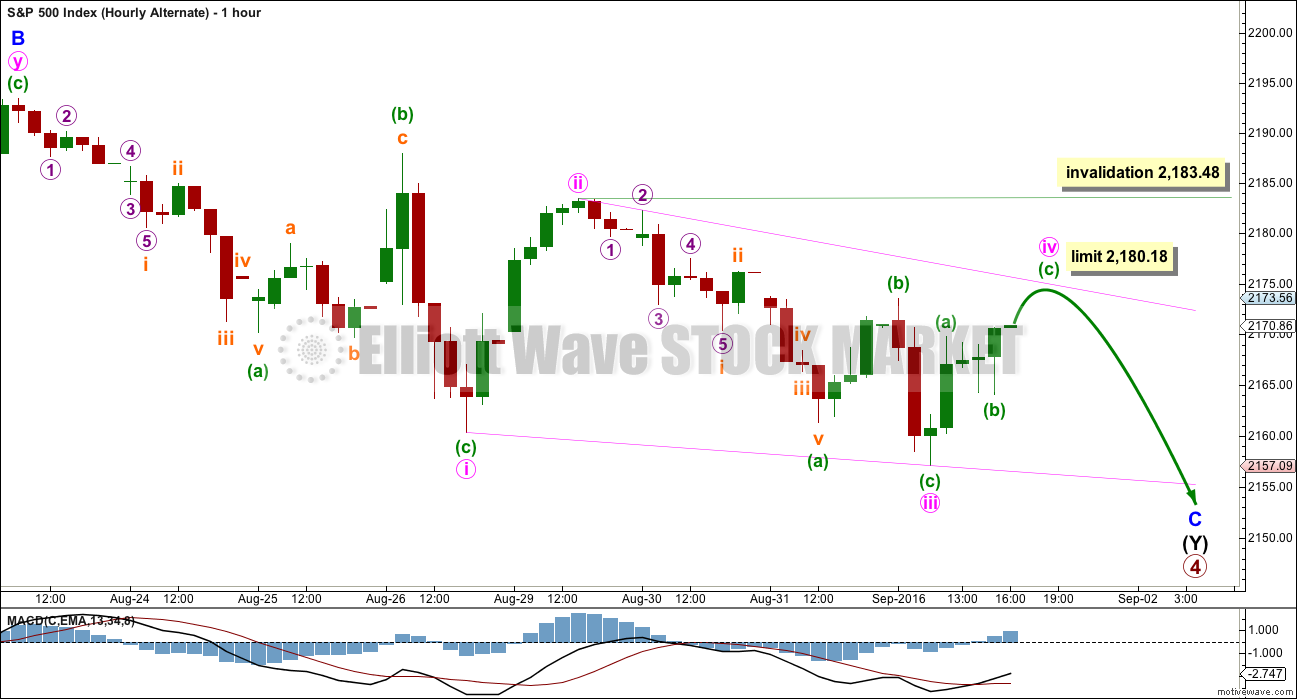
The other less likely structure for minor wave C would be an ending diagonal. Ending diagonals require all sub-waves to subdivide as zigzags.
Second and fourth waves within diagonals are normally very deep. The normal range is from 0.66 to 0.81 the prior wave. Minute wave ii is within normal range at 0.70 the depth of minute wave i. Minute wave iv may be over, but if so it would be more shallow than normal at only 0.52 the depth of minute wave iii. For this reason it is reasonable to expect minute wave iv to move higher to begin tomorrows session, and it is likely to reach into normal range at 2,174.51 to 2,178.47.
The diagonal looks to be contracting, which is the most common type. Minute wave iii is shorter than minute wave i. Minute wave iv may not be longer than equality in length with minute wave ii at 2,180.18 so that the rule regarding wave lengths for a contracting diagonal are met.
Minute wave iv may not move beyond the end of minute wave ii above 2,183.48.
The final wave down for minute wave v would have a limit for a contracting diagonal. It may not be longer than equality in length with minute wave iii, which is 26.39 points. When minute wave v slightly overshoots the i-iii trend line, then the diagonal should be expected to be over. This is the most common look for a fifth wave of a contracting diagonal, and the overshoot is usually small.
If this alternate unfolds as expected, then the structure for this diagonal may complete in two more sessions and thereafter an upwards trend should resume.
ALTERNATE WAVE COUNT
WEEKLY CHART
Click chart to enlarge.
This alternate is identical to the main wave count with the exception of the degree of labelling within cycle wave V.
Here the degree of labelling is moved down one degree. It is possible that only primary wave 1 is completing as a five wave impulse. When it is complete, then primary wave 2 would be expected to be a deep pullback which may not move beyond the start of primary wave 1. At that stage, the invalidation point would move down to the start of cycle wave V at 1,810.10. At that stage, a new low below this point would confirm a bear market for both Elliott wave and Dow Theory.
At 2,500 cycle wave V would reach equality in length with cycle wave I. This is the most common ratio for a fifth wave, so this target has a good probability.
At this stage, this alternate wave count differs only in the degree of labelling to the main wave count, so subdivisions for daily and hourly charts would be labelled the same.
TECHNICAL ANALYSIS
WEEKLY CHART
Click chart to enlarge. Chart courtesy of StockCharts.com.
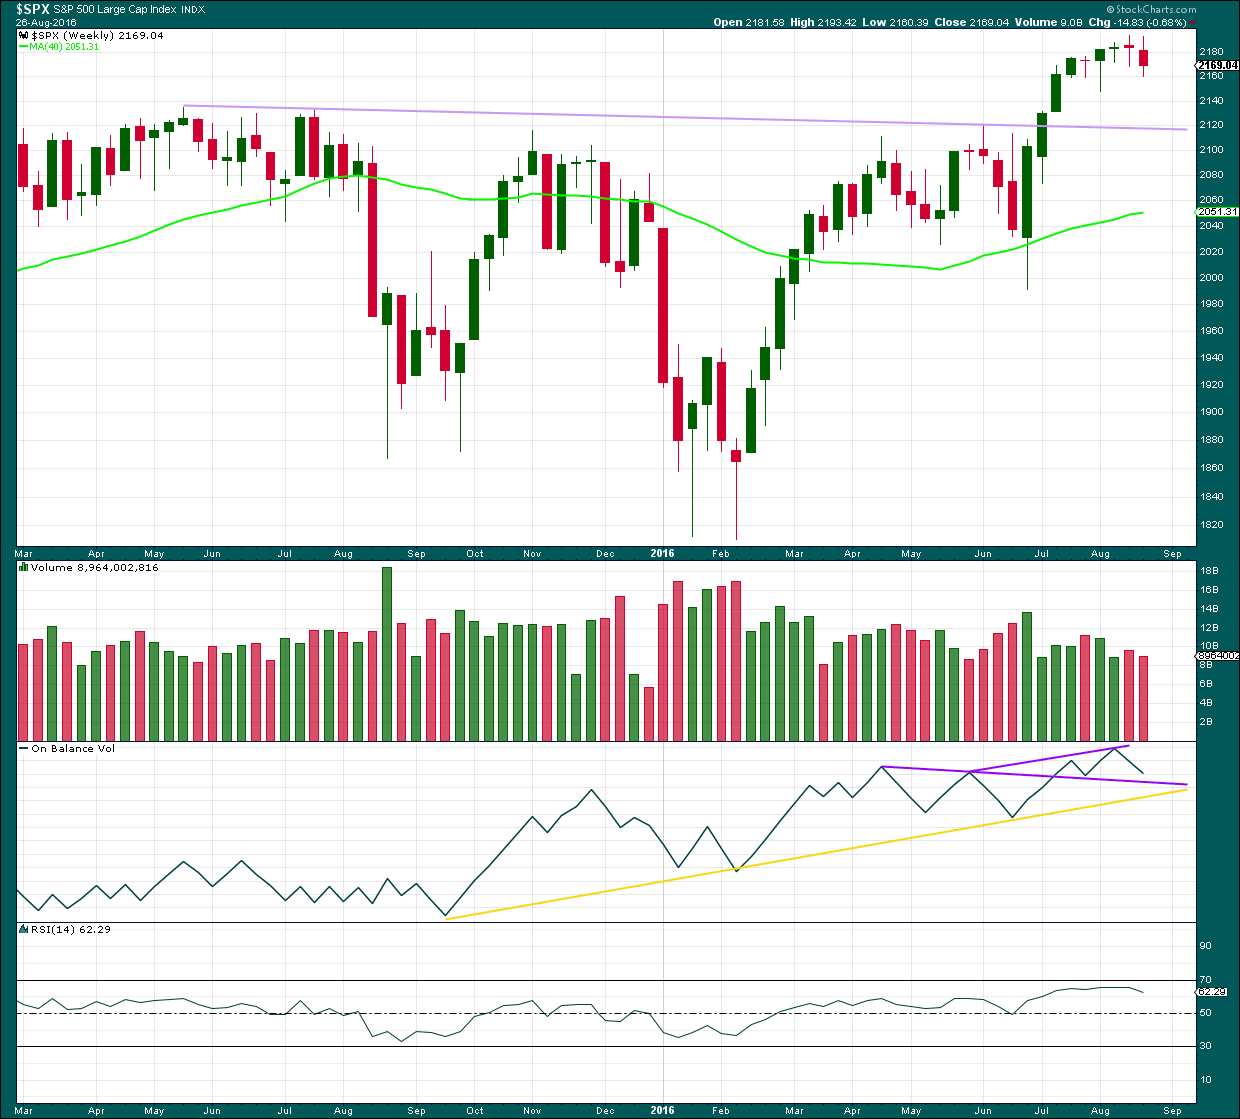
Last week completes a red weekly candlestick with lighter volume than the prior week. The fall in price was not supported by volume at the weekly chart level.
The last four candlesticks complete an Evening Doji Star candlestick pattern. After a clear upwards trend, this is a reversal pattern and indicates a reversal from up to either down or sideways, and makes no comment on how far price may move lower. The last candlestick in the pattern does not have support from volume weakening the reversal implications of the pattern.
This weekly candlestick also completes a Bearish Engulfing pattern with the candlestick three weeks before. The low of this week is well below the open of the week three weeks ago. Again, the pattern is not supported by volume which weakens the reversal implications.
On Balance Volume is coming lower to close in on the purple support line. This support may halt the fall in price.
RSI is not extreme. There is room for price to rise or fall.
DAILY CHART
Click chart to enlarge. Chart courtesy of StockCharts.com.
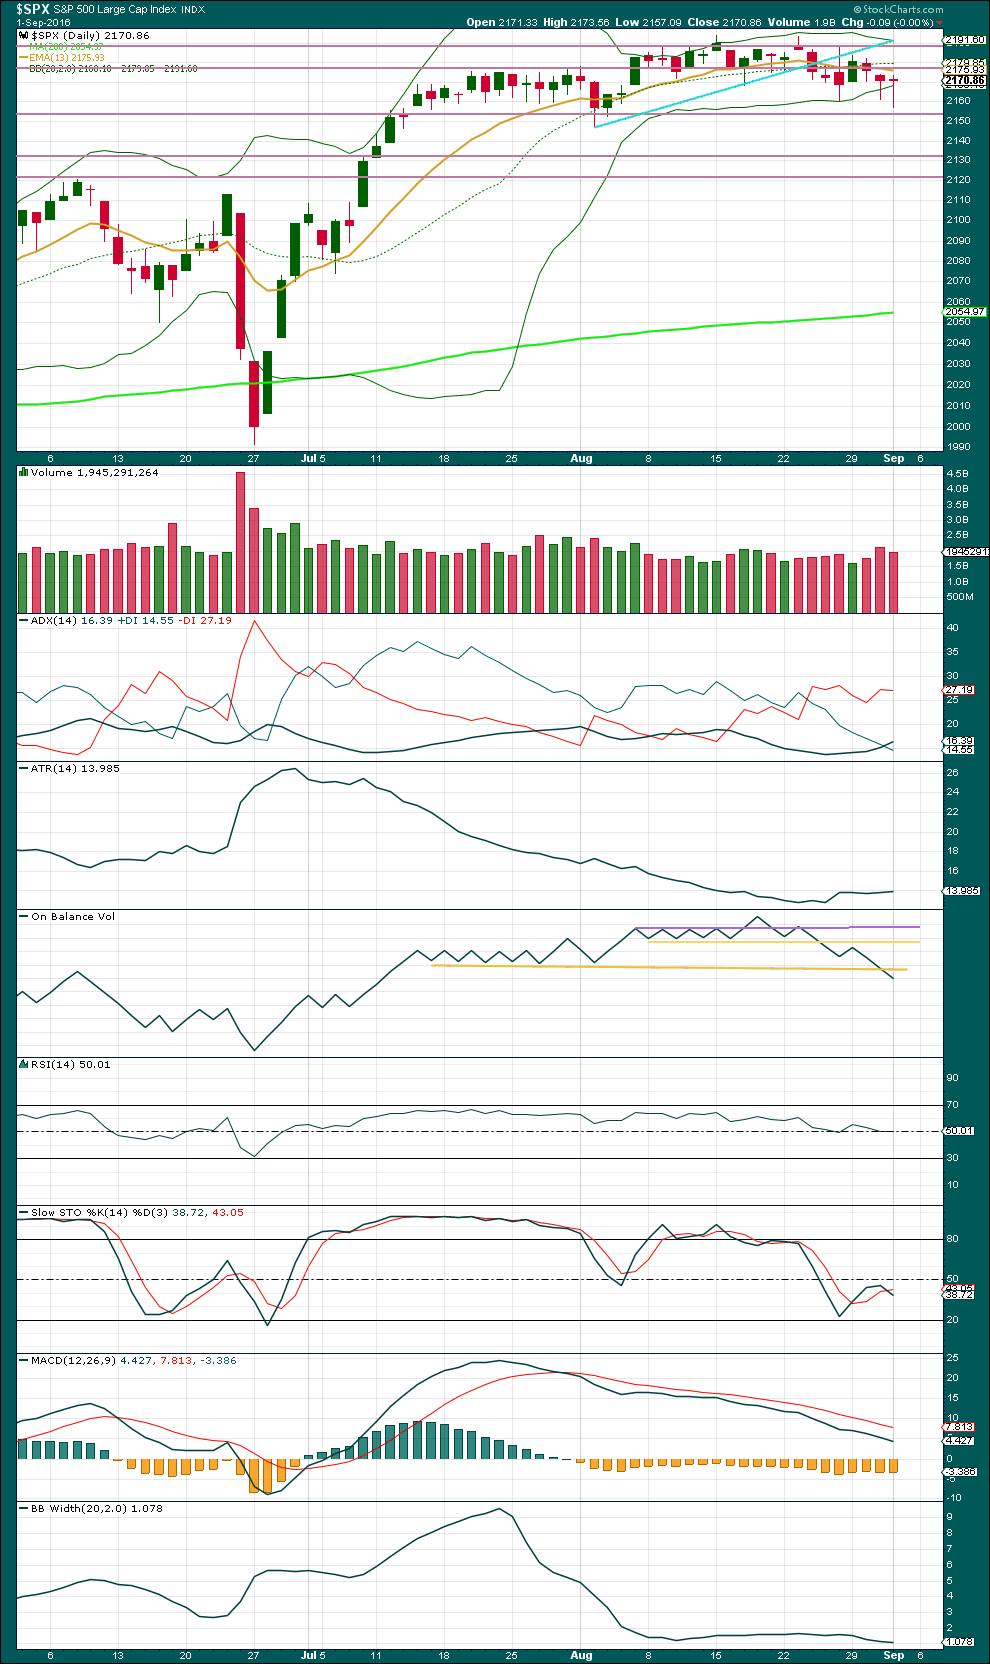
Today’s red candlestick is a doji with a very long lower wick, almost a Dragonfly doji. The lower wick is bullish. The small decline in volume is also slightly bullish. Price is close to support about 2,155. This classic analysis expects that the target of about 2,147 may not be able to be met for the Elliott wave count.
ADX is today finally indicating a downwards trend is in the early stages; it is increasing and above 15. ATR still disagrees though; it is still flat to declining. The very small increase in ATR is too small and short lived to indicate a new trend. Bollinger Bands remain tightly contracted. It does not look like a downwards trend is beginning here.
On Balance Volume is giving a strong bearish signal today with a break below the yellow line. This supports the Elliott wave count. This is a bearish signal, but it makes no comment on how far price may move.
RSI is neutral. There is plenty of room for price to rise or fall. There is no reasonable divergence between price and RSI to indicate weakness at this stage.
There is some small divergence between price and Stochastics, but this is often unreliable and particularly so of late. It is given little to no weight for this reason. Stochastics is not yet oversold. There is still a little room for price to fall a little further.
VOLATILITY – INVERTED VIX CHART
Click chart to enlarge. Chart courtesy of StockCharts.com.
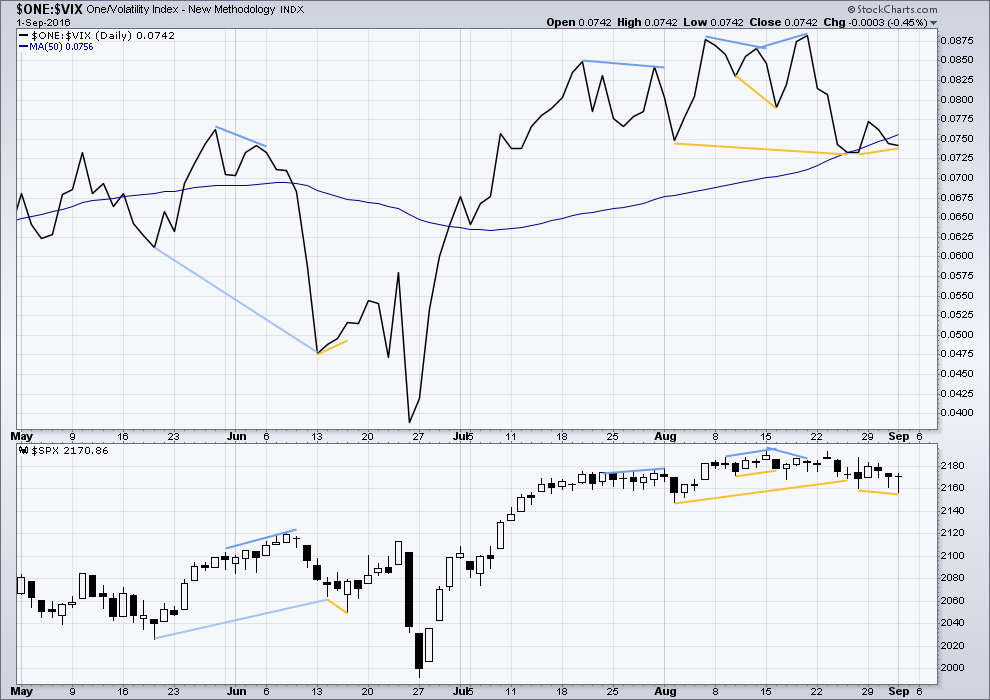
Volatility is declining as price is rising. This is normal for an upwards trend.
There are a few instances of multi day divergence between price and inverted VIX noted here. Bearish divergence is blue. Bullish divergence is yellow. Each of these instances was followed by expected price movement if only for two days. Divergence with VIX and price is not always working, but it is still sometimes working. So it will be noted.
It appears so far that divergence between inverted VIX and price is again working to indicate short term movements spanning one or two days.
The bullish divergence from VIX indicated by the longer yellow lines may now be resolved by a day of upwards movement. Lately, this divergence has been followed by only one or two days of price movement in the expected direction.
There is today a small and slight regular bullish divergence between price and VIX: price has made a lower low slightly below the prior low of 26th of August yet VIX has made a higher low. This indicates short term one or two days of upwards movement.
BREADTH – AD LINE
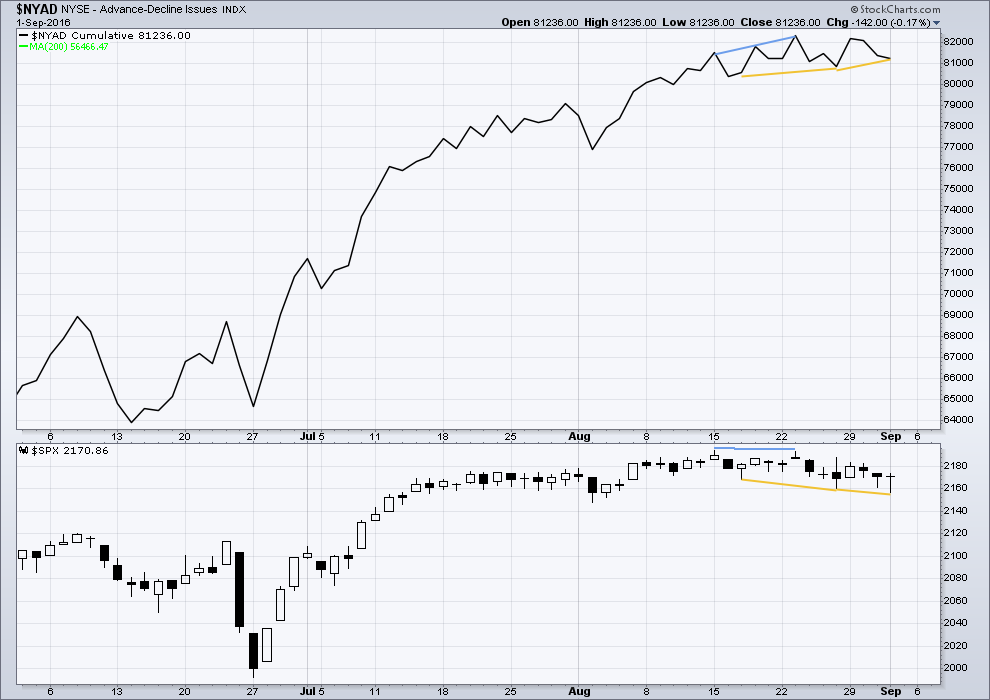
Click chart to enlarge. Chart courtesy of StockCharts.com.
There is support from market breadth as price is rising.
Short term bullish and bearish divergence is again working between price and the AD line to show the direction for the following one or two days.
Short term regular bullish divergence is noted between price and the AD line today: price has made a slightly lower low today, below the prior low of 26th of August, but the AD line has made a higher low. This indicates one or two days of upwards movement ahead.
DOW THEORY
Major lows within the prior bull market:
DJIA: 15,855.12 (15th October, 2014) – closed below on 25th August, 2015.
DJT: 7,700.49 (12th October, 2014) – closed below on 24th August, 2015.
S&P500: 1,821.61 (15th October, 2014) – has not closed below this point yet.
Nasdaq: 4,117.84 (15th October, 2014) – has not closed below this point yet.
Major highs within the new bear market:
DJIA: 17,977.85 (4th November, 2015) – closed above on 18th April, 2016.
DJT: 8,358.20 (20th November, 2015) – has not closed above this point yet.
S&P500: 2,116.48 (3rd November, 2015) – closed above this point on 8th June, 2016.
Nasdaq: 5,176.77 (2nd December, 2015) – closed above this point on 1st August, 2016.
Dow Theory Conclusion: Original Dow Theory still sees price in a bear market because the transportations have failed to confirm an end to that bear market. Modified Dow Theory (adding S&P and Nasdaq) has failed still to confirm an end to the old bull market, modified Dow Theory sees price still in a bull market.
This analysis is published @ 8:57 p.m. EST.
Have a good weekend everyone !!!
Lara,
Maybe I am overthinking this, but with both wave counts invalidated short-term today, perhaps there is something different going on here. Either a more complex combination for Primary Wave 4 (could we have just seen the end of a three wave structure down for W with an X and Y still to follow), or is it possible that what you have labeled as Black X of Primary 4 was actually the end of Primary 3, with Primary 4 to extend further from that starting point?
Thanks,
Peter
I don’t think you can overthink EW.
That was my first impression too when I opened charts this morning.
I’m wondering if primary 4 is a triangle. It may fit… I need to check the subdivisions.
I’m going to take time to consider the suggestions you raise, and to look also at the triangle.
This upwards wave may also be a second wave within an ending diagonal. I could have labelled the diagonal prematurely almost complete…
Price action following the jobs report will probably conform to the usual script- a manic spike in one direction which is immediately reversed. I have had fun trading those the last few times and will be looking for one more opportunity tomorrow. The algos are nothing if not predictable… 🙂
What is happening in France is a remarkable illustration of the immutable law of sowing and reaping. Clinton and Sarkosy are directly responsible for the rivers of blood that flowed in Libya. Sarkosy viewed the challenge from Ghaddafi to French hegemony in Africa as a justifiable reason for destroying the country. Clinton joined because of personal avarice. The truth of what happened in Libya is the most under-reported story of the last decade and another example of how completely useless and decadent Western media has become. France will continue to pay a price for their evil conduct; so eventually, will the U.S. The country’s gold was indeed stolen by the West.
Time for another post because, well, I hate this market…this one is more for the gold bugs…
If you recall back to 2011 when Moumar Gaddafi was being ousted, there were some very interesting developments. I don’t know if WikiLeaks is very accurate or even a valid source, but they do have one of Hillary Clinton’s emails about the situation. This email indicates that Gaddafi was trying to create a gold-backed African currency that would rival the French currency. As some should know, he was trying to take steps in uniting the continent of Africa–might have been a good thing actually. I heard something of a gold-backed currency attempt, but I was unaware what the whole situation was. Anyway, the French decided to attack partly because of this.
And since then, Hillary is claiming that she killed Gaddafi. USA was not supposed to have been there, at least on the ground–that’s the lying politicians for us–who knows what really happened. Well, imagine if this were to have taken place. A gold-backed currency would alert the world that digital currencies may not be totally secure, just as bitcoin may be hackable. Perhaps that’s a bit extreme of a comparison, but were Gaddafi successful at that point in time, I believe that gold and silver would have shot higher by multiples.
Instead, no one backs their currency with gold, but I don’t think the idea is totally dead. If any country that has a means of defense with weapons of mass destruction, there is a genuine risk of them implementing a gold-backed currency. Who would want to own overvalued stocks–instead, own undervalued gold compared to the current money supply–I think I have found a way that money supply could be moved from M2 to M1…very scary.
Is there any talk of a gold-backed currency? Not that I know of, but no one really knows.
https://wikileaks.org/clinton-emails/emailid/12660
Interesting. As far as I have read, it seems that the gold amount Gaddafi has accumulated at that time was close to 150 tons… enough to back his “dinar-gold” currency….
I am not sure the decision of the attack was limited to french politicians. Wall Street, the London City and other hands have pulled the strings as well … intricated story .. but I do agree with you, is the idea over?
They are all complicit. Many of the NATO nations besides France and the US participated in the slaughter. Apart from Clinton’s personal greed, Libya’s plan to float a gold-back dinar to challenge the Petro-Dollar as well as all the other fiat currencies I supposed warranted mass murder in the minds of these individuals. It is a truly heart-breaking chapter in NATO military criminal history. I doubt it will ultimately yield the outcome they anticipated. Stuff happens!
“Time for another post because, well, I hate this market”
Me too Russell. Me too.
First I think
First you think, then you…. ?
First I think, then I am…? 🙂