
Overall downwards movement was expected.
Summary: Overall, this week and maybe also next week should continue with downwards movement to end about 2,147.58. Downwards movement may be choppy, overlapping, and take its time.
Last monthly chart for the main wave count is here.
New updates to this analysis are in bold.
MAIN WAVE COUNT
WEEKLY CHART
Click chart to enlarge.
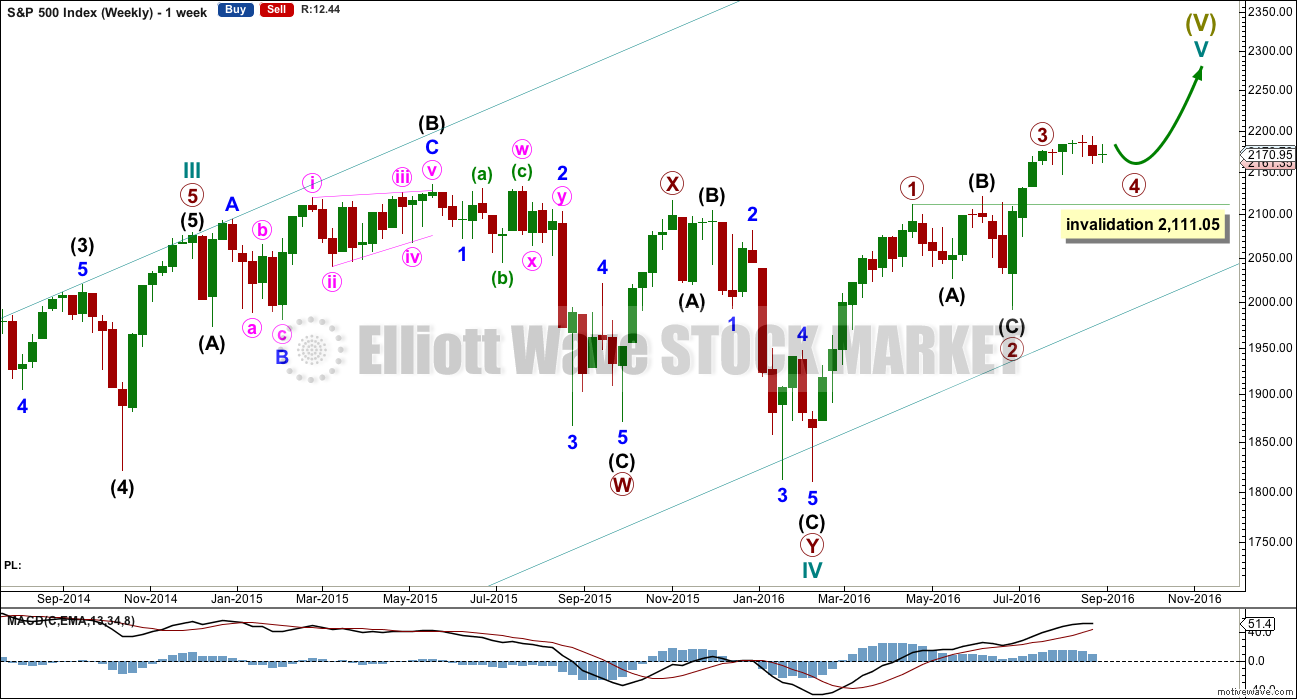
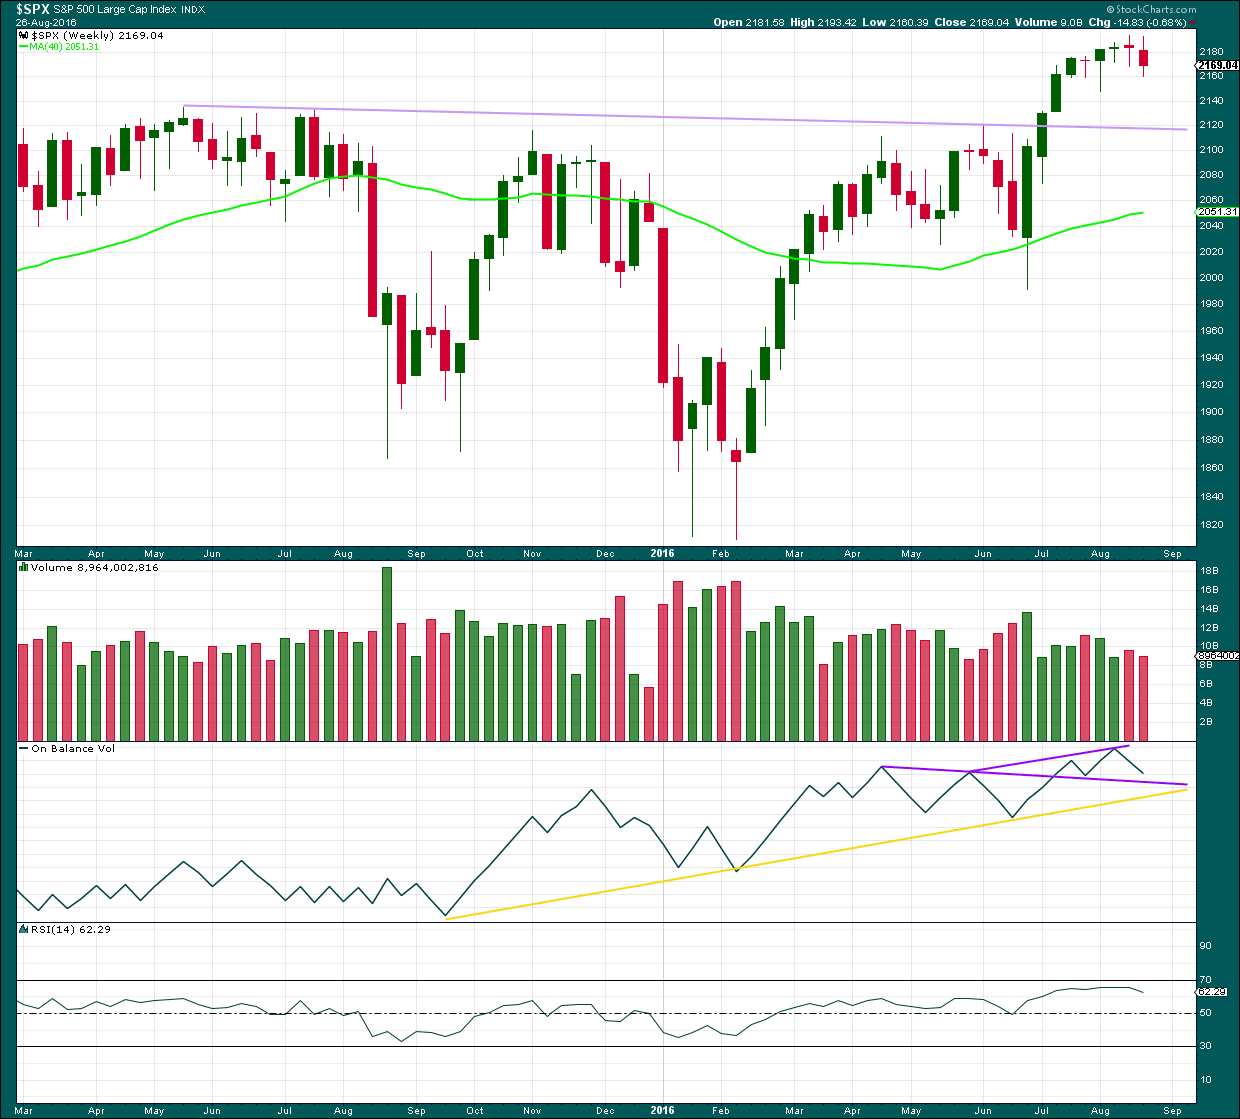
Cycle wave V must subdivide as a five wave structure. So far upwards movement is unfolding as an impulse with the fourth wave completing. This may be primary waves 1, 2, 3 and now 4, with primary wave 5 upwards still to come.
Primary wave 3 is shorter than primary wave 1, but shows stronger momentum and volume as a third wave normally does. Because primary wave 3 is shorter than primary wave 1 this will limit primary wave 5 to no longer than equality in length with primary wave 3, so that the core Elliott wave rule stating a third wave may not be the shortest is met. Primary wave 5 will be limited to no longer than 183.95 points in length.
Primary wave 2 was a shallow 0.40 expanded flat correction. Primary wave 4 may be exhibiting alternation as a more shallow double combination.
Primary wave 4 may not move into primary wave 1 price territory below 2,111.05.
DAILY CHART
Click chart to enlarge.
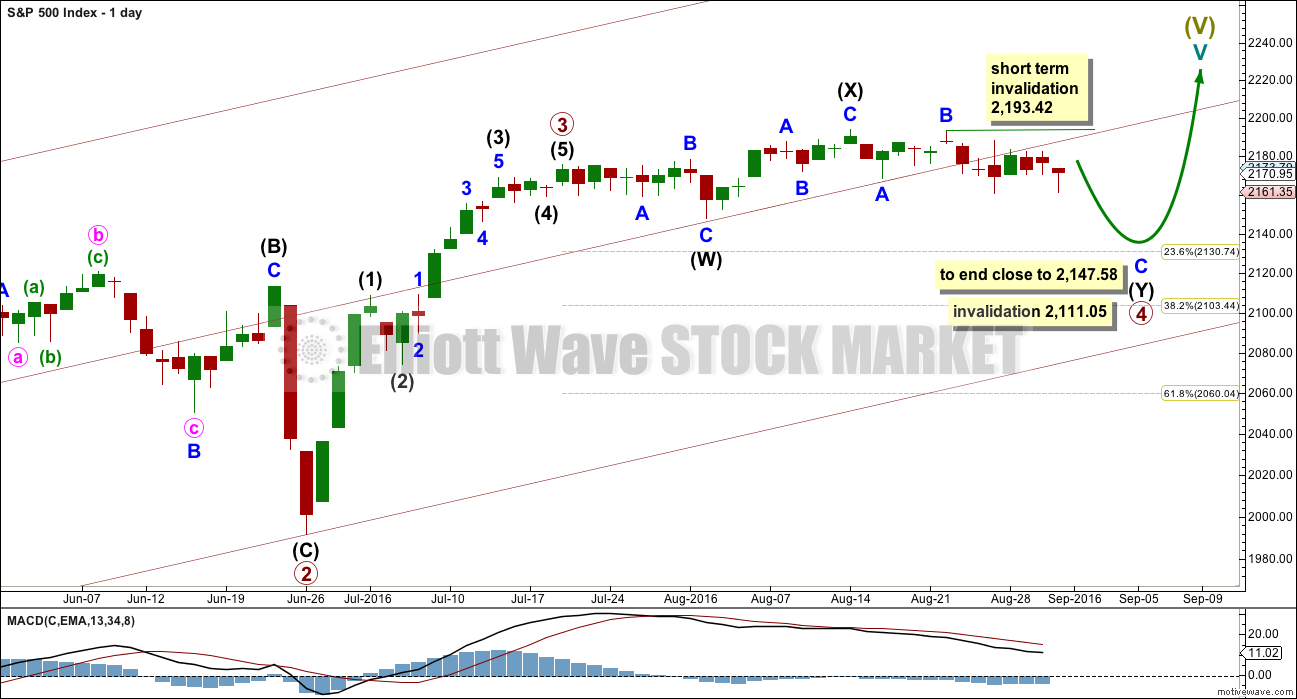
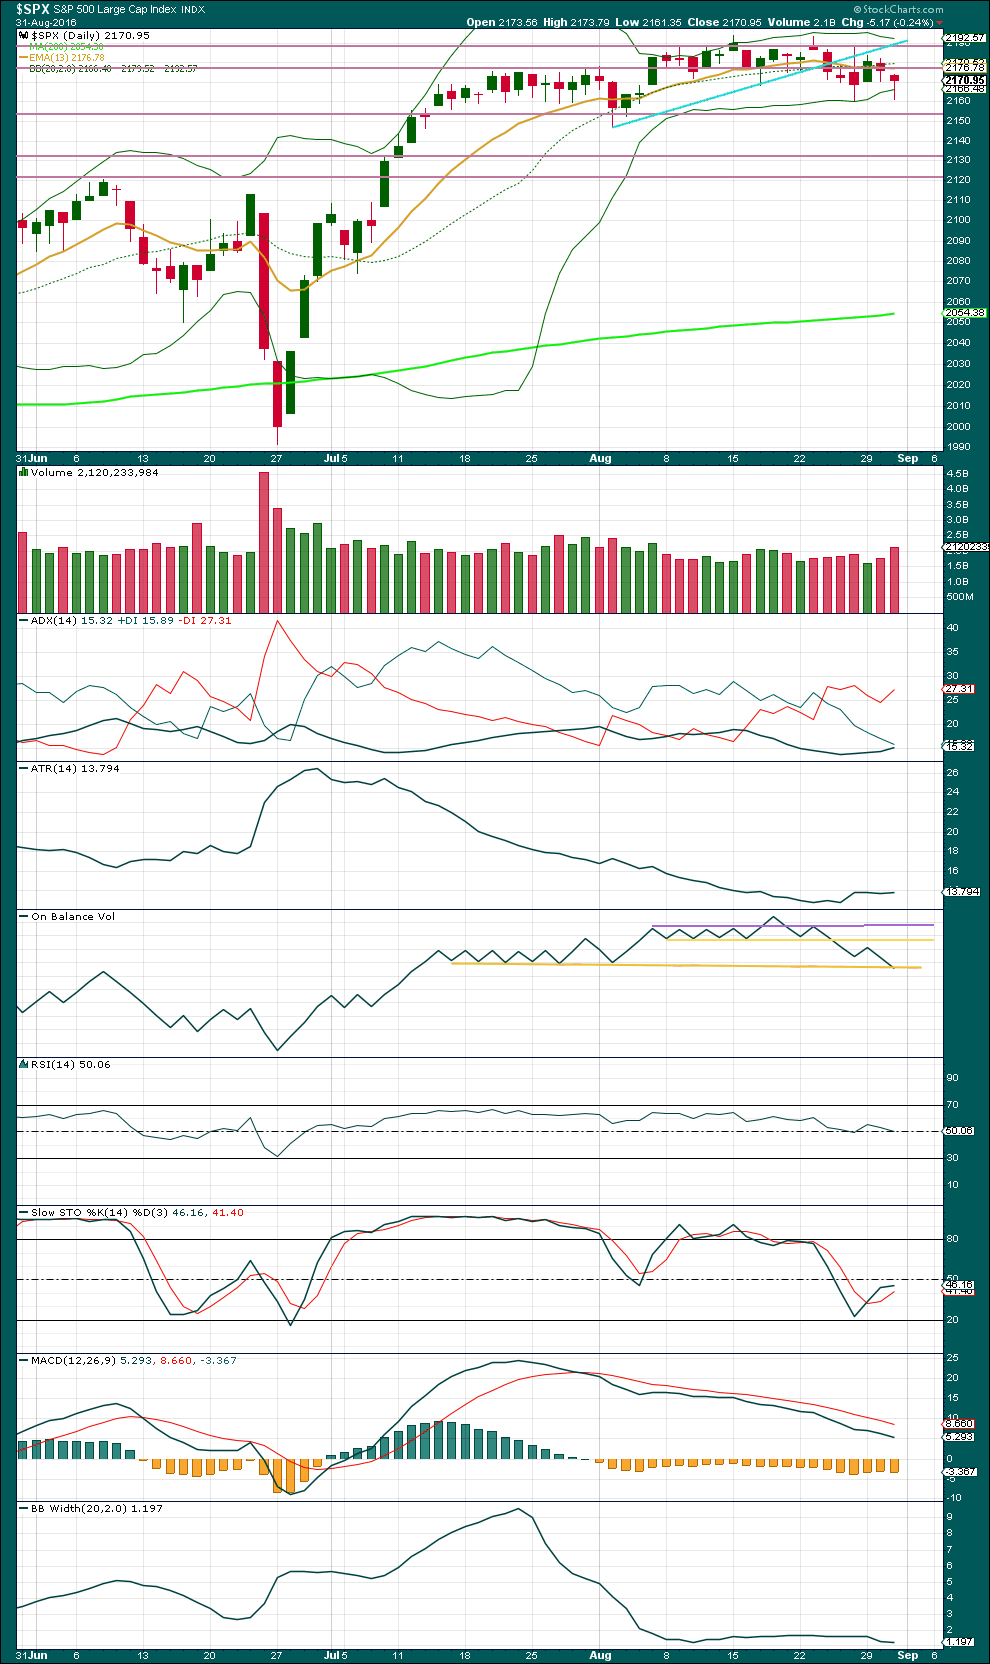
Primary wave 2 lasted 47 days (not a Fibonacci number). Primary wave 3 lasted 16 days (not a Fibonacci number). So far primary wave 4 has lasted 30 days. So far the proportion between primary waves 2 and 4 give this wave count the right look, especially if primary wave 4 continues further.
If primary wave 4 exhibits a Fibonacci number in days of duration, then the next Fibonacci number in the sequence is 34. It may end in another six days.
Within primary wave 4, the first structure in the double is an expanded flat labelled intermediate wave (W). The double is joined by a three in the opposite direction, a zigzag labelled intermediate wave (X). There is no limit to X waves within combinations, and they may make new price extremes beyond the start of the correction in the same way as B waves within flat corrections may.
The second structure in the double is unfolding as a zigzag labelled intermediate wave (Y). Double combinations have a purpose to take up time and move price sideways. To achieve this purpose the second structure in the double normally ends close to the same level as the first. Intermediate wave (Y) is likely to end close to 2,147.58.
While double combinations are relatively common, triples are very rare. When the second structure in the double is complete, then the probability that the whole correction is over would be very high.
In the short term, while the structure of minor wave C is incomplete, no second wave correction within it may move beyond the start of its first wave above 2,193.42.
When primary wave 4 is complete, then a target may be calculated for primary wave 5 to end. That cannot be done yet.
HOURLY CHART
Click chart to enlarge.
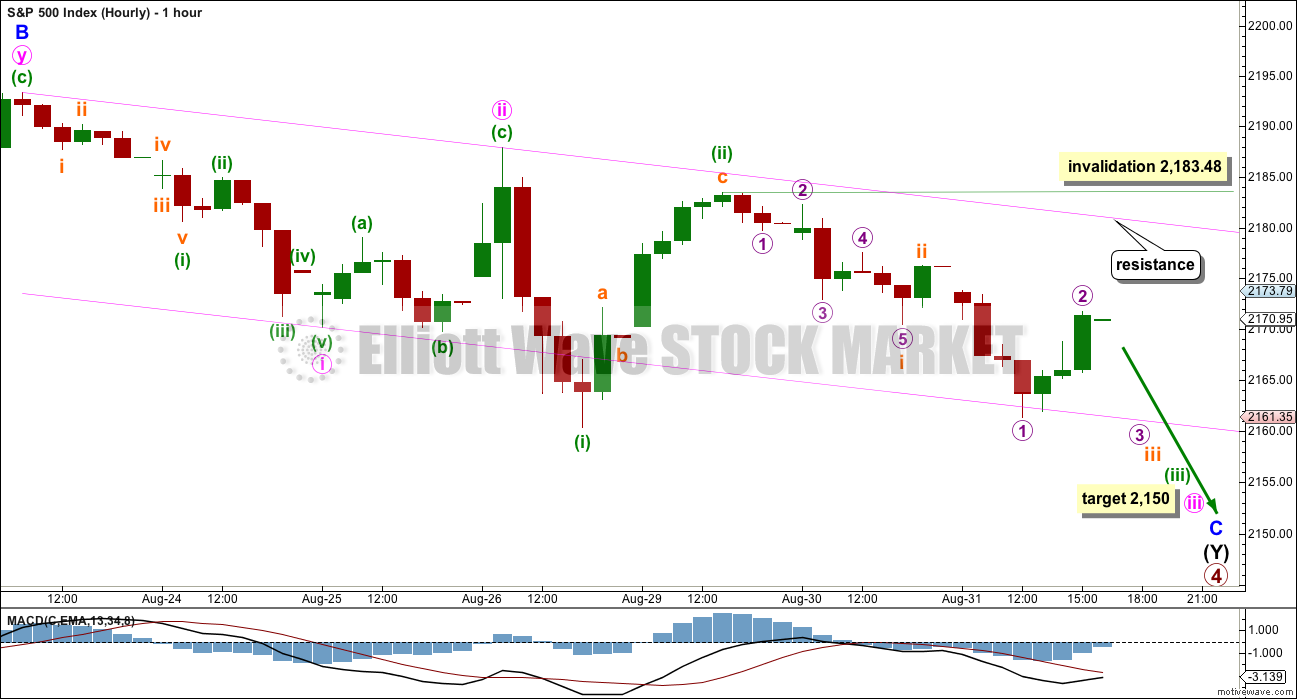
Minor wave C must subdivide as a five wave structure, either an impulse or an ending diagonal. An impulse is more common, so this is the main hourly wave count. A diagonal is less common, so this is covered in an alternate hourly wave count below.
At 2,150 minute wave iii would reach 1.618 the length of minute wave i.
Minute wave iii must subdivide as an impulse. Within minute wave iii, minuette wave (ii) should now be complete.
Within minuette wave (iii), subminuette waves i and ii may be complete as labelled, or submineutte wave i may not be complete yet. If another deep second wave correction is yet to come, then subminuette wave ii may not move beyond the start of subminuette wave i above 2,183.48.
Minuette wave (iii) should have the power to break below support at the lower edge of the channel. Once it has done that, then the lower edge may provide resistance.
There may now be a series of four overlapping first and second waves. This main hourly wave count expects to see an increase in volatility and an increase in downwards momentum tomorrow.
Minuette wave (ii) is showing on the daily chart as a green candlestick. Minute wave ii one degree higher does not show with any green candlesticks. The alternate wave count below may explain why, and it may have a better look at the daily chart level at this stage.
ALTERNATE HOURLY CHART

Click chart to enlarge.
The other less likely structure for minor wave C would be an ending diagonal. Ending diagonals require all sub-waves to subdivide as zigzags.
Second and fourth waves within diagonals are normally very deep. The normal range is from 0.66 to 0.81 the prior wave, which gives a range for minute wave ii to end from 2,182 to 2,187.
Minute wave ii should be an obvious three wave structure. So far within it minuette wave (a) looks best as a five. Minuette wave (b) downwards is now complete and looks like a zigzag on the hourly chart. Minuette wave (c) would reach equality in length with minuette wave (a) at 2,184, which is within the normal range.
Minute wave ii may not move beyond the start of minute wave i above 2,193.42.
When minute wave ii is a complete three wave zigzag, then minute wave iii downwards must also subdivide as a zigzag and must move price below the end of minute wave i at 2,160.39.
ALTERNATE WAVE COUNT
WEEKLY CHART
Click chart to enlarge.
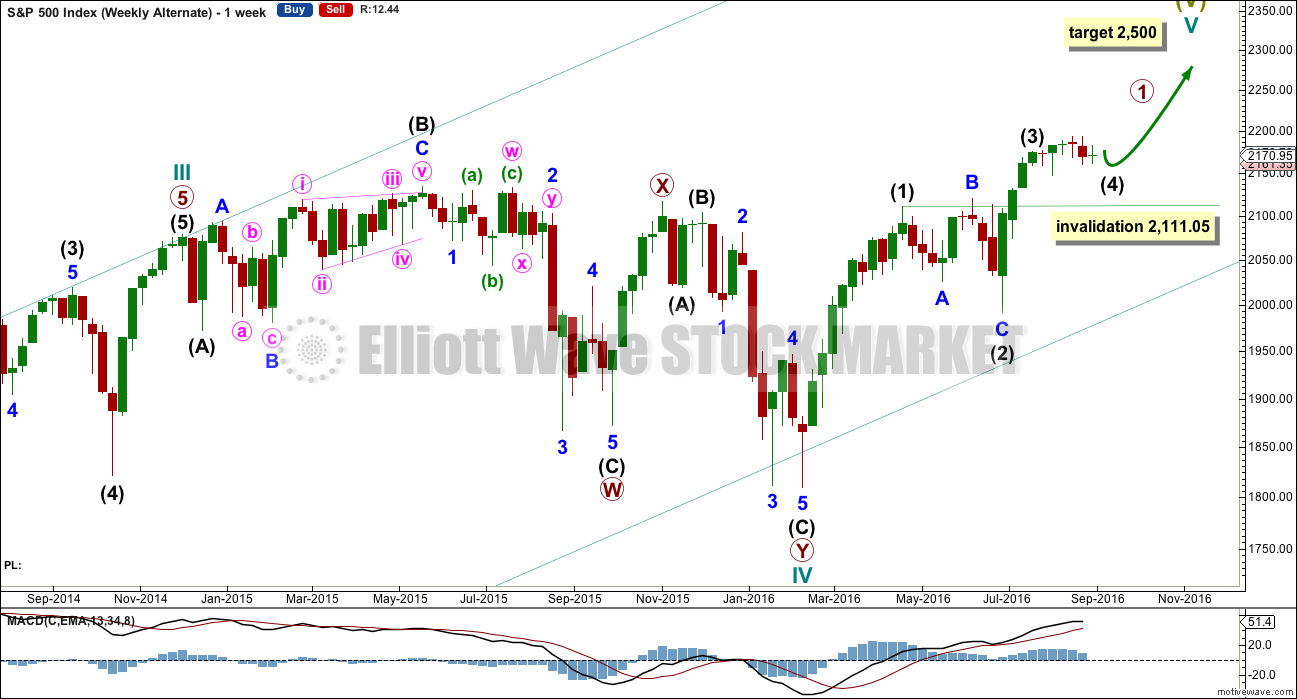
This alternate is identical to the main wave count with the exception of the degree of labelling within cycle wave V.
Here the degree of labelling is moved down one degree. It is possible that only primary wave 1 is completing as a five wave impulse. When it is complete, then primary wave 2 would be expected to be a deep pullback which may not move beyond the start of primary wave 1. At that stage, the invalidation point would move down to the start of cycle wave V at 1,810.10. At that stage, a new low below this point would confirm a bear market for both Elliott wave and Dow Theory.
At 2,500 cycle wave V would reach equality in length with cycle wave I. This is the most common ratio for a fifth wave, so this target has a good probability.
At this stage, this alternate wave count differs only in the degree of labelling to the main wave count, so subdivisions for daily and hourly charts would be labelled the same.
TECHNICAL ANALYSIS
WEEKLY CHART
Click chart to enlarge. Chart courtesy of StockCharts.com.
Last week completes a red weekly candlestick with lighter volume than the prior week. The fall in price was not supported by volume at the weekly chart level.
The last four candlesticks complete an Evening Doji Star candlestick pattern. After a clear upwards trend, this is a reversal pattern and indicates a reversal from up to either down or sideways, and makes no comment on how far price may move lower. The last candlestick in the pattern does not have support from volume weakening the reversal implications of the pattern.
This weekly candlestick also completes a Bearish Engulfing pattern with the candlestick three weeks before. The low of this week is well below the open of the week three weeks ago. Again, the pattern is not supported by volume which weakens the reversal implications.
On Balance Volume is coming lower to close in on the purple support line. This support may halt the fall in price.
RSI is not extreme. There is room for price to rise or fall.
DAILY CHART
Click chart to enlarge. Chart courtesy of StockCharts.com.
Two days in a row of downwards movement with increasing and relatively strong volume indicates more downwards movement is likely. This supports the Elliott wave count short term.
Of the last nine days, it is downwards days which have strongest volume.
Today’s red candlestick has a long lower wick, which is bullish, but the colour is red so overall the bears were dominant. This hammer cannot be read as a reversal pattern because there is nothing to reverse yet; the market is essentially range bound.
ADX indicates now there is a downwards trend in place and in the very early stages.
ATR is overall flat, so it does not yet agree with ADX. This downwards trend is either very weak or very young.
On Balance Volume today has come down to touch the lower yellow line. It may find support here. If it does, this may initiate a bounce up for price. There is some divergence between price and OBV: from the low for price on 2nd of August price has made a higher low but OBV has made a slightly lower low. This is hidden bullish divergence and indicates weakness in price.
RSI is neutral. There is plenty of room for price to rise or fall. There is divergence also between price and RSI from the lows of 2nd August to today: price has made a higher low but RSI has made a slightly lower low. This indicates weakness in price.
Stochastics is not extreme and also exhibits divergence with price.
Bollinger Bands remain very tightly contracted, and have been so for a very long time now. Volatility will return to this market eventually. When it does, the next move may be explosive.
VOLATILITY – INVERTED VIX CHART
Click chart to enlarge. Chart courtesy of StockCharts.com.
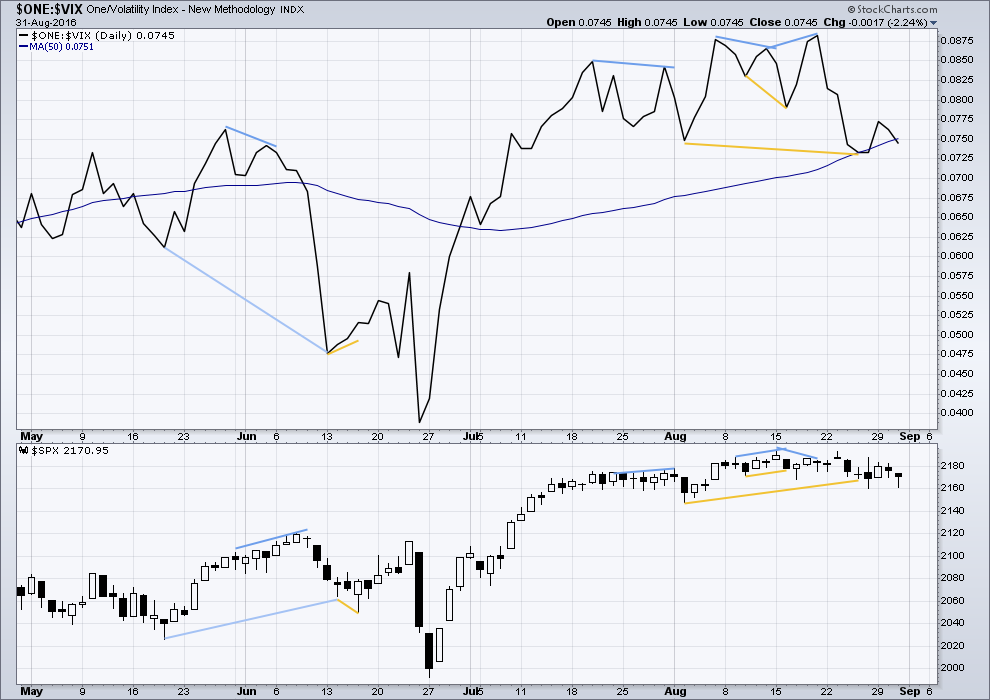
Volatility is declining as price is rising. This is normal for an upwards trend.
There are a few instances of multi day divergence between price and inverted VIX noted here. Bearish divergence is blue. Bullish divergence is yellow. Each of these instances was followed by expected price movement if only for two days. Divergence with VIX and price is not always working, but it is still sometimes working. So it will be noted.
It appears so far that divergence between inverted VIX and price is again working to indicate short term movements spanning one or two days.
The bullish divergence from VIX indicated by the longer yellow lines may now be resolved by a day of upwards movement. Lately, this divergence has been followed by only one or two days of price movement in the expected direction.
VIX today agrees with price; there is no divergence.
BREADTH – AD LINE
Click chart to enlarge. Chart courtesy of StockCharts.com.
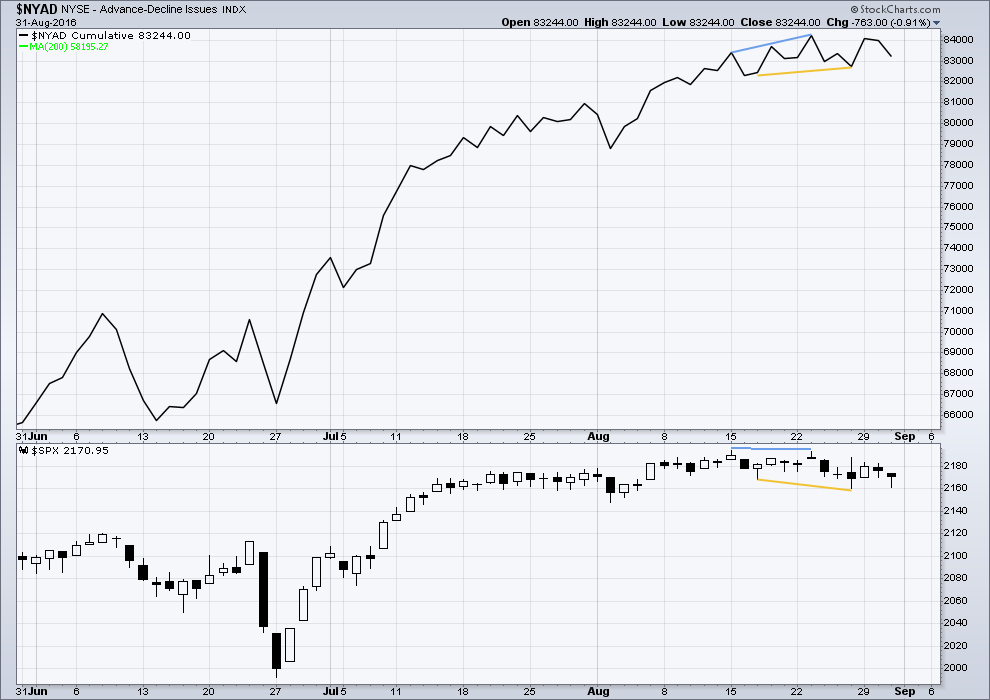
There is support from market breadth as price is rising.
Short term bullish and bearish divergence is again working between price and the AD line to show the direction for the following one or two days. No divergence is noted today.
DOW THEORY
Major lows within the prior bull market:
DJIA: 15,855.12 (15th October, 2014) – closed below on 25th August, 2015.
DJT: 7,700.49 (12th October, 2014) – closed below on 24th August, 2015.
S&P500: 1,821.61 (15th October, 2014) – has not closed below this point yet.
Nasdaq: 4,117.84 (15th October, 2014) – has not closed below this point yet.
Major highs within the new bear market:
DJIA: 17,977.85 (4th November, 2015) – closed above on 18th April, 2016.
DJT: 8,358.20 (20th November, 2015) – has not closed above this point yet.
S&P500: 2,116.48 (3rd November, 2015) – closed above this point on 8th June, 2016.
Nasdaq: 5,176.77 (2nd December, 2015) – closed above this point on 1st August, 2016.
Dow Theory Conclusion: Original Dow Theory still sees price in a bear market because the transportations have failed to confirm an end to that bear market. Modified Dow Theory (adding S&P and Nasdaq) has failed still to confirm an end to the old bull market, modified Dow Theory sees price still in a bull market.
This analysis is published @ 11:35 p.m. EST.
For longer-term timeline: (bull candy if you can believe in GDP)
So, I’ve been doing a little research on my own, and I’ve been comparing some numbers of inflation, GDP, and SPX prices for the US for the past 30 years since second quarter 1986. Here is what I’ve found, indicated in the chart posted. Obviously I’m not very good at manipulating the titles, but the blue line is the SPX, the gray line is the SPX adjusted for reported inflation, and the red line is reported inflation plus GDP. All of this is free information from the government economic sites and some dividend data from another site that I had to hand input the information.
As one can see, the SPX has kept up with inflation nicely, though it has progressed higher in bull years and lower in bear years. In fact, as of this quarter, we are just slightly overvalued considering inflation.
GDP worked really well the first few years of my study, and in strong bull years, the market seems to have added inflation and GDP together to average gains. However, in bear markets, GDP is unaccounted for. Perhaps my research is flawed, and it probably is, but if the GDP is actually accounted for, the market should be a lot higher than it is today, over 4000 SPX.
If anyone, though, has listened to my rants, they would know that I’m more of a bear than a bull, with a declining GDP and with the tripling of the money supply since 2008, much of this is viewed in skepticism. Granted, the demand for the USD has increased in the last decade, but I ask by how much? Is it triple the demand from 2008? Or is it less as I think it would be? The US population only increased from 304 million to 322 million since 2008…a little less than 6% in about a decade.
For inquiring minds, I have accounted for dividends that were issued over the quarters, though it’s nearly negligible in this small period of time compared to the graph that I’m posting.
Verne, you always have good insight in this kind of thing–I’m sure that you’ve looked into this yourself. Any thoughts? (I may not get back to any comments–very busy tomorrow)
You do have a point. You can arrive at the same conclusion if you think about where the SPX would be had the dollar kept its value, or conversely where it should be now to account for the buck’s decline. EWI has done a similar analysis by pricing the market in Gold, and in other than nominal values, investors have indeed lost ground when the market is viewed in terms of purchasing power. Interesting post!
The Fact is… There is NO Growth in the world and more importantly Corporate Margins peaked 2 years ago and are declining/will continue to decline well into the future. Incomes are flat to down (for 18 Years+) and if you factor in inflation, which is what your doing above, incomes for 85% of the US population is way down!
The Debt worldwide is unsustainable… and the cash flows to support that debt no longer exist…. it’s borrow to pay the existing debt and borrow more to pay that debt. Well that cycle of borrowing is about to come to a sudden STOP!
NONE of this can co-exist with continued new highs in stock prices. HISTORY… going way back to the Roman Empire and before proves this out time and time again!
Yep.
I expect we have a massive crash ahead. The trick is… when will it turn?
That is proving to be very difficult indeed.
Completely agree Lara! in my 20 years in the market, I have never seen anything like this. I have had some recent success trading the 5 minute chart with the 1 minute chart as my trigger. I used to trade the 30 minute chart with the 5 minute as my trigger. It afforded me much more time back then, now I am practically day trading. I like trading longer time frames, but was getting whipped around more then I like the past 6 weeks.
One has to adapt to what the market will give.
One of the biggest mistakes one can make is assuming that market price and the behaviour of participants is in any way related to the rational, logical, or even the obvious! 🙂
It is pretty clear that there are really not too many folks in the market these days so things are pretty much reduced to the algos and banksters chasing their own tails.
Yep. And reduced volume and participation at the end of a trend, divergence between volume and price, is a classic indicator of an exhausted trend.
They can’t hold it up forever on their own.
hi,, 1st,, woo hoo
On form Doc 🙂