
A small downwards day fits for both hourly Elliott wave counts.
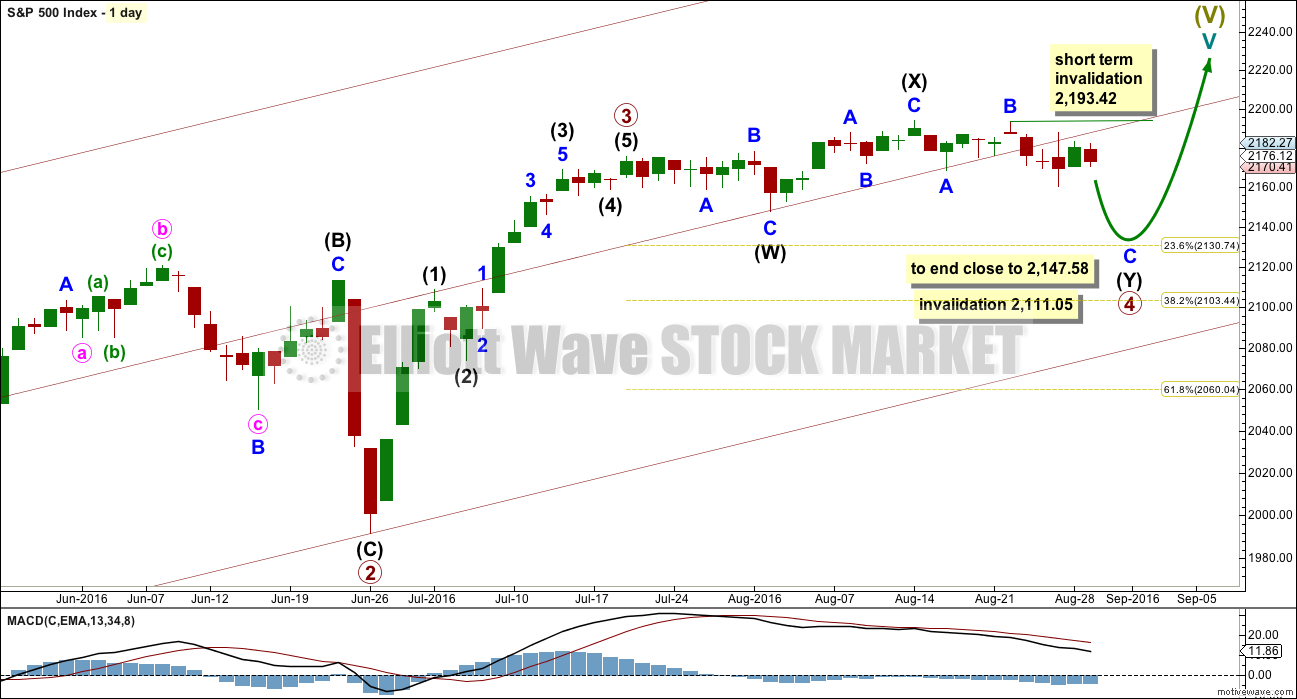
Summary: Overall, this week and maybe also next week should continue with downwards movement to end about 2,147.58. Downwards movement may be choppy, overlapping, and take its time.
Last monthly chart for the main wave count is here.
New updates to this analysis are in bold.
MAIN WAVE COUNT
WEEKLY CHART
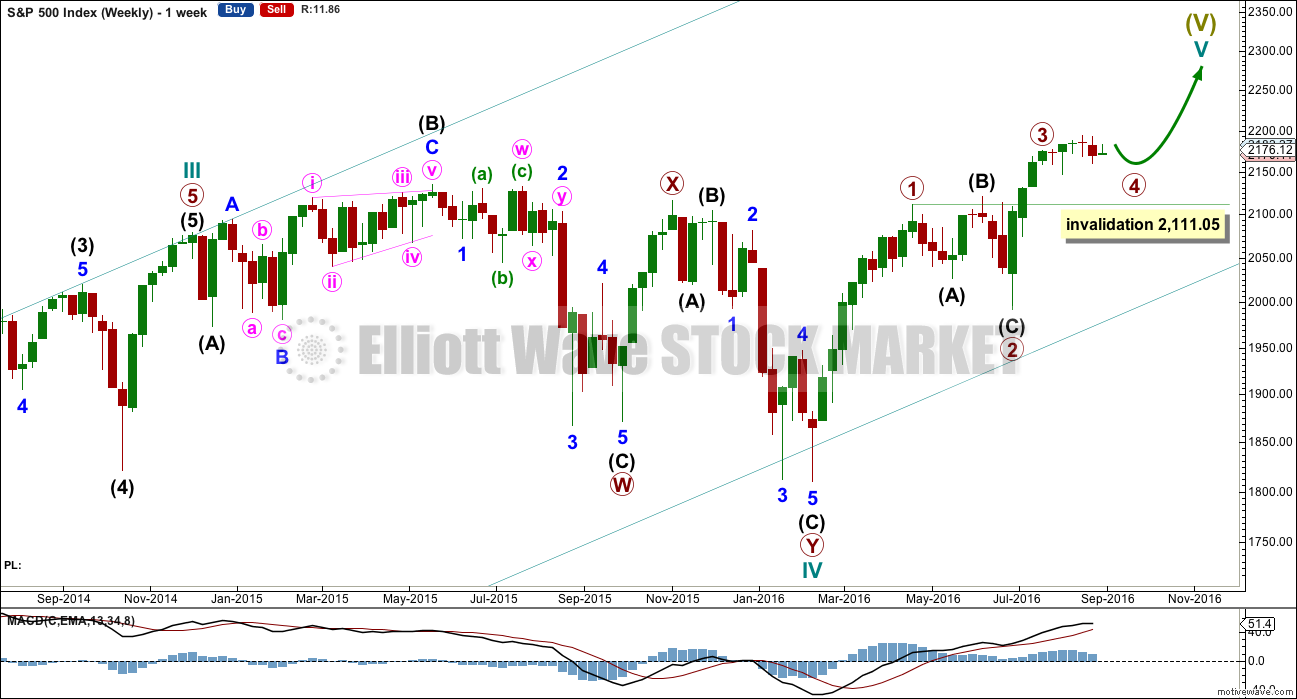
Click chart to enlarge.
Cycle wave V must subdivide as a five wave structure. So far upwards movement is unfolding as an impulse with the fourth wave completing. This may be primary waves 1, 2, 3 and now 4, with primary wave 5 upwards still to come.
Primary wave 3 is shorter than primary wave 1, but shows stronger momentum and volume as a third wave normally does. Because primary wave 3 is shorter than primary wave 1 this will limit primary wave 5 to no longer than equality in length with primary wave 3, so that the core Elliott wave rule stating a third wave may not be the shortest is met. Primary wave 5 will be limited to no longer than 183.95 points in length.
Primary wave 2 was a shallow 0.40 expanded flat correction. Primary wave 4 may be exhibiting alternation as a more shallow double combination.
Primary wave 4 may not move into primary wave 1 price territory below 2,111.05.
DAILY CHART
Click chart to enlarge.
Primary wave 2 lasted 47 days (not a Fibonacci number). Primary wave 3 lasted 16 days (not a Fibonacci number). So far primary wave 4 has lasted 29 days. So far the proportion between primary waves 2 and 4 give this wave count the right look, especially if primary wave 4 continues further.
If primary wave 4 exhibits a Fibonacci number in days of duration, then the next Fibonacci number in the sequence is 34. It may end in another five days.
Within primary wave 4, the first structure in the double is an expanded flat labelled intermediate wave (W). The double is joined by a three in the opposite direction, a zigzag labelled intermediate wave (X). There is no limit to X waves within combinations, and they may make new price extremes beyond the start of the correction in the same way as B waves within flat corrections may.
The second structure in the double is unfolding as a zigzag labelled intermediate wave (Y). Double combinations have a purpose to take up time and move price sideways. To achieve this purpose the second structure in the double normally ends close to the same level as the first. Intermediate wave (Y) is likely to end close to 2,147.58.
While double combinations are relatively common, triples are very rare. When the second structure in the double is complete, then the probability that the whole correction is over would be very high.
In the short term, while the structure of minor wave C is incomplete, no second wave correction within it may move beyond the start of its first wave above 2,193.42.
When primary wave 4 is complete, then a target may be calculated for primary wave 5 to end. That cannot be done yet.
HOURLY CHART
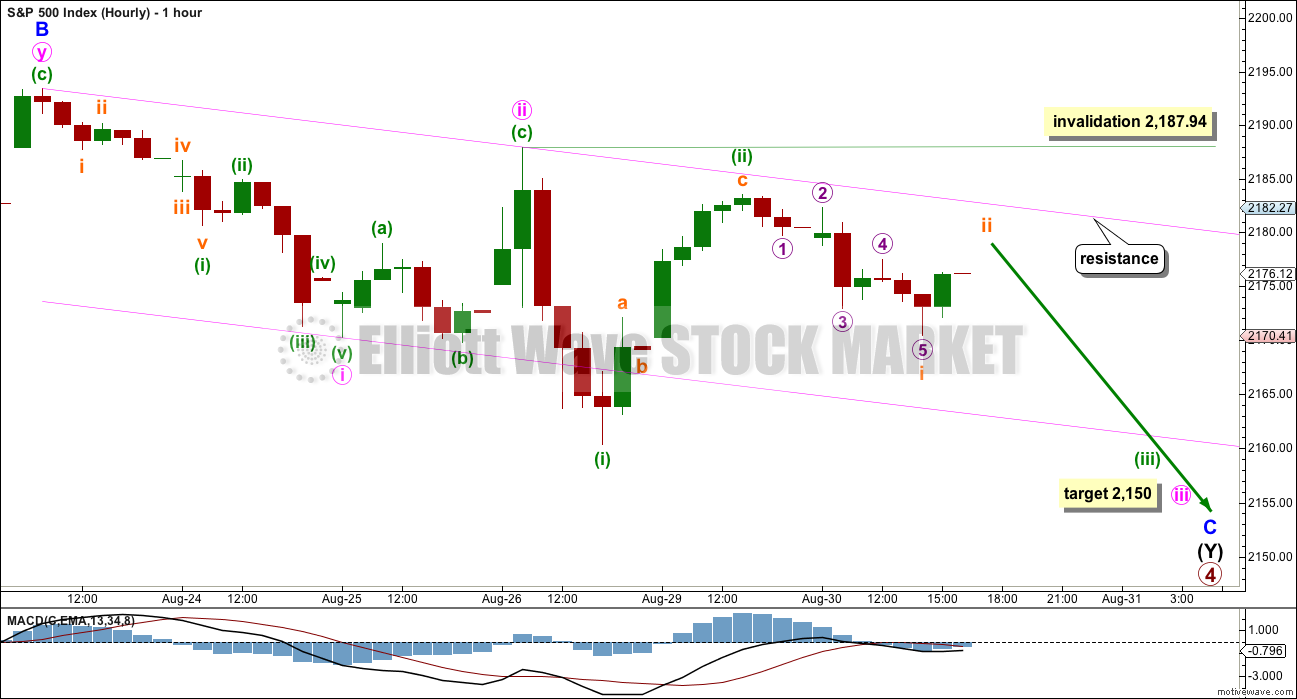
Click chart to enlarge.
Minor wave C must subdivide as a five wave structure, either an impulse or an ending diagonal. An impulse is more common, so this is the main hourly wave count. A diagonal is less common, so this is covered in an alternate hourly wave count below.
At 2,150 minute wave iii would reach 1.618 the length of minute wave i.
Minute wave iii must subdivide as an impulse. Within minute wave iii, minuette wave (ii) may not move beyond the start of minuette wave (i) above 2,187.94. Minuette wave (ii) is still very likely to be over here, but it is possible it may continue higher to be a more obvious three wave looking structure. It should not breach the upper edge of the pink base channel drawn about minute waves i and ii.
Minuette wave (iii) should have the power to break below support at the lower edge of the channel. Once it has done that, then the lower edge may provide resistance.
Another first wave may be complete now within minuette wave (iii). Subminuette wave i subdivides neatly as a five wave impulse. Subminuette wave ii looks incomplete and should move price higher overnight or during the morning of tomorrow’s session. It may not move beyond the start of subminuette wave i above 2,183.48.
Minuette wave (ii) is showing on the daily chart as a green candlestick. Minute wave ii one degree higher does not show with any green candlesticks. The alternate wave count below may explain why, and it may have a better look at the daily chart level at this stage.
ALTERNATE HOURLY CHART
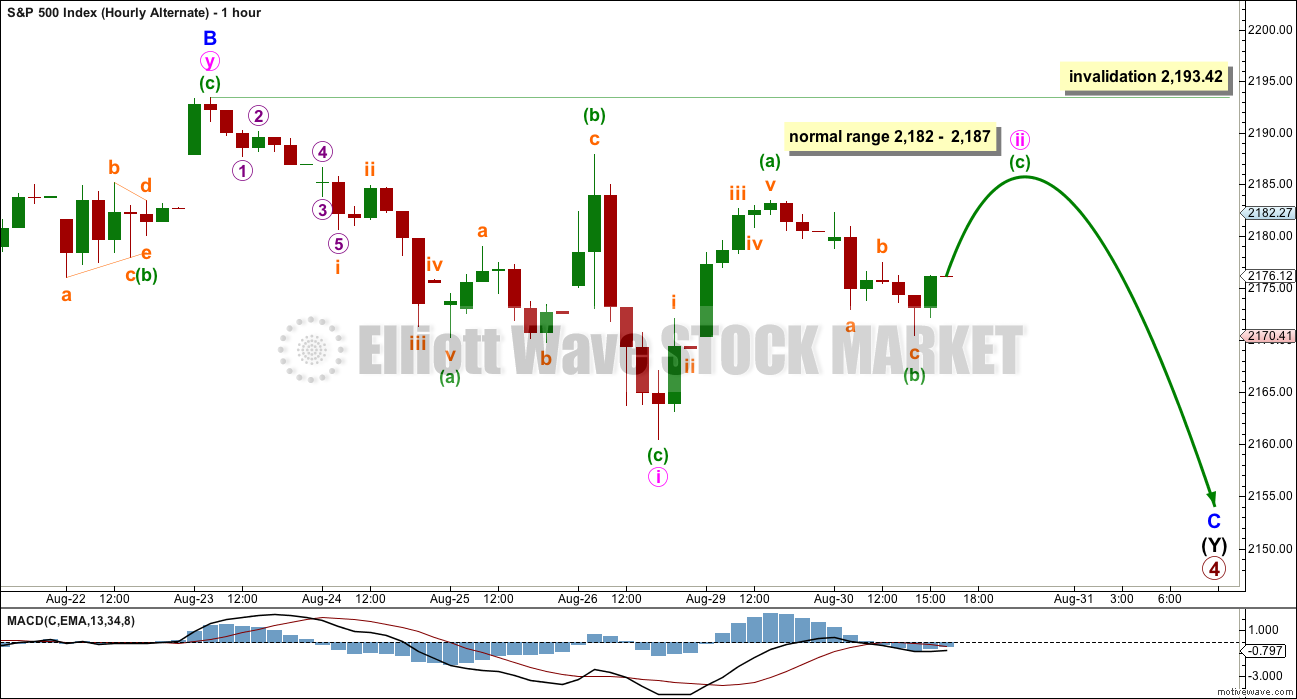
Click chart to enlarge.
The other less likely structure for minor wave C would be an ending diagonal. Ending diagonals require all sub-waves to subdivide as zigzags.
Second and fourth waves within diagonals are normally very deep. The normal range is from 0.66 to 0.81 the prior wave, which gives a range for minute wave ii to end from 2,182 to 2,187.
Minute wave ii should be an obvious three wave structure. So far within it minuette wave (a) looks best as a five. Minuette wave (b) fits best on the five minute chart as a three. Minuette wave (c) should move price higher during tomorrow’s session to complete a big obvious three wave structure for minute wave ii. When that is done, then minute wave iii downwards should show some increase in momentum beyond that seen for minute wave i.
Minute wave ii may not move beyond the start of minute wave i above 2,193.42.
When minute wave ii is a complete three wave zigzag, then minute wave iii downwards must also subdivide as a zigzag and must move price below the end of minute wave i at 2,160.39.
ALTERNATE WAVE COUNT
WEEKLY CHART
Click chart to enlarge.
This alternate is identical to the main wave count with the exception of the degree of labelling within cycle wave V.
Here the degree of labelling is moved down one degree. It is possible that only primary wave 1 is completing as a five wave impulse. When it is complete, then primary wave 2 would be expected to be a deep pullback which may not move beyond the start of primary wave 1. At that stage, the invalidation point would move down to the start of cycle wave V at 1,810.10. At that stage, a new low below this point would confirm a bear market for both Elliott wave and Dow Theory.
At 2,500 cycle wave V would reach equality in length with cycle wave I. This is the most common ratio for a fifth wave, so this target has a good probability.
At this stage, this alternate wave count differs only in the degree of labelling to the main wave count, so subdivisions for daily and hourly charts would be labelled the same.
TECHNICAL ANALYSIS
WEEKLY CHART
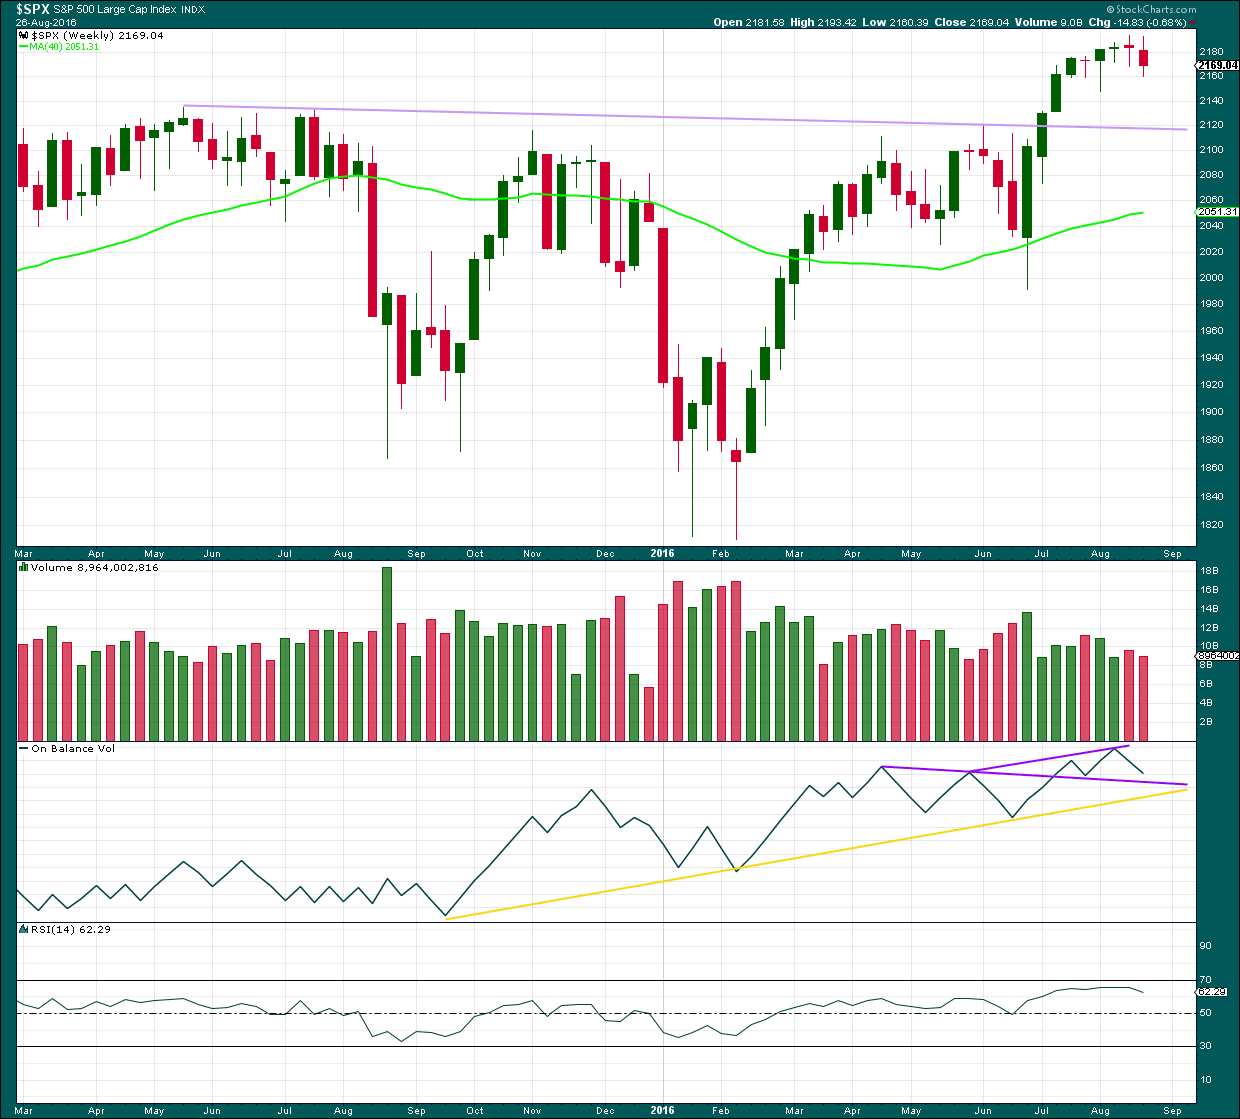
Click chart to enlarge. Chart courtesy of StockCharts.com.
Last week completes a red weekly candlestick with lighter volume than the prior week. The fall in price was not supported by volume at the weekly chart level.
The last four candlesticks complete an Evening Doji Star candlestick pattern. After a clear upwards trend, this is a reversal pattern and indicates a reversal from up to either down or sideways, and makes no comment on how far price may move lower. The last candlestick in the pattern does not have support from volume weakening the reversal implications of the pattern.
This weekly candlestick also completes a Bearish Engulfing pattern with the candlestick three weeks before. The low of this week is well below the open of the week three weeks ago. Again, the pattern is not supported by volume which weakens the reversal implications.
On Balance Volume is coming lower to close in on the purple support line. This support may halt the fall in price.
RSI is not extreme. There is room for price to rise or fall.
DAILY CHART
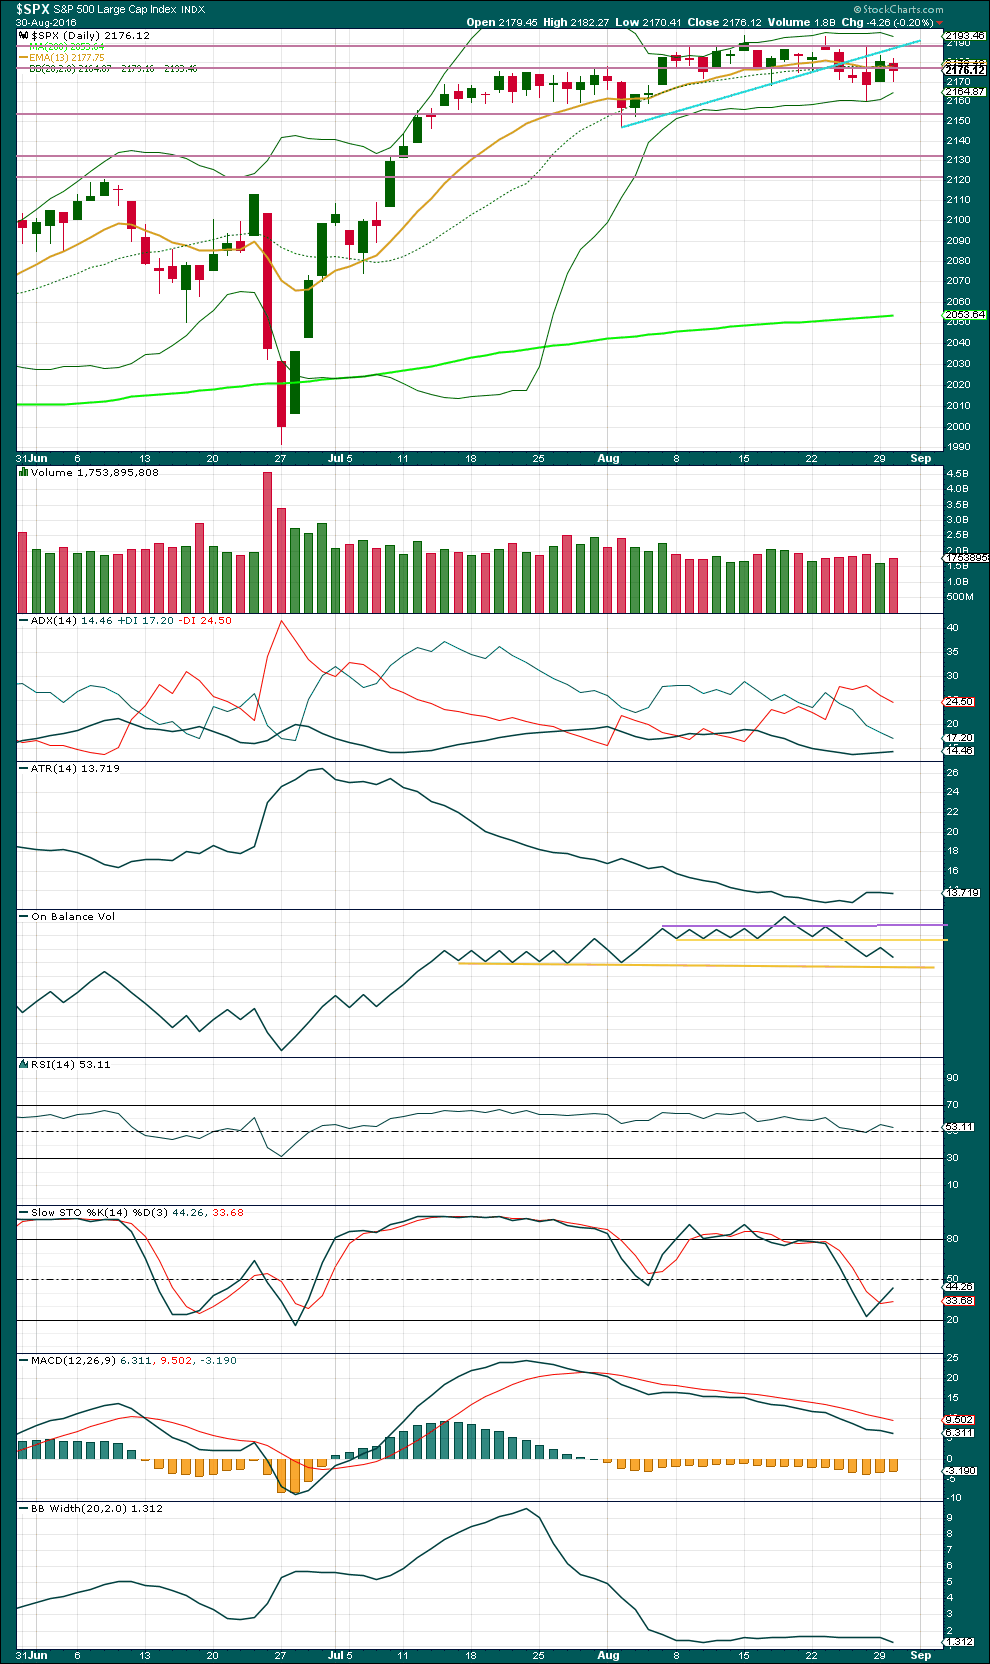
Click chart to enlarge. Chart courtesy of StockCharts.com.
An increase in volume for a downwards day indicates that at least short term more downwards movement is very likely. The fall in price today was supported by volume. The short term volume profile over the last seven days is bearish.
On Balance Volume is giving a clearer and stronger bearish signal with a move down and away from the yellow line. Volume and On Balance Volume both strongly support the Elliott wave count. OBV tested resistance at the upper yellow line. A new support line is added today; this may be reached in another one or two days.
Volume for downwards days is still lighter than prior upwards days though. There is still evidence of the market falling mostly of its own weight, but there is some increase selling pressure.
The ADX line has turned upwards, but with it under 15 a trend is not yet indicated. If this is a downwards trend, it would be in the very early stages or it would be very weak.
ATR is overall flat to declining. This does not indicate a trend; it is typical of a consolidation.
RSI is neutral and exhibits no divergence with price to indicate weakness.
Stochastics is not yet oversold, so there is room for price to fall further. When Stochastics is firmly oversold and price finds support, then the downwards swing may be expected to end. Price may find some support about 2,155.
Bollinger Bands remain tightly contracted. This indicates the market is still likely consolidating and not yet in the new stages of a downwards trend.
VOLATILITY – INVERTED VIX CHART
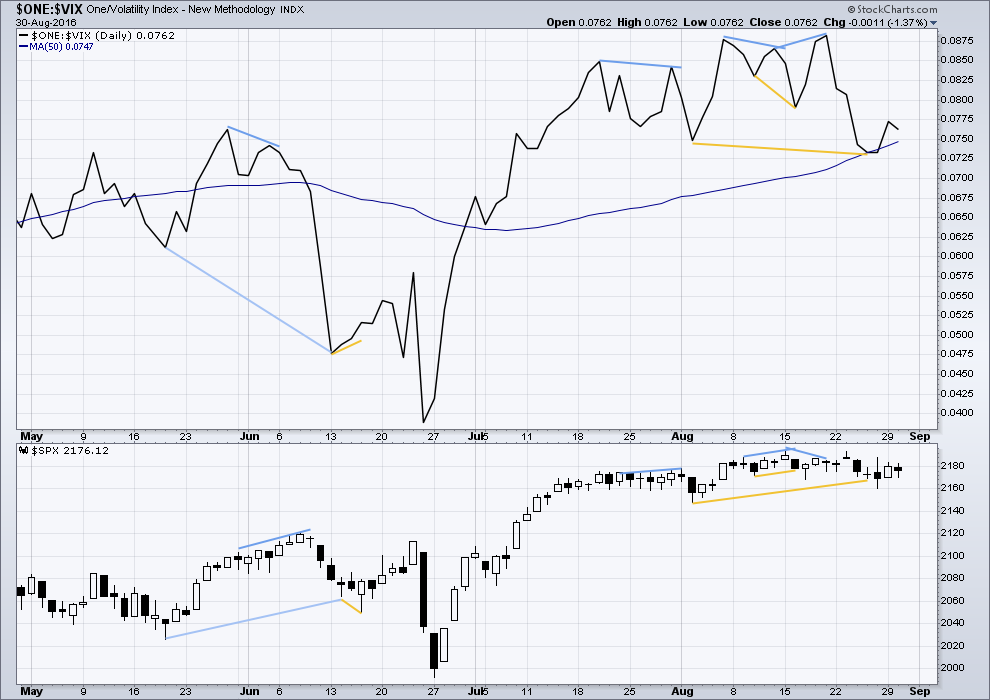
Click chart to enlarge. Chart courtesy of StockCharts.com.
Volatility is declining as price is rising. This is normal for an upwards trend.
There are a few instances of multi day divergence between price and inverted VIX noted here. Bearish divergence is blue. Bullish divergence is yellow. Each of these instances was followed by expected price movement if only for two days. Divergence with VIX and price is not always working, but it is still sometimes working. So it will be noted.
It appears so far that divergence between inverted VIX and price is again working to indicate short term movements spanning one or two days.
The bullish divergence from VIX indicated by the longer yellow lines may now be resolved by a day of upwards movement. Lately, this divergence has been followed by only one or two days of price movement in the expected direction.
BREADTH – AD LINE
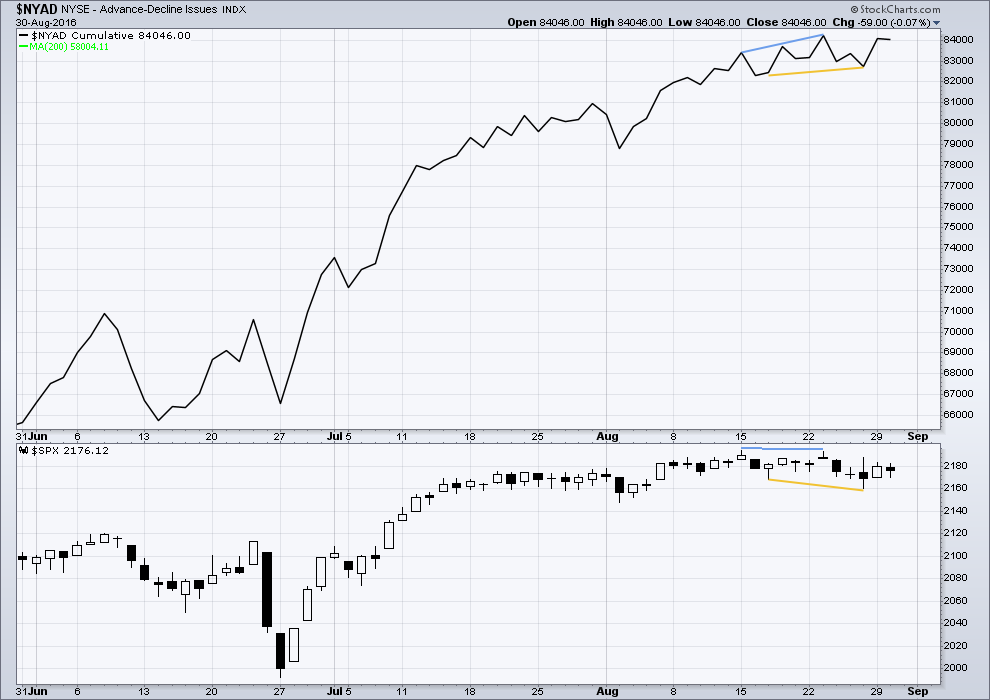
Click chart to enlarge. Chart courtesy of StockCharts.com.
There is support from market breadth as price is rising.
At the end of last week, there is bullish divergence between price and the AD line: the AD line has made a higher low as price made a new low for Friday below the prior low of 17th of August. This downwards movement from price for the last four days is not supported by market breadth. It is more likely to be a short term correction than the start of a deeper pullback.
This bullish divergence may now be resolved by one day of upwards movement.
DOW THEORY
Major lows within the prior bull market:
DJIA: 15,855.12 (15th October, 2014) – closed below on 25th August, 2015.
DJT: 7,700.49 (12th October, 2014) – closed below on 24th August, 2015.
S&P500: 1,821.61 (15th October, 2014) – has not closed below this point yet.
Nasdaq: 4,117.84 (15th October, 2014) – has not closed below this point yet.
Major highs within the new bear market:
DJIA: 17,977.85 (4th November, 2015) – closed above on 18th April, 2016.
DJT: 8,358.20 (20th November, 2015) – has not closed above this point yet.
S&P500: 2,116.48 (3rd November, 2015) – closed above this point on 8th June, 2016.
Nasdaq: 5,176.77 (2nd December, 2015) – closed above this point on 1st August, 2016.
Dow Theory Conclusion: Original Dow Theory still sees price in a bear market because the transportations have failed to confirm an end to that bear market. Modified Dow Theory (adding S&P and Nasdaq) has failed still to confirm an end to the old bull market, modified Dow Theory sees price still in a bull market.
This analysis is published @ 09:07 p.m. EST.
Look at this daily chart of the SP! The SP had nice strong moves all the way up until mid July. Since then, we have flat lined! The central banksters have literally “killed” this market.
They are too busy shorting the precious metals to shore up the SPX! 🙂
Even though this downwards move today is somewhat deep, because it has not yet made a new low below yesterday’s low I am still leaning towards the ending diagonal scenario.
I’ll keep both the ED and impulse charted. I have to place the impulse in main wave count position, and the ED as an alternate still, only because diagonals are not as common as impulses.
The price point to differentiate them is now 2,183.48 to the upside and 2,160.39 to the downside.
A new high above 2,183.48 tells us the diagonal is more likely.
A new low below 2,160.39 tells us the impulse is more likely.
Yada… Yada… Yada… The clock is ticking!
Joseph,
The clock has been ticking for a LONG time. So what? I would say, please check the batteries to make sure it is not dead.
🙂
I think there’s a pace maker inside Mr Market, ticking away, but the battery is dying and almost dead.
Mr Market needs resuscitation and soon.
Lot of massive institutions (BOJ, Japanese Pension fund, US pension funds, etc) buying. Remember, everyone is searching for yield and relative values in the market. Flavor of the month was Financials and Tech. We are entering September which is seasonally a down month. Lara’s analysis of maybe 2 or so weeks of down-ward/neutral mkts before next leg higher makes lot of sense.
Guys… here is my analysis :
US: Economic growth is perfect
EURO-AREA: Continued growth, Brexit will increase macroeconomics opportunities
ASIA-PACIFIC: Growth is likely to improve further and higher
LATIN AMERICA: Winning the race ahead
SUB-SAHARAN AFRICA: Extremely positive
I sincerely beg your pardon to have doubted of the above assumptions…SP 500 up to 3000 ! Go…Pokemon Go …
As Nietsche quoted: “This world is the will to power — and nothing besides!”
Someone is playing with puppets…will there be eventually an end … or is this ignominy going to last forever?
We are in the middle of nowhere…
Always the same scenario…. down and suddenly… end of session .. up ! Wow…unexpected, really…
Hello,
interesting article ( I do live in Switzerland…therefore UBS…)
“The weakness of U.S. inflation expectations and cross-asset correlations signal danger ahead, according to analysts at UBS AG” (August 24, 2016 – Bloomberg)
http://www.bloomberg.com/news/articles/2016-08-24/ubs-technical-indicators-portend-danger-for-s-p-500-bulls
A little 12:30 pause at Lara’s lower hourly channel line. Come on baby! Bust through!
A real dogfight underway around SPX 2165.00 This ought to be intersting…. 🙂
Interesting things going on in Gann cycles. Due to astrological configurations starting tomorrow, it looks like September could be a crazy month.
If you are interested in W.D. Gann you’ll likely find this presentation interesting:
https://www.youtube.com/watch?v=dLHGB0jyR4A
hey ,,is that our Olga??
I don’t think so. Different surname, and our Olga is British (I think).
The Olga in this video has an Australian accent.
And if anyone says she sounds like me… with my Kiwi accent… there will be BIG trouble 🙂
Backing up the truck on UVXY. This is the biggest trade I will be making this year. I am opting to hold the shares instead of options as I don’t know the exact timing of this detonation…..
Wow!!!!
This is downright scary folks….
Yep. Something big is coming…. When it arrives it should be explosive.
I’m wondering if October will be the month for this market to turn. October has been a scary starting month for a few big market crashes. The 1929 crash began in October, 1987 and 2007.
Many eyes looking for a “Red October”. I am just wondering if this kind of compression can hold up until then. Of course there could be an explosive final move to the upside which could resolve the situation well before then. Having already made new highs from the prior consolidation period, I am inclined to think the current situation may be indicating a move in the opposite direction.
Selling SPY September 14 expiration 218.50/219.50 bearish call credit spread for limit price of 0.40 per contract. Risk is 100 per contract if trading above 219.5 at expiration.
The violent move presaged by the intense BB compression has still not occurred and the delay may be lulling traders into somnolence. While it does not tell what direction the move will be, the historic nature of the compression is suggesting it will be substantial. There is an incredible amount of midterm complacency and already the talking heads are talking up a supposedly inevitable year-end rally. I think it is a time to be cautious, and equally important, to be properly hedged, regardless of which side of the market you are positioned. SPX 2165 is the next key level I am watching. If it is broken on high volume, I think at the very least a re-test of the original break-out area of 2110 is in the cards.
I’d expect 2,134 to offer really strong support too along the way down.
Hi!
hi Verne,,