
A short sharp thrust down was expected before price turned upwards, but this is not what happened.
Price moved upwards at the start of the session.
Summary: The trend remains the same, until proven otherwise. Assume the trend is up while price is above 2,147.58. The mid term targets are 2,332 or 2,445. If price makes a new low below 2,147.58, then overall sideways movement for a continuation of a longer consolidation would be expected. At this stage, a deeper pullback looks increasingly unlikely. There is not enough selling pressure which would be required to push price lower.
Last monthly chart for the main wave count is here.
New updates to this analysis are in bold.
MAIN WAVE COUNT
WEEKLY CHART
Click chart to enlarge.
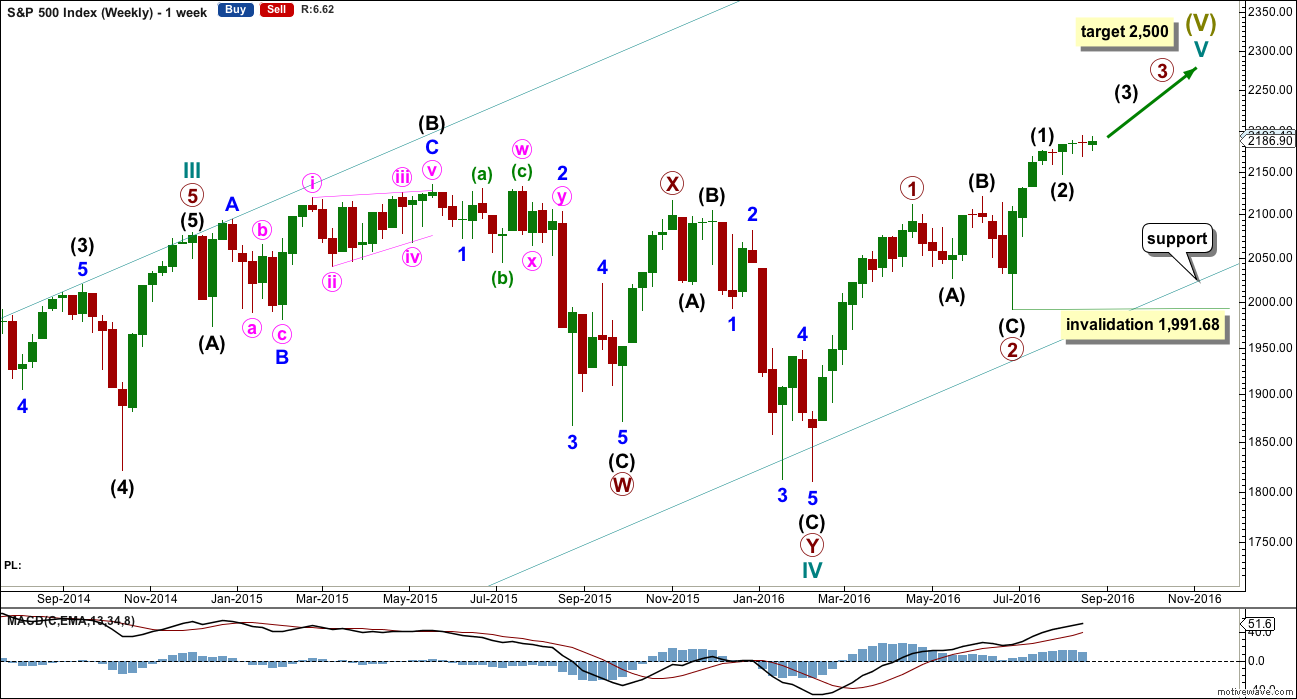
Cycle wave II was a shallow 0.41 zigzag lasting three months. Cycle wave IV is seen as a more shallow 0.28 double combination lasting 15 months. With cycle wave IV five times the duration of cycle wave II, it should be over there.
Cycle wave I lasted 28 months (not a Fibonacci number), cycle wave II lasted a Fibonacci 3 months, cycle wave III lasted 38 months (not a Fibonacci number), and cycle wave IV lasted 15 months (two more than a Fibonacci 13).
If the target for cycle wave V is for it to be equal in length with cycle wave I, then it may also be expected to be about equal in duration. So far cycle wave V is in its sixth month. After this month, a further 22 months to total 28 seems a reasonable expectation, or possibly a further 15 months to total a Fibonacci 21.
This first weekly wave count expects the more common structure of an impulse is unfolding for cycle wave V. Within cycle wave V, primary waves 1 and now 2 should be over. Within primary wave 3, no second wave correction may move beyond its start below 1,991.68. If price makes a new high above 2,203.68, then that would provide enough confidence that intermediate wave (2) should be over to move the invalidation point on the weekly chart up to 2,147.58.
There is one other possible structure for cycle wave V, an ending diagonal. This is covered in an alternate.
DAILY CHART
Click chart to enlarge.
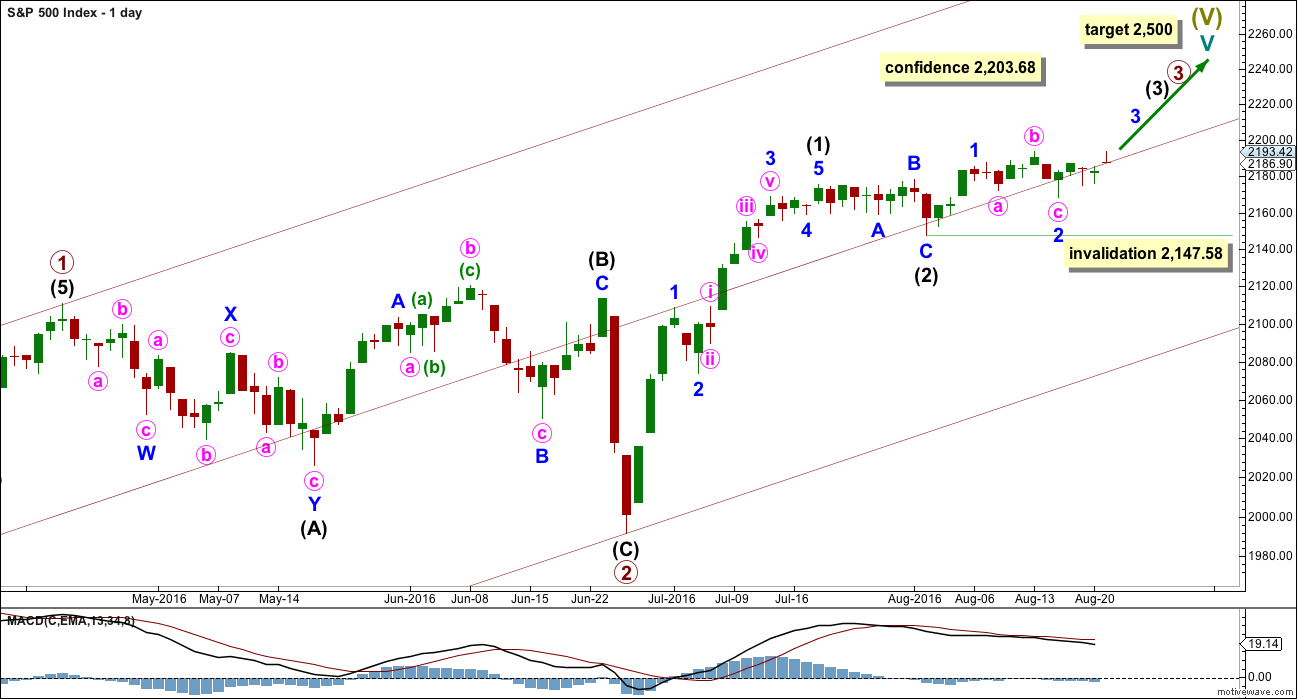
Primary wave 2 is complete as a shallow regular flat correction. Primary wave 3 is underway.
Within primary wave 3, intermediate wave (1) is a complete impulse. Intermediate wave (2) may now be a complete flat correction.
It is still just possible that intermediate wave (2) may not be complete and could continue sideways and a little lower. A deep pullback would not be expected, only a sideways combination, double flat or slightly lower expanded flat would be indicated. If price moves above 2,203.68, then upwards movement from the low at 2,147.58 would be more than twice the length of intermediate wave (2). At that stage, the probability that upwards movement is a B wave within intermediate wave (2) would be so low the idea should be discarded. A new high above 2,203.68 would add confidence in the upwards trend.
If price moves below 2,147.58, then this main wave count would change to see intermediate wave (2) continuing further sideways. The alternate would remain an alternate. The invalidation point would move down to the start of intermediate wave (1).
Within intermediate wave (3), no second wave correction may move beyond its start below 2,147.58.
Add a mid line to the base channel drawn about primary waves 1 and 2. Draw this channel from the start of primary wave 1 (seen on the weekly chart) to the end of primary wave 2, then place a parallel copy on the end of primary wave 1. The mid line may provide some support along the way up.
At this stage, it looks most likely that intermediate wave (3) has begun. It should be expected to show the subdivisions of minor waves 2 and 4 clearly on the daily chart with one to a few red daily candlesticks or doji. With minor wave 2 now showing as two red candlesticks, one doji and a green candlestick with a long lower wick, this wave count so far has a typical look.
HOURLY CHART
Click chart to enlarge.
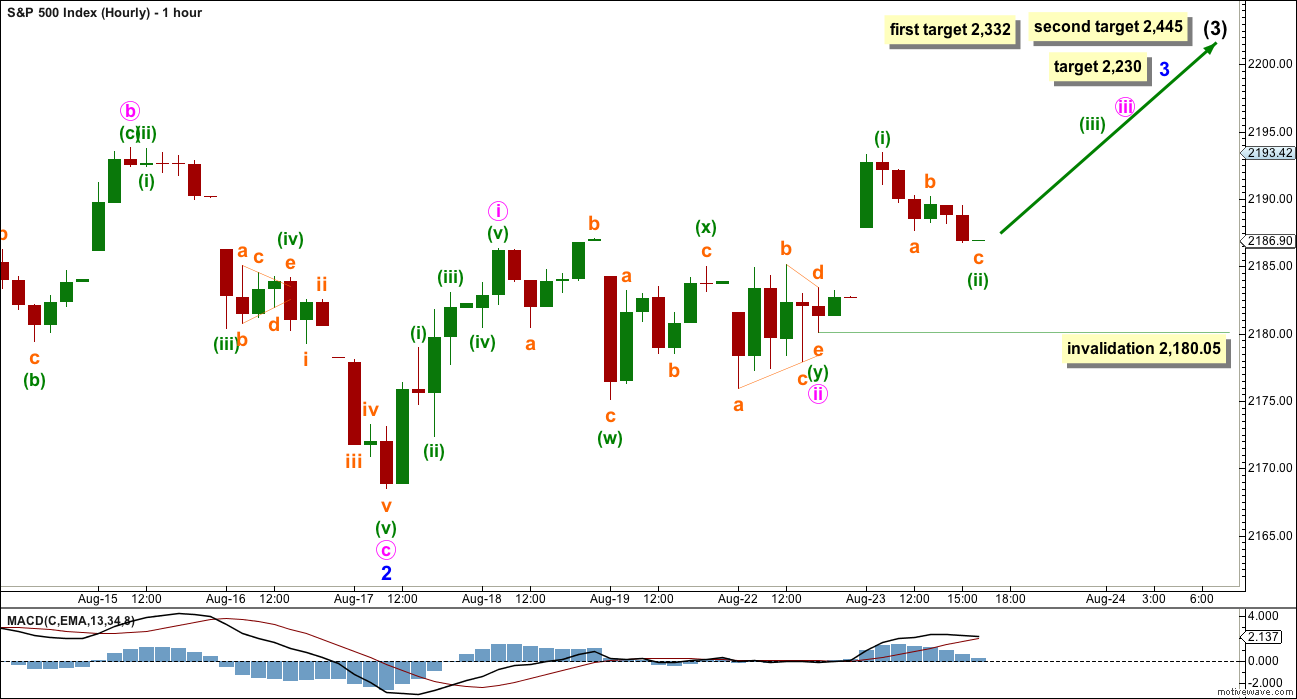
Minute wave ii fits as a double combination: flat – X – triangle.
Minute wave iii has not moved far enough above the end of minute wave i yet for it to be complete. It needs to move far enough above the end of minute wave i to allow room for a subsequent correction for minute wave iv to unfold and remain above first wave price territory.
At 2,227 minute wave iii would reach 2.618 the length of minute wave i.
Minute wave iii may only subdivide as an impulse. So far, within minute wave iii, minuette wave (i) may have ended at today’s high. Minuette wave (ii) may not move beyond the start of minuette wave (i) below 2,180.05.
The target for minor wave 3 remains the same. At 2,230 minor wave 3 would reach 1.618 the length of minor wave 1.
Mid term targets for intermediate wave (3) remain the same. At 2,332 intermediate wave (3) would reach equality in length with intermediate wave (1). If price gets to the first target and the structure is incomplete, or if it just keeps going up through the first target, then the second target would be used. At 2,445 intermediate wave (3) would reach 1.618 the length of intermediate wave (1).
ALTERNATE WAVE COUNT
WEEKLY CHART
Click chart to enlarge.
This alternate may diverge from the main wave count.
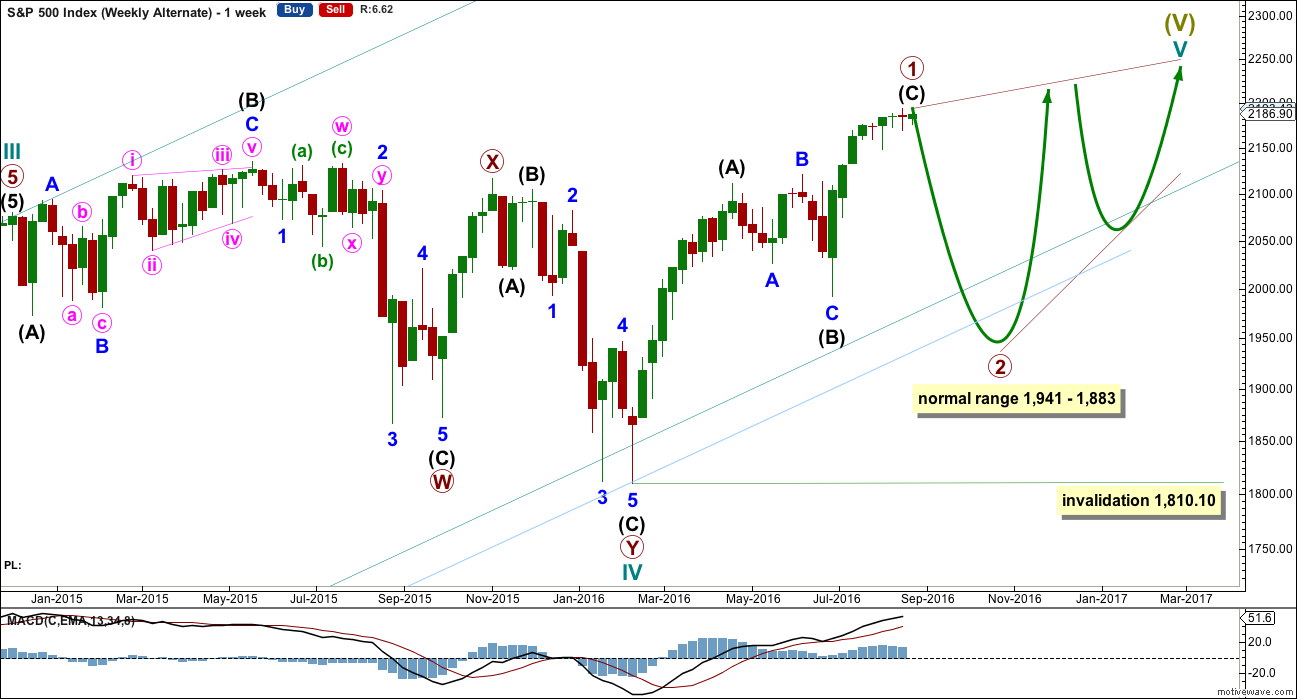
The other structural possibility for cycle wave V is an ending diagonal. Ending diagonals are more often contracting than expanding, so that is what this alternate will expect.
Ending diagonals require all sub-waves to subdivide as zigzags. Zigzags subdivide 5-3-5. Thus primary wave 1 may now be a complete (or almost complete) zigzag, labelled intermediate waves (A)-(B)-(C) which subdivides 5-3-5.
The normal depth for second and fourth waves of diagonals is from 0.66 to 0.81 the prior actionary wave. Primary wave 2 may end within this range, from 1,941 to 1,883.
Primary wave 2 may not move beyond the start of primary wave 1 below 1,810.10.
When primary wave 2 is a complete zigzag, then another zigzag upwards for primary wave 3 must make a new high above the end of primary wave 1. It would most likely be shorter than primary wave 1 as diagonals are more commonly contracting. If primary wave 3 is longer than primary wave 1, then an expanding diagonal would be indicated.
The psychology of diagonals is quite different to impulses. Diagonals contain corrective characteristics and subdivide as a series of zigzags. When diagonals turn up in fifth wave positions, they take on some of the properties of the correction which inevitably follows them. The deterioration in fundamentals and underlying technicals is more extreme and more evident. There is some support for this idea at this time.
The final target of 2,500 would not be able to be reached by an ending contracting diagonal. The final target for this alternate would be calculated only when primary wave 4 is complete.
The classic pattern equivalent is a rising wedge.
DAILY CHART
Click chart to enlarge.
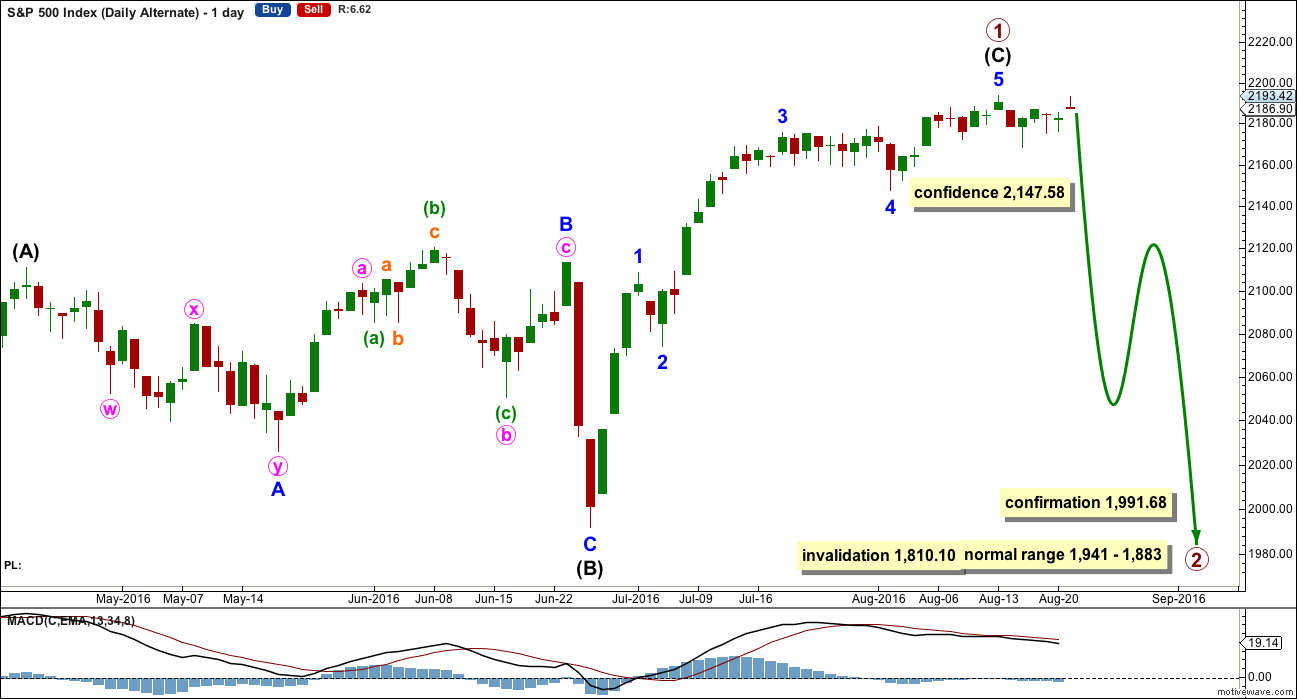
It is possible now that intermediate wave (C) is a complete five wave impulse. However, this wave count suffers from disproportion between minor waves 2 and 4 which gives this possible impulse an odd look. It looks like a three where it should look like a five. However, the S&P just does not always have waves which look right at all time frames.
Because this wave count expects to see a substantial trend change here from bull to bear for a multi week deep pullback, it absolutely requires some indication from price before confidence may be had in it. A new low below 2,147.58 would add confidence.
At this stage, there is not enough selling pressure to support this wave count. When the market has fallen recently, it has fallen of its own weight. For a deep pullback sellers would have to enter the market and be active enough to push price lower. That is not happening at this time.
TECHNICAL ANALYSIS
WEEKLY CHART
Click chart to enlarge. Chart courtesy of StockCharts.com.
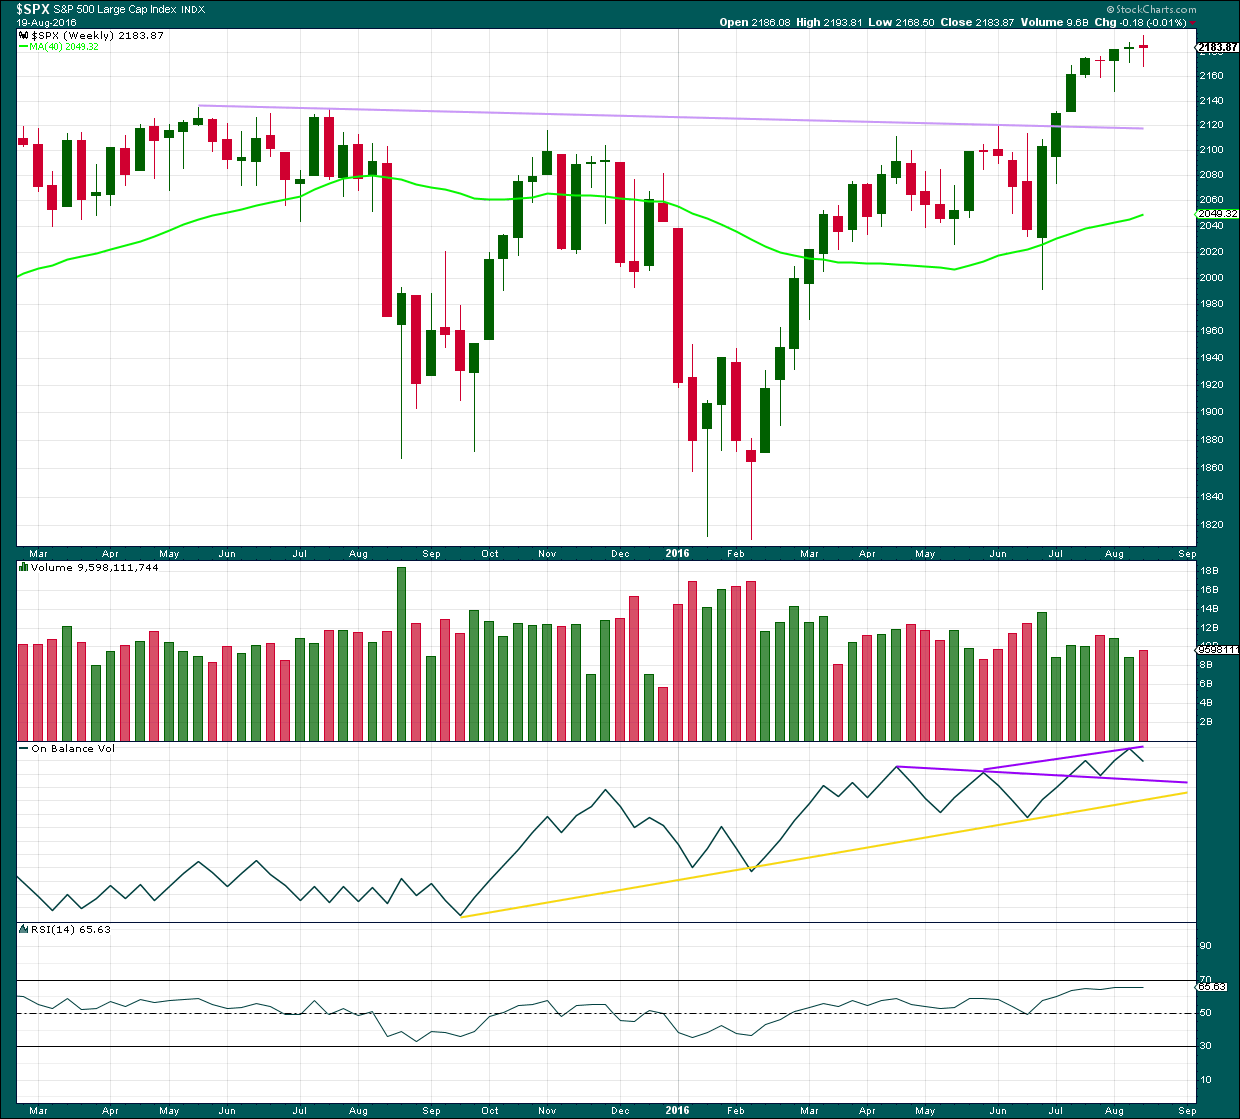
Last week completes another doji candlestick, this time with a slightly wider range than the week before. Overall, this doji represents a balance between bulls and bears with the bears very slightly stronger to complete a red candlestick. A slight increase in volume is slightly bearish, but in this instance because the candelstick is a doji we should look inside at the daily volume bars for a clearer picture.
On Balance Volume remains bullish while it is above the longer purple trend line. A new trend line is added. A break above this shorter and steeper line would be another bullish signal.
RSI is still not extreme. There is room for price to rise further.
DAILY CHART
Click chart to enlarge. Chart courtesy of StockCharts.com.
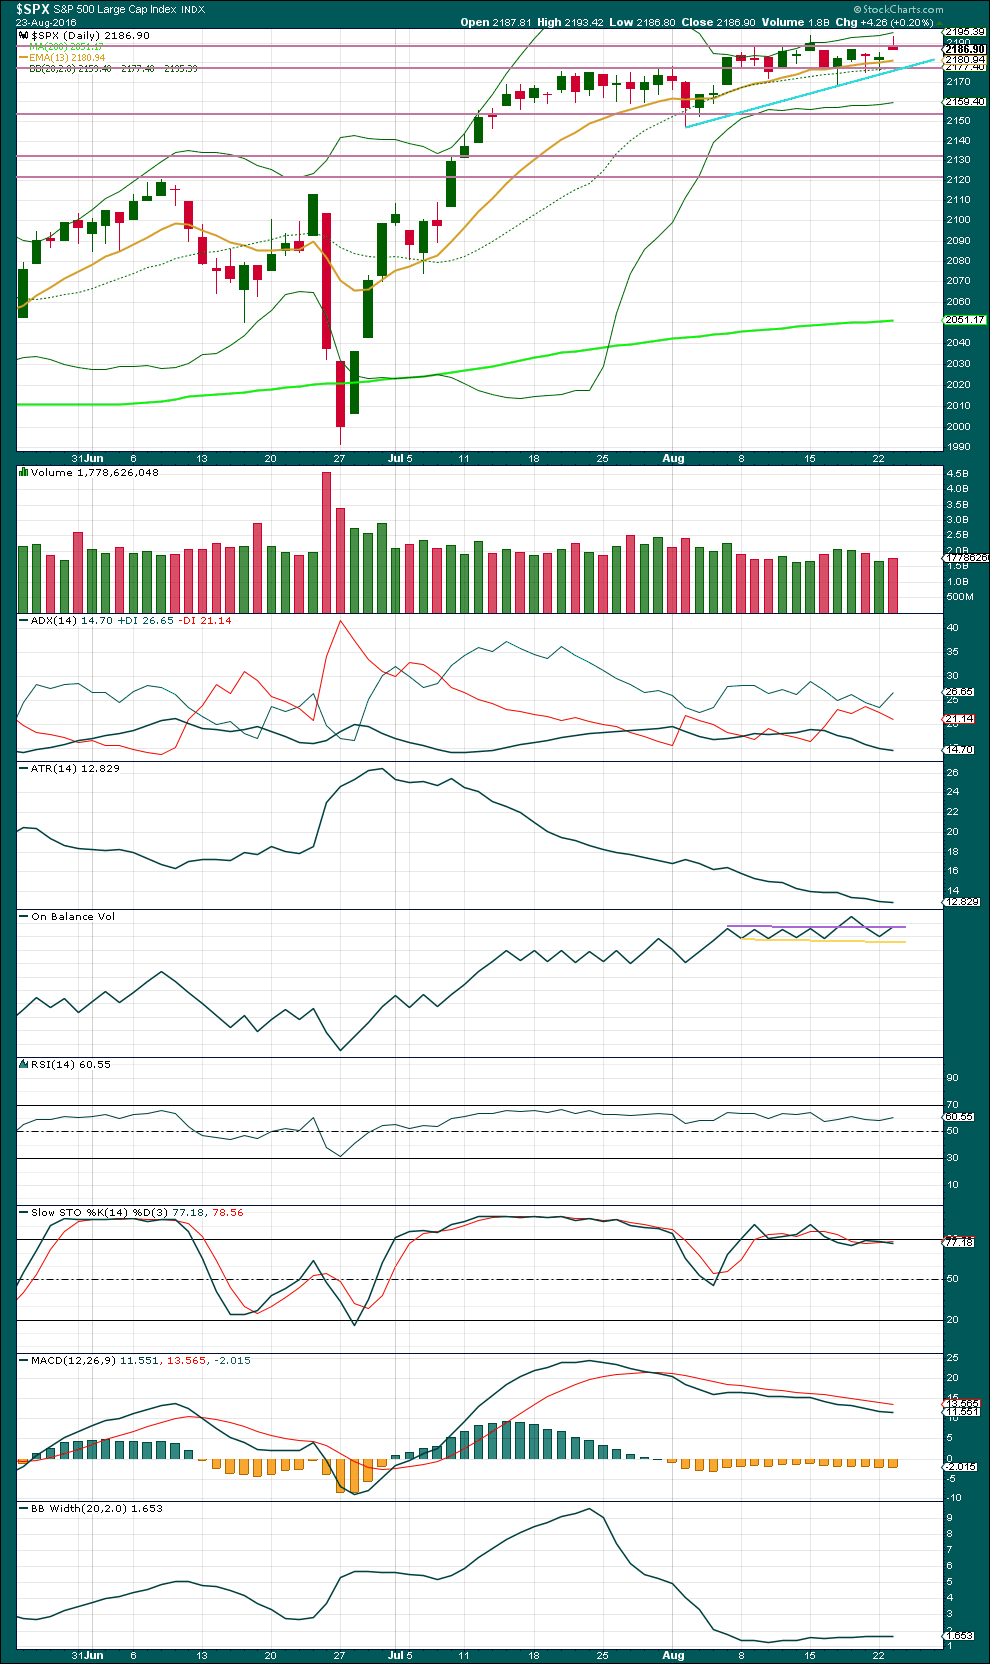
Another doji, this one a Gravestone doji, during a consolidation cannot be interpreted as a trend change signal. Slightly stronger volume for an overall downwards day is very slightly bearish, but for a doji this is not a strong signal either. Overall, price continues to move sideways and is range bound. Overall, volume is still declining, as is ATR, and the Bollinger Bands remain tightly contracted.
Price may be finding some resistance at the horizontal trend line about 2,185. A break above resistance on a day with some increase in volume would add further confidence to the wave count.
It should be expected that ATR will again start to increase as a trend becomes stronger and clearer.
ADX is still declining, but during this entire time the +DX line has remained above the -DX line. No trend change has been indicated from ADX; the trend remains up. ADX may be indicating an interruption to the upward trend by some sideways consolidation, which is what has been happening.
The bullish signal from On Balance Volume with a break above the purple trend line is now negated with OBV returning to below the line. OBV today found support at the yellow line. The purple line has been weakened. Another break above it would be a bullish signal, but a weaker signal.
RSI is not yet extreme. There is room for price to rise or fall. There is no divergence at this stage between price and RSI to indicate weakness, but even if there was it would not be given much weight. The absence of divergence offers some slight support to this analysis today.
Stochastics is close to overbought, but this oscillator may remain extreme for reasonable periods of time during a trending market. If the market is still consolidating, a downwards swing from price would be expected here.
Momentum has been declining as price has been moving overall sideways. There is divergence between price and MACD, but this is unreliable at this time and is still not given any weight in this analysis.
Bollinger Bands remain tightly contracted but may be beginning to widen a little. It would be normal to expect them to again expand as some volatility returns to this market and price starts to more clearly trend. That is what the Elliott wave count expects to happen. It remains to be seen if this market can behave normally at this time though.
VOLATILITY – INVERTED VIX CHART
Click chart to enlarge. Chart courtesy of StockCharts.com.
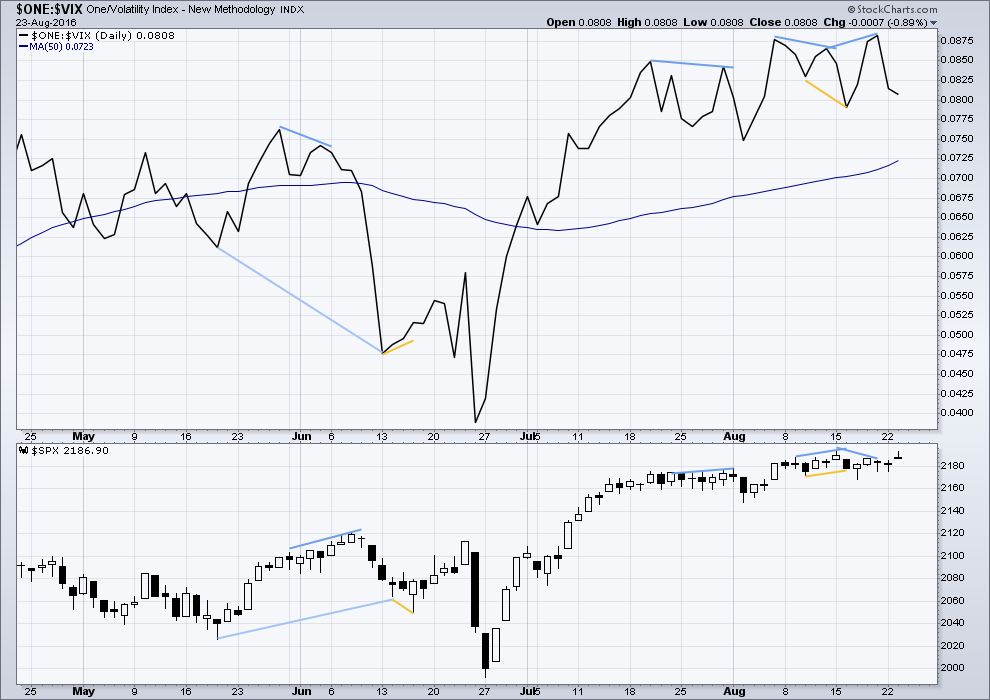
Volatility is declining as price is rising. This is normal for an upwards trend.
There are a few instances of multi day divergence between price and inverted VIX noted here. Bearish divergence is blue. Bullish divergence is yellow. Each of these instances was followed by expected price movement if only for two days. Divergence with VIX and price is not always working, but it is still sometimes working. So it will be noted.
It appears so far that divergence between inverted VIX and price is again working to indicate short term movements spanning one or two days.
No new short term divergence between price and inverted VIX is noted today.
BREADTH – AD LINE
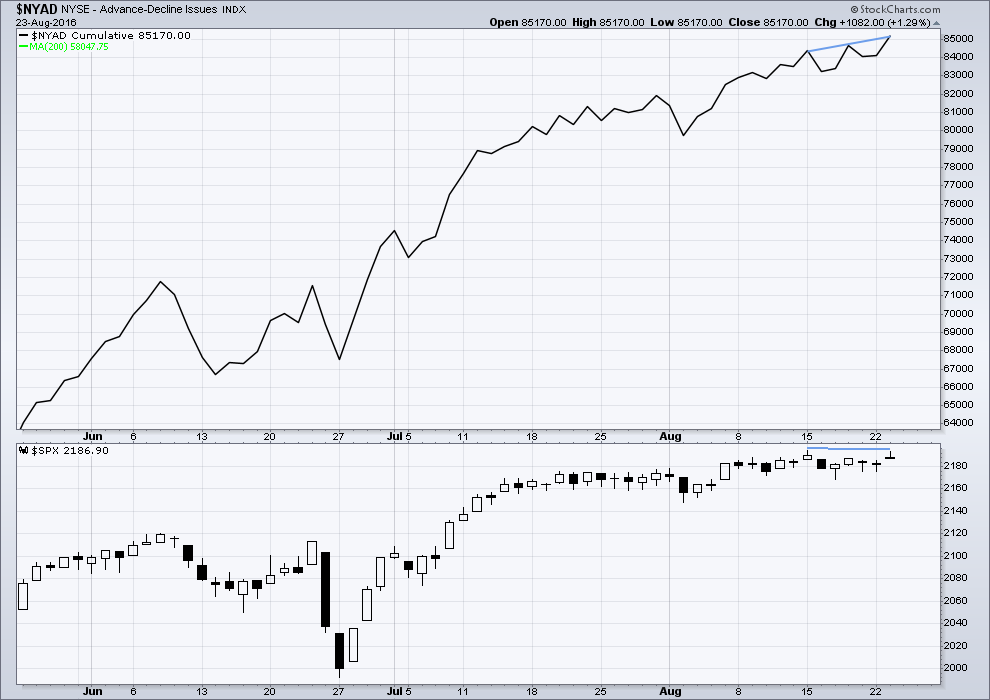
Click chart to enlarge. Chart courtesy of StockCharts.com.
There is support from market breadth as price is rising.
There is today a slightly longer term hidden bearish divergence between price and the AD line. The AD line today has made a new high above the prior high of 15th of August, but price has made a slightly lower high. This indicates some weakness in price and may be followed by a day or two of downwards movement.
However, only one recent instance of divergence working between the AD line and price has been noted. Several other instances (more long than short term) have been noted in recent months which have not worked. This divergence today should be given only a very little weight.
DOW THEORY
Major lows within the prior bull market:
DJIA: 15,855.12 (15th October, 2014) – closed below on 25th August, 2015.
DJT: 7,700.49 (12th October, 2014) – closed below on 24th August, 2015.
S&P500: 1,821.61 (15th October, 2014) – has not closed below this point yet.
Nasdaq: 4,117.84 (15th October, 2014) – has not closed below this point yet.
Major highs within the new bear market:
DJIA: 17,977.85 (4th November, 2015) – closed above on 18th April, 2016.
DJT: 8,358.20 (20th November, 2015) – has not closed above this point yet.
S&P500: 2,116.48 (3rd November, 2015) – closed above this point on 8th June, 2016.
Nasdaq: 5,176.77 (2nd December, 2015) – closed above this point on 1st August, 2016.
Dow Theory Conclusion: Original Dow Theory still sees price in a bear market because the transportations have failed to confirm an end to that bear market. Modified Dow Theory (adding S&P and Nasdaq) has failed still to confirm an end to the old bull market, modified Dow Theory sees price still in a bull market.
This analysis is published @ 10:49 p.m. EST.
Look what else worked. Divergence with price and the AD line.
It’s working again. Yay!
Mr Market isn’t completely broken 🙂 There is hope yet.
It is really aggravating getting different closing data from brokers. One says SPX closed at 2177.60, the other 2175.44. This is nuts!
Now I am going to have to wait for futures to make any kind of trading plan for tomorrow. What is wrong with these folk that they can’t get prices right??!!!
FWIW I have 2,175.44 from BarChart.
Thanks Lara! I really wanted to know if we close above 2176.00 or not….
Also StockCharts have the close at 2,175.44.
So we’ve closed below 2,176.
VIX poking above upper BB. UVXY not any where near it. If SPX climbs back toward 2180 we could have an interim bottom. We need to reclaim at least 2176 by the close.
While we have the hourly wave count invalidated, for the last few days movement we still have a higher high and a higher low. Price still hasn’t made a new low below 2,168.50.
Not yet.
That triangle yesterday was really hard to figure, and I had it wrong. It wasn’t a Y wave, it was a B wave. Which is a more common structure for a B wave than a Y wave.
Minute ii continuing as an expanded flat, now probably over.
The 4hr chart is very obvious for this assignment,
Correction: I meant to say today’s finish could be the ending of minor 2.
It seems to me we have an increased likelihood of the alternate wave count unfolding. Nothing about price action the last several days said anything but “bearish” imho. If that is correct, futures will tank overnight, and a minute or two after the open will be the best time to enter short trades for what should be an easy intra-day double.
Price needs to make a new low below 2,147.58 before that’s indicated, or even increases in probability.
There are other alternates such as minor 2 continuing, which are more likely.
There still isn’t much selling pressure around.
I hope we do get a move up. I can buy back those covered VIX calls and add to my SPY 220 calls in that case. We did get a nice move off this afternoon’s lows. Have a great evening everyone!
The earliest indication of more downwards movement would be a new low below 2,168.50. Then we would have a lower low.
(Where do we go from here?) I wanna know!
(Please, tell me where do we go from here?)
Where do we go now?
… TT
Nobody knows Joe, and to be honest I really don’t care much. I am trying to just trade what I see. I never could get myself to buy into the bullish case completely because it defies too many countervailing arguments, but I was willing to take advantage of any upside moves, temporary though they were. I am still holding SPY 220 calls just in case…break of 2176 is bearish…bots can’t seem to hold it…so far…
Stop and think a while before you leave and say goodbye … TT
Selling next week expiration 218 SPY puts for 1.95 per contract. Buying equal number of 216.50 puts to maintain strangle. Filled at 1.45
it’s a sad day, when I can’t bring myself to pull the trigger in any direction. I have been whipped sawed so many times recently, that moves that i would have never hesitated shorting in the past, I don’t. Typically I would have already been short. Today, all I can do is sip on my coffee and watch. I need the market to prove to me we are trading again, and no magical bid will come out of nowhere and squeeze us shorts.
Most traders need to stay out of this market. Buying anything under these conditions will loose you money 90% of the time. This is a “dead money” market and you need a very precise and aggressive trading approach to avoid getting skunked. I would wait for futures to give the directional “all clear”.
Hold back the night, turn on the lights
Don’t want to dream (dream about you baby) … TT
The Trammps….! 🙂
YES… Was waiting for somebody to pick up on that!
Yeah…we can only guess. I guess we may slink downwards towards yellens speech, then if the market looks like it is teetering she will probably choose her words very carefully after which we may have a rally to or close to new highs, afterwards investors will start to see the empuror has no cloths which will be followed by an end of the month rally, which will be followed by a wyle coyote moment, which will cause heavy selling which will be followed by fed speak stating that they have plenty of tools at their disposal, which will cause a small ppt backed rally into the election which will be followed by another scary pullback which will be followed by a Santa claus rally which will be followed by a 2017 bear market, heavy selling in January.
Are you kidding me? Of course she is going to spout some drivel about a hike not being a foregone conclusion and how they will be waiting for more data before making any decision. I’ll tell you one thing; I will be shorting the hell out of any pop resulting from that hogwash….especially if we get more downward movement tomorrow 🙂
metals (gold,silver etc) selling off sharply. Metal stock as well. Talking about rate rise. All eyes on Friday aunty Yellen speech.
For the sake of the real economy, I would hope that Grandma Yellen finally raises rates…too much jawboning from these central banks…
Ignore Yellen and all the other central bank liars. They are irrelevant. Traders responding to their meaningless drivel are just giving great set-ups for trades based on reality, not FEDSPEAK.
Russell,
I think we get minimum 1 rate hike this year and possible 2
Ha! Ha! Ha! Ha! Hee! Hee! Hee! Hee! Huyk! Hyuk! Huyk! Hyuk!
But seriously. I would absolutely love it if they did that as it would ensure this ridiculous charade would come to a screeching halt and true price discovery would come back to the market…..sadly, a’int gonna happen…. 🙂
Looks like the trading bots will continue to play tag with one another until yammering Yellen gives her Jackson Hole spiel. Not much to see until then it would appear. Until tomorrow! 🙂
If we do not get a reversal soon, it is starting to look to me like we have a breakdown, albeit in slow motion, in progress….
A number of traders are noticing delayed fills even on market orders. This is not a good omen. It indicates awful liquidity in the markets. It may not be a bad idea to tighten stops on positions. Even with tighter stops, gaps past them makes the stop essentially useless and this market is acting like it could do just that. Be sure to hedge!
As expected, bots buying SPX 2180. If the bears are going to sell, the next move down will take out SPX 2176 on high volume….that means a bit fat red candle….
If the algos don’t step in and buy at 2180.00 fingers should hover over the short button. If SPX breaks 2176 on high volume I am punching it! We may have a wave two of an ED underway. 🙂
Filled at 1.00. Will maintain SPY 218.50/220.00 strangle until lemmings start to run around screaming with hair on fire over the Yellen non-event. 🙂
Ooops! Strangle actually 218/220
Buying next week’s expiration SPY 220 strike calls for limit price of 1.00 but no fill yet.
The algos are buying at SPX 2176 and VIX at top of very compressed BBs. No expansion so far means this move down probably still corrective.
Selling September 21 VIX 12.00 covered calls on remaining half of VIX long position for 2.80 per contract. Current cost basis for long position 9.15 per share so quite happy to be called away at 12.00 and 13.00 in three weeks.
Selling SPY 18.50 puts. Rolling half in to next week’s expiration at 18.00 strike. Break even on trade with next week’s position courtesy of the house….STC at 2.00; hard stop at 1.00 bid.
Selling September 21 VIX covered calls @2.05 per contract, on half VIX long position.
VIX 13 strike…
Here we are … low level of implied volatility, political and economic environment, low price of insurance, limited downside of the VIX, massive net short VIX positions = downside risk?
Lara,
Is there any possibility that what you have labelled as Intermediate 1 of Primary 3 was actually all of Primary 3, and the sideways movement since then is actually Primary 4. It looks like it would have to be some sort of expanded flat (or combination, with an X wave making a new high, and I can’t remember if the the rules allow that).
It just seems that momentum has been so week.
Thanks,
Peter
Oh yes! That is possible. Will chart and publish.
Thank you very much Peter for the idea. I had not thought of that.
There is no rule stating a limit for an X wave. I think of them as rather like B waves within flats, because combinations and flats are very similar.
There are guidelines stating how long B waves within flats may be, and they may be longer than A waves. So it makes sense to allow for X waves to make new price extremes beyond W.
So yes, it fits.
The only problem I can see would be the end of the X wave. Wave C of it looks like a three.
Lara,
I am not sure where you would label wave C of X, but can the X wave itself be a combination (W-X-Y), with the C wave actually being a 3 wave Y?
Thanks,
Peter
Yes, X waves can be any corrective structure, including a combination.
I’ve charted it and actually it doesn’t have the problem I initially thought it did. The X wave fits quite well as a zigzag.
The whole thing fits neatly as an incomplete double flat: expanded flat – X – regular flat. Nice alternation there between an expanded and a regular flat.
Primary 3 would be very close to 0.618 X primary 1.
Now I’ve charted it and looked more closely at the idea, I like it very much. It has a really nice fit; good alternation all around and a nice Fibonacci ratio.
It explains quite a lot.
Thank you very much for the suggestion Peter. This will be our new alternate. It looks better at this stage than the current alternate.
Your welcome. To be honest, I have just been kind of staring at the daily chart and thinking that I could see three clear waves and a sideways pattern that has been stretching out for a while. I started wondering if that could be a fourth wave, but I had a really hard time figuring out the structure. I am looking forward to seeing tonight’s analysis.
Thank you again for being so responsive. These are really tricky times, and it is great having your analysis as a resource.
First again? I’m on fire!!
Where IS that doc?
Burn Baby… Burn – TT
Doc’s AWOL.
He’s needed to resuscitate Mr Market. Mr Market is almost dead.
Probably just playing ‘possum…! 🙂