
Upwards movement was expected for Monday, which is what happened.
Summary: The trend remains the same, until proven otherwise. Assume the trend is up while price is above 2,172. The mid term targets are 2,332 or 2,445. If price makes a new low below 2,147.58, then probability will shift to a deep pullback beginning, target zone 1,941 to 1,883. At this stage, a deeper pullback looks very unlikely. There is not enough selling pressure which would be required to push price lower.
Last monthly chart for the main wave count is here.
New updates to this analysis are in bold.
MAIN WAVE COUNT
WEEKLY CHART
Click chart to enlarge.
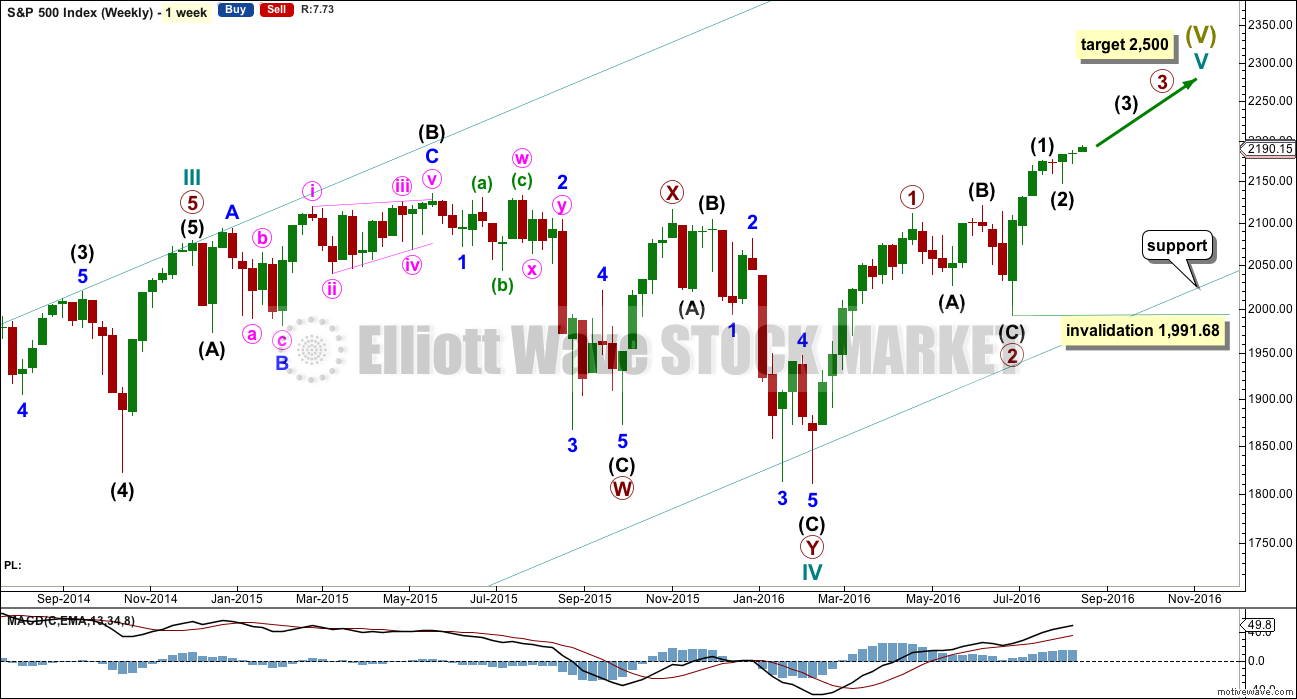
Cycle wave II was a shallow 0.41 zigzag lasting three months. Cycle wave IV is seen as a more shallow 0.28 double combination lasting 15 months. With cycle wave IV five times the duration of cycle wave II, it should be over there.
Cycle wave I lasted 28 months (not a Fibonacci number), cycle wave II lasted a Fibonacci 3 months, cycle wave III lasted 38 months (not a Fibonacci number), and cycle wave IV lasted 15 months (two more than a Fibonacci 13).
If the target for cycle wave V is for it to be equal in length with cycle wave I, then it may also be expected to be about equal in duration. So far cycle wave V is in its sixth month. After this month, a further 22 months to total 28 seems a reasonable expectation, or possibly a further 15 months to total a Fibonacci 21.
This first weekly wave count expects the more common structure of an impulse is unfolding for cycle wave V. Within cycle wave V, primary waves 1 and now 2 should be over. Within primary wave 3, no second wave correction may move beyond its start below 1,991.68. If price makes a new high above 2,203.68, then that would provide enough confidence that intermediate wave (2) should be over to move the invalidation point on the weekly chart up to 2,147.58.
There is one other possible structure for cycle wave V, an ending diagonal. This is covered in an alternate.
DAILY CHART
Click chart to enlarge.
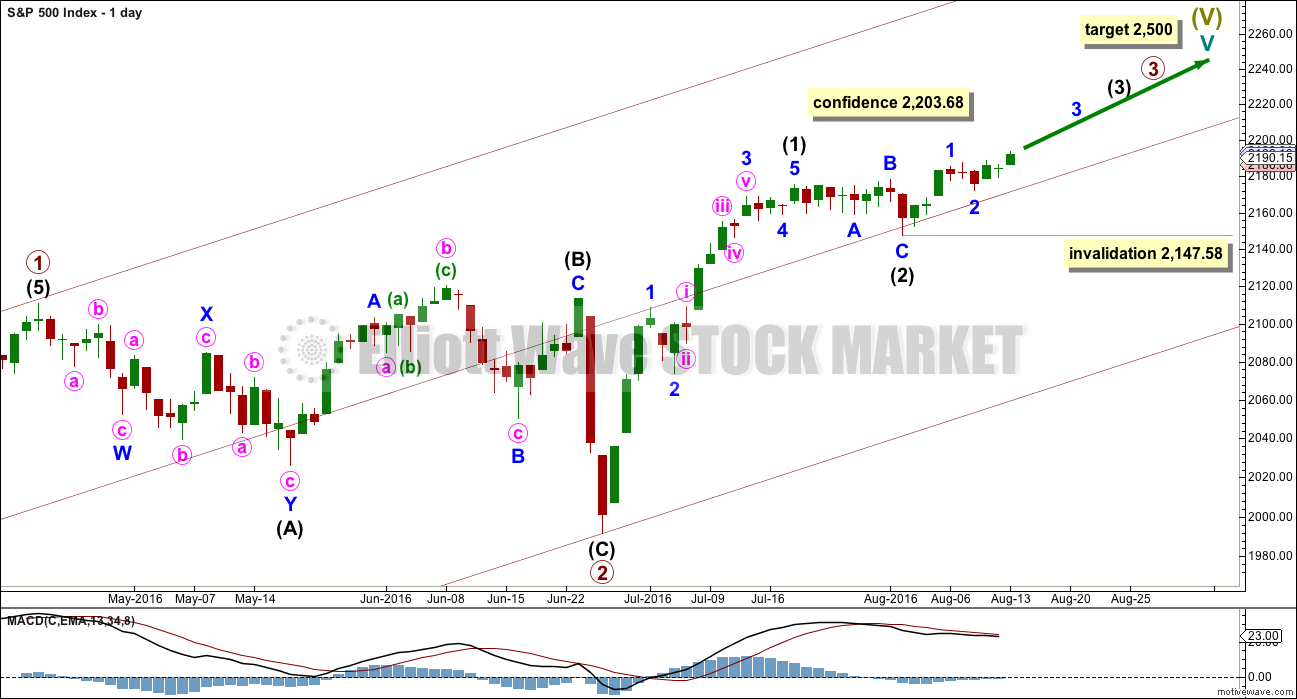
Primary wave 2 is complete as a shallow regular flat correction. Primary wave 3 is underway.
Within primary wave 3, intermediate wave (1) is a complete impulse. Intermediate wave (2) may now be a complete flat correction.
It is still possible that intermediate wave (2) may not be complete and could continue sideways and a little lower. A deep pullback would not be expected, only a sideways combination, double flat or slightly lower expanded flat would be indicated. If price moves above 2,203.68, then upwards movement would be more than twice the length of intermediate wave (2). At that stage, the probability that upwards movement is a B wave within intermediate wave (2) would be so low the idea should be discarded. A new high above 2,203.68 would add confidence in the upwards trend.
Within intermediate wave (3), no second wave correction may move beyond its start below 2,147.58.
Add a mid line to the base channel drawn about primary waves 1 and 2. Draw this channel from the start of primary wave 1 (seen on the weekly chart) to the end of primary wave 2, then place a parallel copy on the end of primary wave 1. The mid line may provide some support along the way up.
At this stage, it looks most likely that intermediate wave (3) has begun. It should be expected to show the subdivisions of minor waves 2 and 4 clearly on the daily chart with one to a few red daily candlesticks or doji. With minor wave 2 now showing as two red candlesticks and one doji, this wave count so far has a typical look.
HOURLY CHART
Click chart to enlarge.
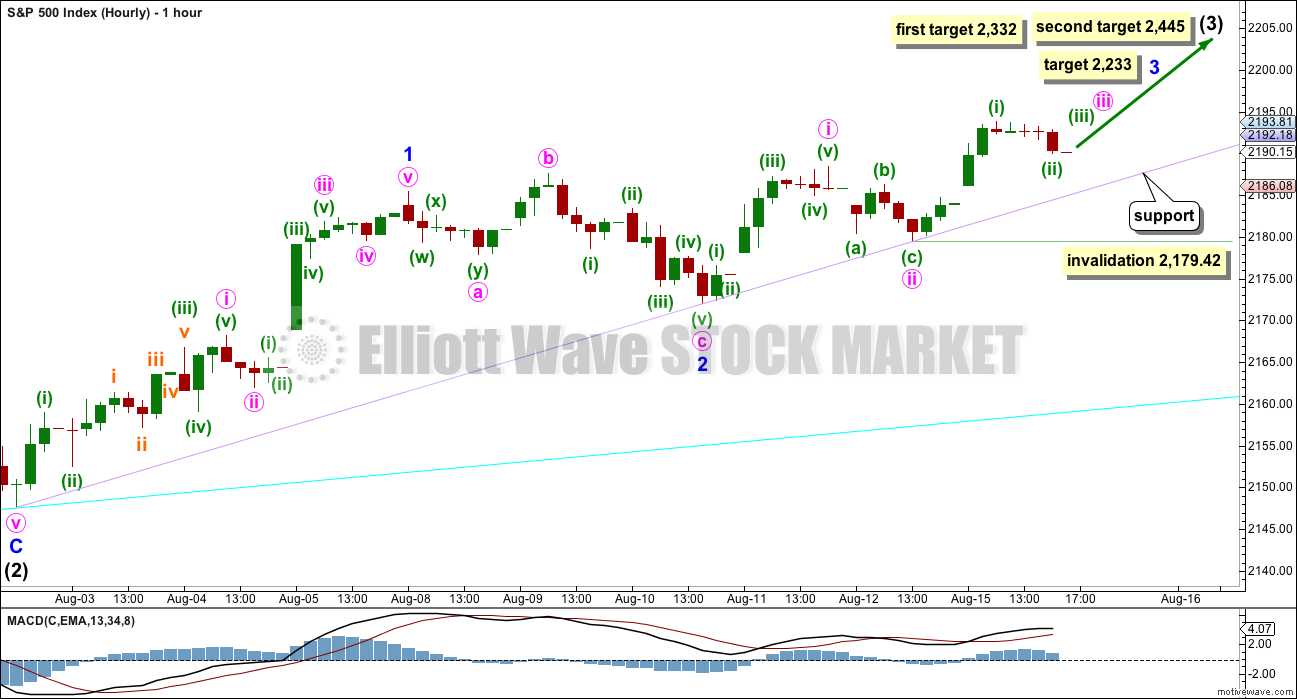
Minor waves 1 and 2 now look very likely to be complete. Minor wave 3 may have begun.
At 2,233 minor wave 3 would reach 1.618 the length of minor wave 1.
Mid term targets for intermediate wave (3) remain the same. At 2,332 intermediate wave (3) would reach equality in length with intermediate wave (1). If price keeps rising through this first target, or if when it gets there the structure is incomplete, then the second target would be used. At 2,445 intermediate wave (3) would reach 1.618 the length of intermediate wave (1).
The cyan support line is drawn from the start of intermediate wave (1) to the end of intermediate wave (2). The lilac support line is drawn from the end of intermediate wave (2) to the end of minor wave 2. The lilac line provided good support on Friday. This line is slightly strengthened now and should continue to provide support.
The high for Monday could possibly be minute wave iii complete. But if so, it would be shorter than minute wave i. If minute wave iii is complete, then minute wave iv may not move into minute wave i price territory below 2,188.45.
What looks more likely is another first and second wave is complete today. If minuette wave (ii) moves any lower, it should find strong support at the lilac trend line. Minuette wave (ii) may not move beyond the start of minuette wave (i) below 2,179.42.
This wave count now expects to see an increase in upwards momentum beyond that seen for minor wave 1. Upwards movement should also have some support from volume.
ALTERNATE WAVE COUNT
WEEKLY CHART
Click chart to enlarge.
This alternate may again diverge from the main wave count, so it will again be published.
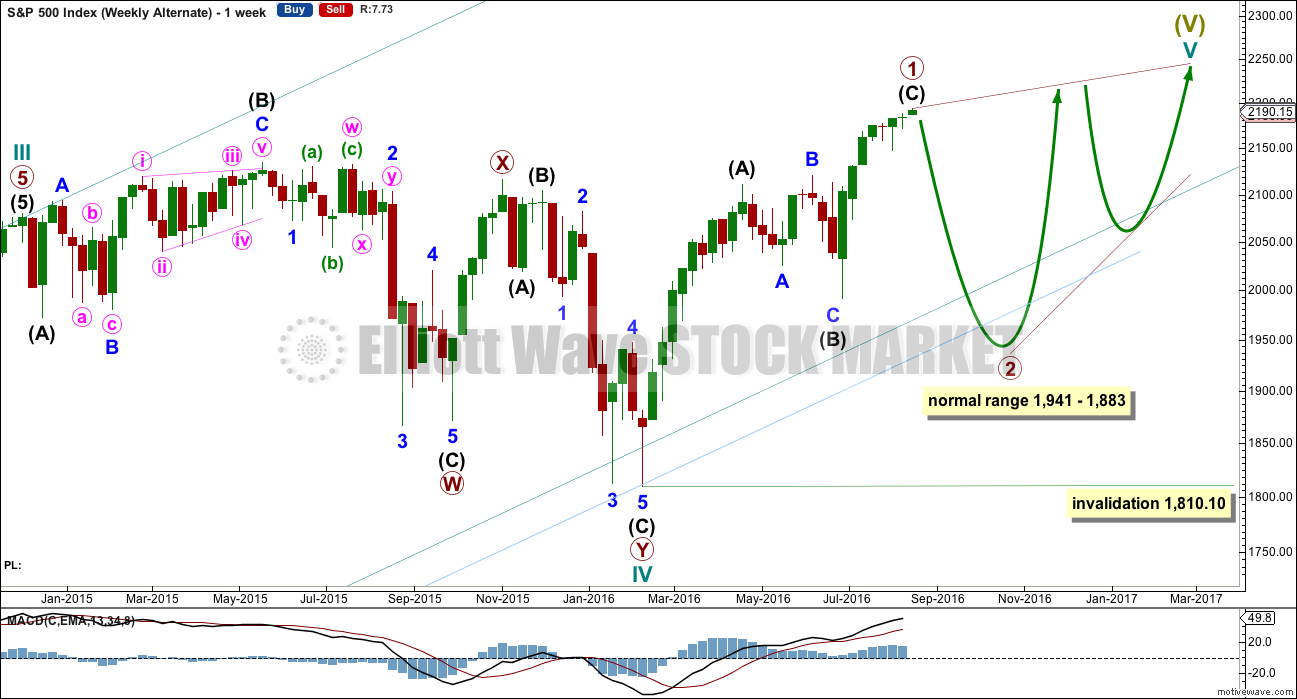
The other structural possibility for cycle wave V is an ending diagonal. Ending diagonals are more often contracting than expanding, so that is what this alternate will expect.
Ending diagonals require all sub-waves to subdivide as zigzags. Zigzags subdivide 5-3-5. Thus primary wave 1 may now be a complete (or almost complete) zigzag, labelled intermediate waves (A)-(B)-(C) which subdivides 5-3-5.
The normal depth for second and fourth waves of diagonals is from 0.66 to 0.81 the prior actionary wave. Primary wave 2 may end within this range, from 1,941 to 1,883.
Primary wave 2 may not move beyond the start of primary wave 1 below 1,810.10.
When primary wave 2 is a complete zigzag, then another zigzag upwards for primary wave 3 must make a new high above the end of primary wave 1. It would most likely be shorter than primary wave 1 as diagonals are more commonly contracting. If primary wave 3 is longer than primary wave 1, then an expanding diagonal would be indicated.
The psychology of diagonals is quite different to impulses. Diagonals contain corrective characteristics and subdivide as a series of zigzags. When diagonals turn up in fifth wave positions, they take on some of the properties of the correction which inevitably follows them. The deterioration in fundamentals and underlying technicals is more extreme and more evident. There is some support for this idea at this time.
The final target of 2,500 would not be able to be reached by an ending contracting diagonal. The final target for this alternate would be calculated only when primary wave 4 is complete.
The classic pattern equivalent is a rising wedge.
DAILY CHART
Click chart to enlarge.
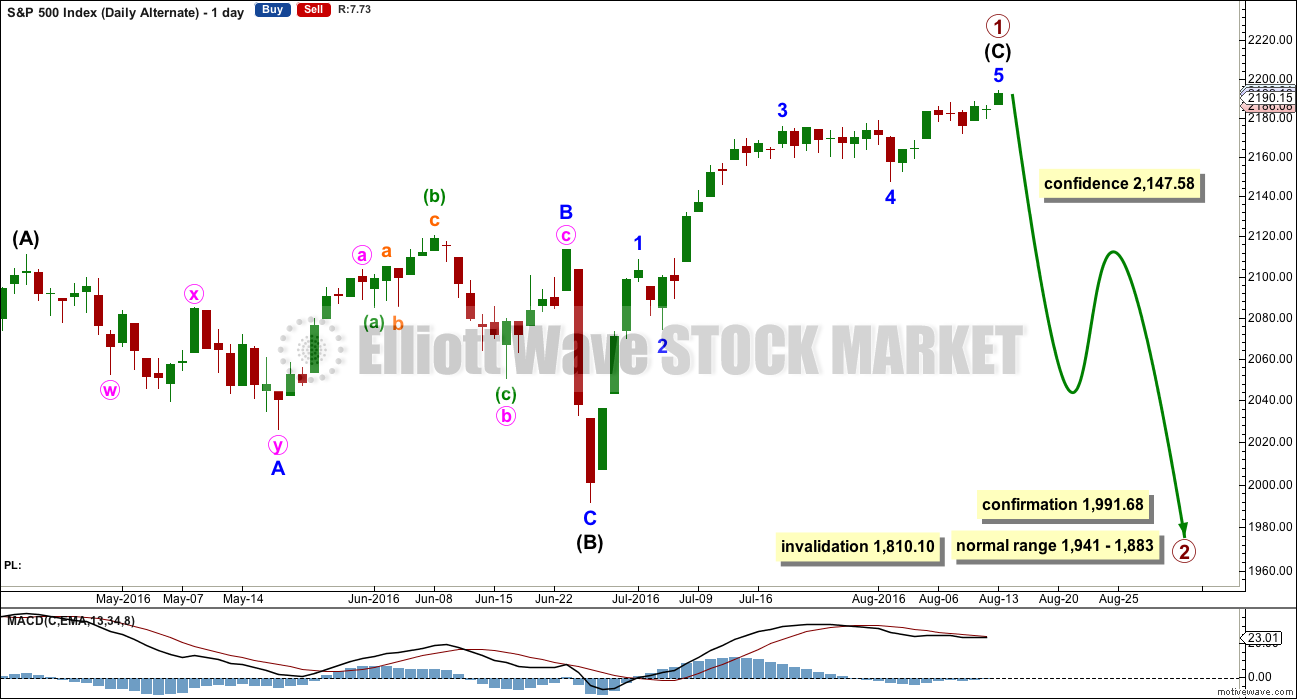
It is possible now that intermediate wave (C) is a complete five wave impulse. However, this wave count suffers from disproportion between minor waves 2 and 4 which gives this possible impulse an odd look. It looks like a three where it should look like a five. However, the S&P just does not always have waves which look right at all time frames.
Because this wave count expects to see a substantial trend change here from bull to bear for a multi week deep pullback, it absolutely requires some indication from price before confidence may be had in it. A new low below 2,147.58 would add confidence.
At this stage, there is not enough selling pressure to support this wave count. When the market has fallen recently, it has fallen of its own weight. For a deep pullback sellers would have to enter the market and be active enough to push price lower. That is not happening at this time.
TECHNICAL ANALYSIS
WEEKLY CHART
Click chart to enlarge. Chart courtesy of StockCharts.com.
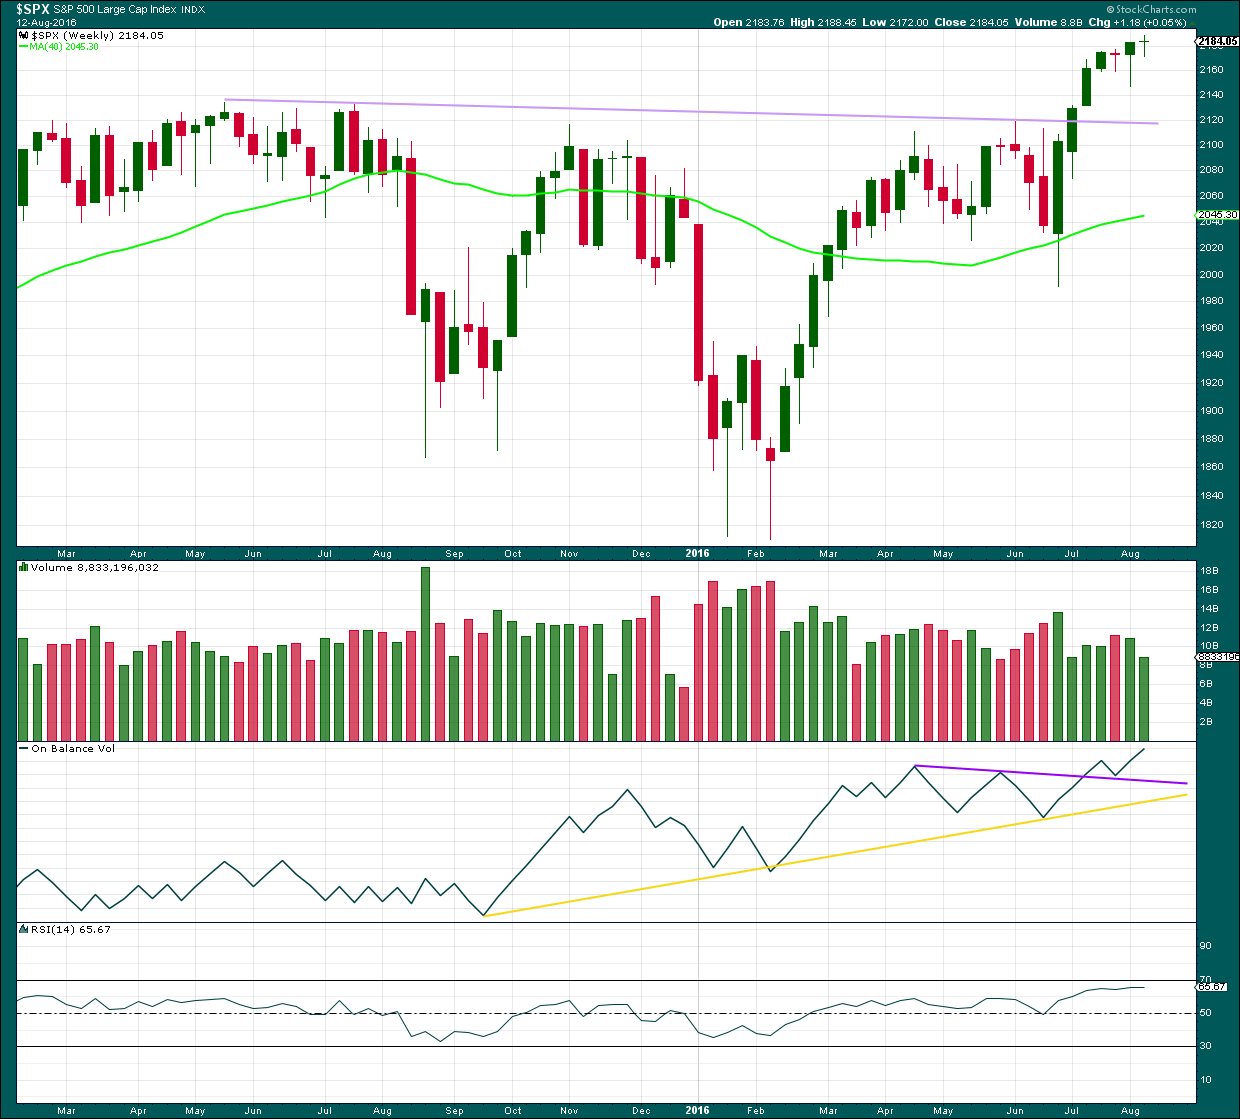
Last week ends with a small green doji candlestick. The week before completed a possible hanging man, but the green real body and the long lower wick (bullish) require bearish confirmation from the next candlestick before the pattern can be read as a bearish reversal pattern. That has not happened, so both weekly candlesticks should now be read as bullish.
Last weekly candlestick comes with lighter volume. A decline in volume along with a doji candlestick indicates that price movement for the week may have been more consolidation than trend.
On Balance Volume is bullish while it remains above both trend lines. There is no divergence between price and OBV last week to indicate any weakness in price, both made new highs.
RSI is flat and not extreme. There is room for price to rise further.
DAILY CHART
Click chart to enlarge. Chart courtesy of StockCharts.com.
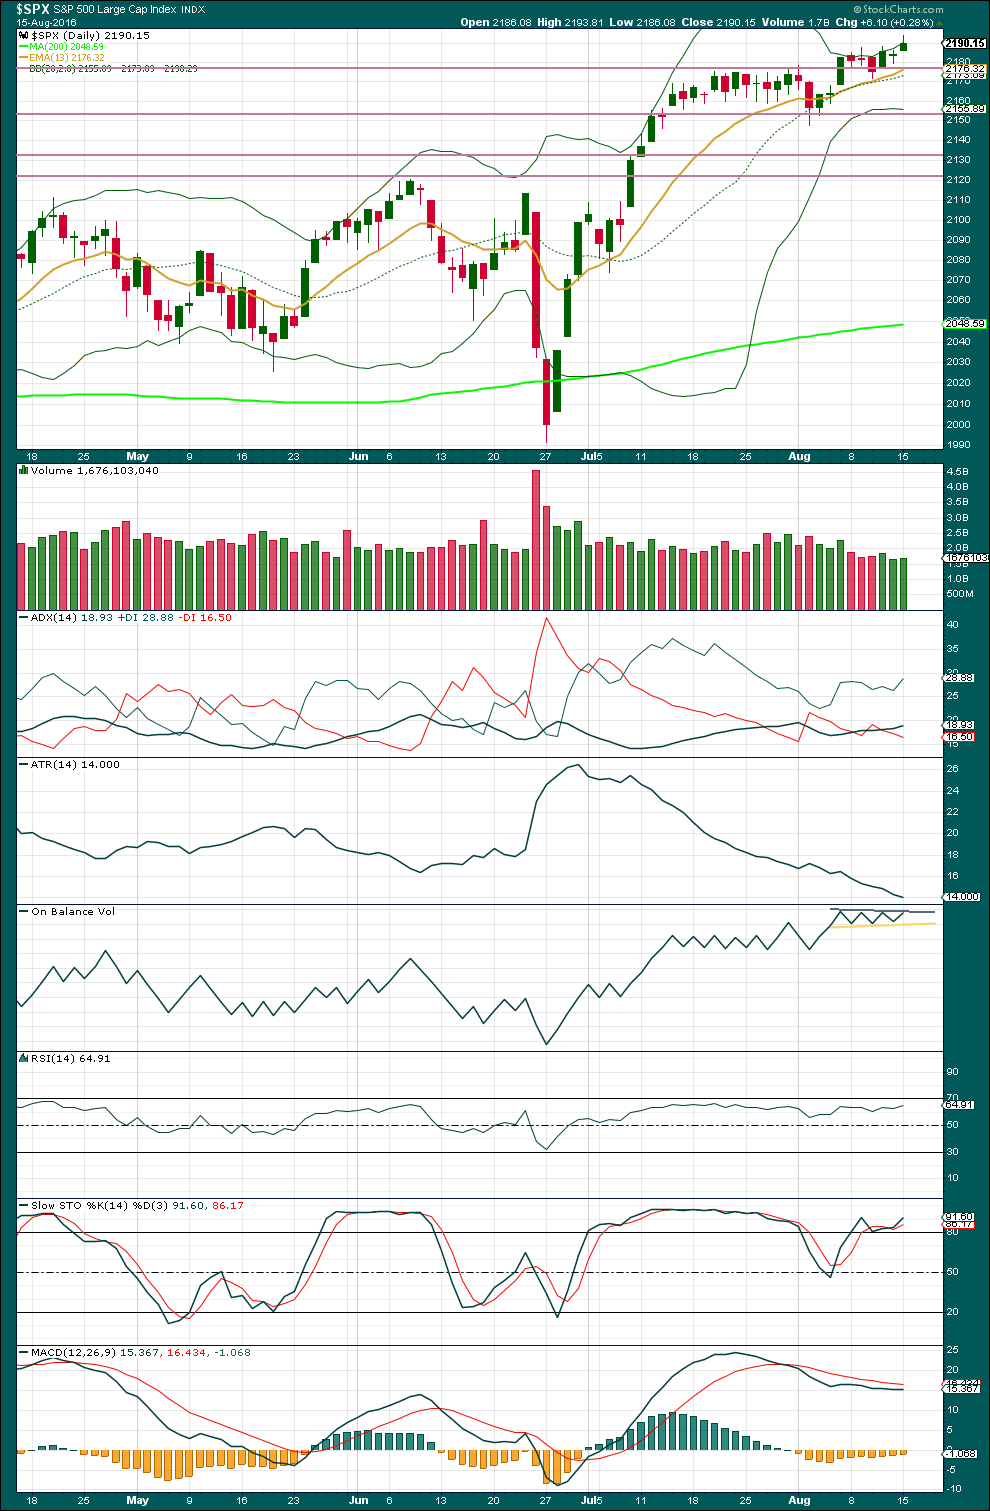
A small green daily candlestick shows some increase in volume which at the daily chart level would support the upwards trend. However, looking inside this daily candlestick upwards movement of the first two hours came with very light volume, although volume did increase as price moved higher. The last three hours of the session saw volume increase strongly as price moved lower, with strongest volume on the final hour of downwards movement. The volume profile short term is bearish.
The volume profile at the daily chart level looks bullish.
During this upwards trend, which began back on 27th of June, multi day rises in price come with some increase in volume. There were only two back to back decreases in price during this trend: the first saw an increase in volume and the second saw a decrease. Overall, the volume profile at the daily chart level looks more bullish than bearish.
Price has broken above resistance, which was about 2,175, and turned down there for a fairly typical throwback and is now moving up and away. Even though volume and other technicals are weak, price is still trending. The trend is still upwards.
Bollinger Bands are beginning to slightly widen. The trend may be ready to strengthen.
ADX still indicates there is an upwards trend. ATR still disagrees, and has been in disagreement since 30th June. There is something wrong still with this trend. A healthy sustainable trend should come on increasing range, not severely decreasing as this one is.
On Balance Volume today is finding some resistance at the upper grey trend line. It remains range bound between the grey and yellow lines. A break out would be a reasonable signal. OBV today exhibits divergence with price: price has made a new high today but OBV has not. The divergence is very slight: OBV is closer to level than declining here. This is a very weak bearish signal. Weak because divergence between price and OBV is not usually very reliable, and recently less so.
RSI is still not extreme. There is room for price to rise further.
Stochastics is overbought, but this oscillator may remain extreme for reasonable periods of time during a trending market. Normally, divergence is looked for between price and Stochastics to indicate weakness and an impending end to the trend, but that has not been working recently. It may begin to work again, so divergence is noted here but today is given no weight.
MACD also shows divergence with price but again is given no weight. MACD has not signaled a trend change from down to up, but here ATR would be a more reliable trending signal.
The 13 day moving average is about where corrections are finding some support during this upwards trend so far. Price recently bounced up from this and the mid line of the Bollinger Bands. This support may continue.
Price continues to slowly and weakly drift upwards. This seems to be due to a lack of resistance as new all time highs are made, and downwards movement is relatively shallow due to a lack of selling pressure. If this pattern continues, then the Elliott wave count may play out with one of the weakest third waves in history. This still makes sense though in the context of two large degree fifth waves.
VOLATILITY – INVERTED VIX CHART

Click chart to enlarge. Chart courtesy of StockCharts.com.
Volatility is declining as price is rising. This is normal for an upwards trend.
There are a few instances of multi day divergence between price and inverted VIX noted here. Bearish divergence is blue. Bullish divergence is yellow. Each of these instances was followed by expected price movement if only for two days. Divergence with VIX and price is not always working, but it is still sometimes working. So it will be noted.
There is currently still bearish divergence between price and inverted VIX from the high of 9th August to today’s high of 15th August. Price has made new highs, but inverted VIX has failed to make corresponding new highs. This indicates some weakness to price. It remains to be seen if this divergence will be followed by the expected downwards movement from price, even for one or two days, or if it will just disappear.
There is a single day divergence between price and inverted VIX today also. Price today overall moved upwards to complete a green daily candlestick, but inverted VIX moved overall downwards. Previously, this single day divergence has been used as a reliable indicator of direction for the following day but recently this signal has repeatedly failed to work as expected. It is noted here today but is given no weight in the analysis. It will be watched each time it appears, so that if it starts working again it may be used.
BREADTH – AD LINE
Click chart to enlarge. Chart courtesy of StockCharts.com.
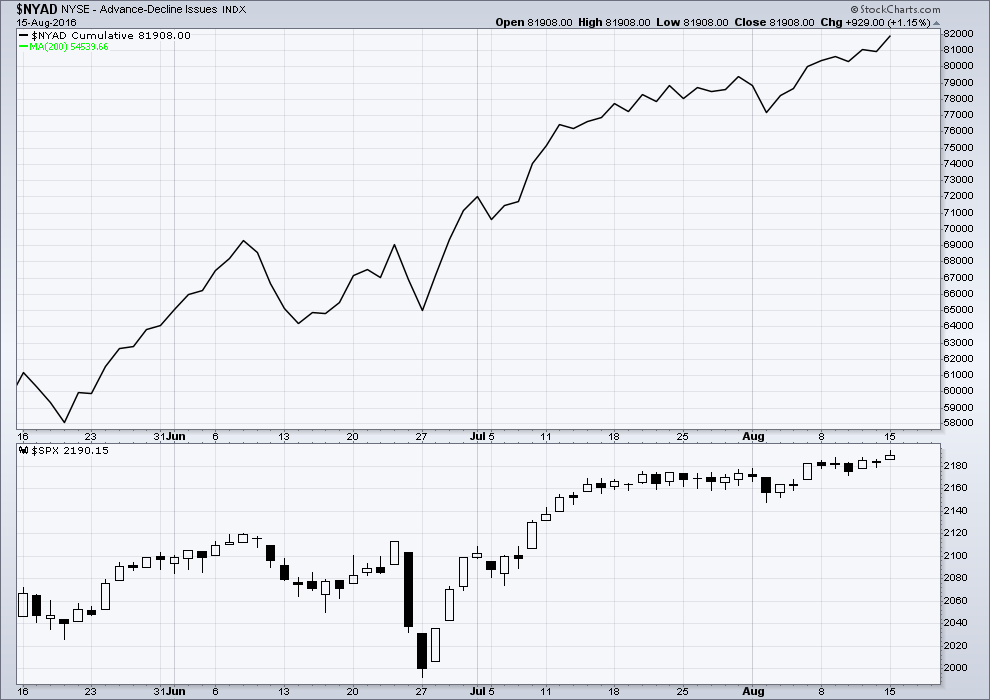
There is support from market breadth as price is rising. The AD line shows no divergence with price; it is making new highs with price.
DOW THEORY
Major lows within the prior bull market:
DJIA: 15,855.12 (15th October, 2014) – closed below on 25th August, 2015.
DJT: 7,700.49 (12th October, 2014) – closed below on 24th August, 2015.
S&P500: 1,821.61 (15th October, 2014) – has not closed below this point yet.
Nasdaq: 4,117.84 (15th October, 2014) – has not closed below this point yet.
Major highs within the new bear market:
DJIA: 17,977.85 (4th November, 2015) – closed above on 18th April, 2016.
DJT: 8,358.20 (20th November, 2015) – has not closed above this point yet.
S&P500: 2,116.48 (3rd November, 2015) – closed above this point on 8th June, 2016.
Nasdaq: 5,176.77 (2nd December, 2015) – closed above this point on 1st August, 2016.
Dow Theory Conclusion: Original Dow Theory still sees price in a bear market because the transportations have failed to confirm an end to that bear market. Modified Dow Theory (adding S&P and Nasdaq) has failed still to confirm an end to the old bull market, modified Dow Theory sees price still in a bull market.
This analysis is published @ 07:10 p.m. EST.
The upwards move from the low labelled minor 2 on the daily and hourly charts now looks like and fits best as a three.
Which indicates minor 2 is probably not over. Which means now minute C is unfolding down, must be a five, and is very likely to move below 2,172 to avoid a truncation.
Target 2,162 – 2,159
Lara,
Just curious if it is possible that we are already in Primary 4 (unfolding as an expanded flat). It looks like we have room to move down in a C wave until about 2120 or so (I can’t remember where Primary 1 ended).
The only reason I ask is that this whole move up has been so weak that it is hard to imagine it going on much longer.
Of course, if this were the case, Primary wave 3 was shorter than Primary 1, so Primary 5 would be limited.
Thanks,
Peter
I have a breach of 2179.42,, invalidation of main hourly?
yes 🙁
I’m going to have to take some time to figure out what’s happening here in EW terms… it’s not immediately obvious this morning.
Sorry folks, looks like I won’t be able to get a comment or chart up before todays close.
I could make a comment… but it wouldn’t be worth much at this stage. Time on the 5 min chart is needed.
This market has yet to make a move even remotely close what is suggested by the historic level of BB compression we have been seeing for several sessions now. Since it has failed to materialize, the only logical conclusion is that if it will it is yet in the future. The EW wave count calls for the strongest portion of a third wave up unfolding and my suspicion is that if we are going to see that unfold it will be indicated by a powerful run-up in overnight futures, especially after today’s move to the downside. Conversely, if the ED is in play I think we will also get confirmation not from intra-day action but from overnight futures. Bottom line is I’m waiting for Mr. Market to show his cards. Off early!
PPT bots buying the market at 2180.40 so let’s see if selling pressure comes to bear to take that level out. We had our second bounce off it today and if it holds we probably see a slow fade of today’s decline.
Yes Verne, directional trading has been very tough. I have become a a scalper because none of the moves with any real momentum.
Tough for us momo trend traders.
That is the only approach that makes any sense; unless one is willing to throw capital at the MMs. I do think a long trade wold be signaled with a close of this morning’s opening gap down but even then I would be reluctant to hold it overnight. If this occurs, it should be strong enough to take a decent scalp into the close. Although we did not get to 13.00, took some profits on my VIX positions today and will look to buy back with another move below 12.00
PPT has killed this market. No volume, no real moves, makes me want to take a few weeks/months off quite frankly.
Well… There they go again… Fed Dudley is sooo FULL of Crap!
But the DUMB A_s Market will believe any garbage these people spew!
I suspect the domestic market is not buying the bilge. Bloomberg has reported that most of the inflows are coming from foreign buyers. It reminds me of how the Japanese sunk tens of billions into US real estate at the top of the market back in the late eighties. I know a lot of the investing crowd are lemmings (EWT calls it the herding instinct) but please…some of the neurons in even lemming brains have got to still be firing no? Or am I completely wrong about that??!! 🙂
The MMs continue to hammer traders with market whipsaws. Any trader going long yesterday and not taking profits intra-day is underwater this morning, once again confirming the hazards of directional trades in this market. It is also noteworthy that the gap up open from yesterday has now been filled by the gap down today. Let’s see where this goes. A break of VIX 13 will mean time to sell 1/4 of long position and move to options for leverage….a big fat green candle with a close at or near the day’s high means it’s time to sell half…
“Any trader going long yesterday and not taking profits intra-day is underwater this morning”
Yep. That would be me 🙁
It would appear that the banksters do not want anyone making conclusions about systemic risk based on the Gold price. In response to this morning’s strong push higher, a huge number of contracts were sold in the last hour in an attempt to dampen buying enthusiasm. That suggests to me that what the Gold price does today will be even more critical than I previously thought. Fascinating!
Good morning all.
The SPX monthly MACD has made a bullish crossover. This is one, but only one, piece of evidence the market is in a bullish phase supporting the main EW count.
Have a great day.
Keep an eye on the price of Gold. What it does next could give some indication of how close we are to a market reversal. Seeking Alpha makes an interesting observation about the Gold/Oil ratio and systemic risk, the latter being elevated when the former departs significantly from the mean. The ratio simply tells the number of barrels of oil that can be bought with an ounce of gold. Think of it as an unconventional sentiment indicator, and in that sense it should show some correlation with VIX, and in fact usually does. Here is what is most interesting; there is currently notable divergence between the Gold/Oil ratio and the VIX, with the latter at the lowest levels seen for some time. If Gold continues to climb, that divergence becomes more pronounced (as well as the message of systemic risk) if VIX remains muted. Bottom line?
A fall in the Gold price may actually strengthen the near term bullish case for equities. A strong move up, regardless of what VIX does in the short term, could signal a time for caution.
Joseph takes the gold medal,, I take the silver,, whos gonna get the bronze?
i might as well then…
Shorts Throw In The Towel: S&P Short Interest Tumbles To Three Year Lows
Seems to me like there is a good joke regarding covering, shorts, and towels somewhere in that statement! 🙂