
Upwards movement was expected for Friday.
A green candlestick was printed, but it was a small doji and did not make a new high. Price moved sideways.
Summary: The trend remains the same, until proven otherwise. Assume the trend is up while price is above 2,172. The mid term targets are 2,332 or 2,445. If price makes a new low below 2,147.58, then probability will shift to a deep pullback beginning, target zone 1,939 to 1,884.
Last monthly chart for the main wave count is here.
New updates to this analysis are in bold.
MAIN WAVE COUNT
WEEKLY CHART
Click chart to enlarge.
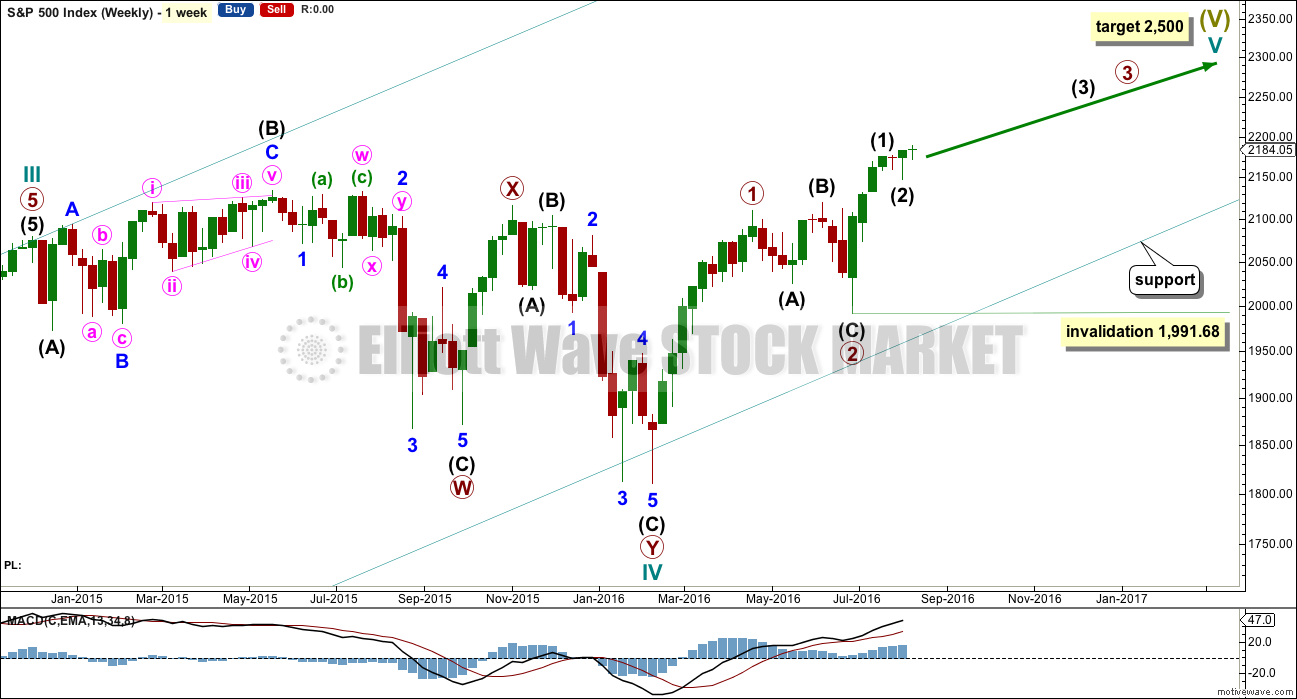
Cycle wave II was a shallow 0.41 zigzag lasting three months. Cycle wave IV is seen as a more shallow 0.28 double combination lasting 15 months. With cycle wave IV five times the duration of cycle wave II, it should be over there.
Cycle wave I lasted 28 months (not a Fibonacci number), cycle wave II lasted a Fibonacci 3 months, cycle wave III lasted 38 months (not a Fibonacci number), and cycle wave IV lasted 15 months (two more than a Fibonacci 13).
If the target for cycle wave V is for it to be equal in length with cycle wave I, then it may also be expected to be about equal in duration. So far cycle wave V is in its sixth month. After this month, a further 22 months to total 28 seems a reasonable expectation, or possibly a further 15 months to total a Fibonacci 21.
This first weekly wave count expects the more common structure of an impulse is unfolding for cycle wave V. Within cycle wave V, primary waves 1 and now 2 should be over. Within primary wave 3, no second wave correction may move beyond its start below 1,991.68.
There is one other possible structure for cycle wave V, an ending diagonal. This is covered in an alternate.
DAILY CHART
Click chart to enlarge.
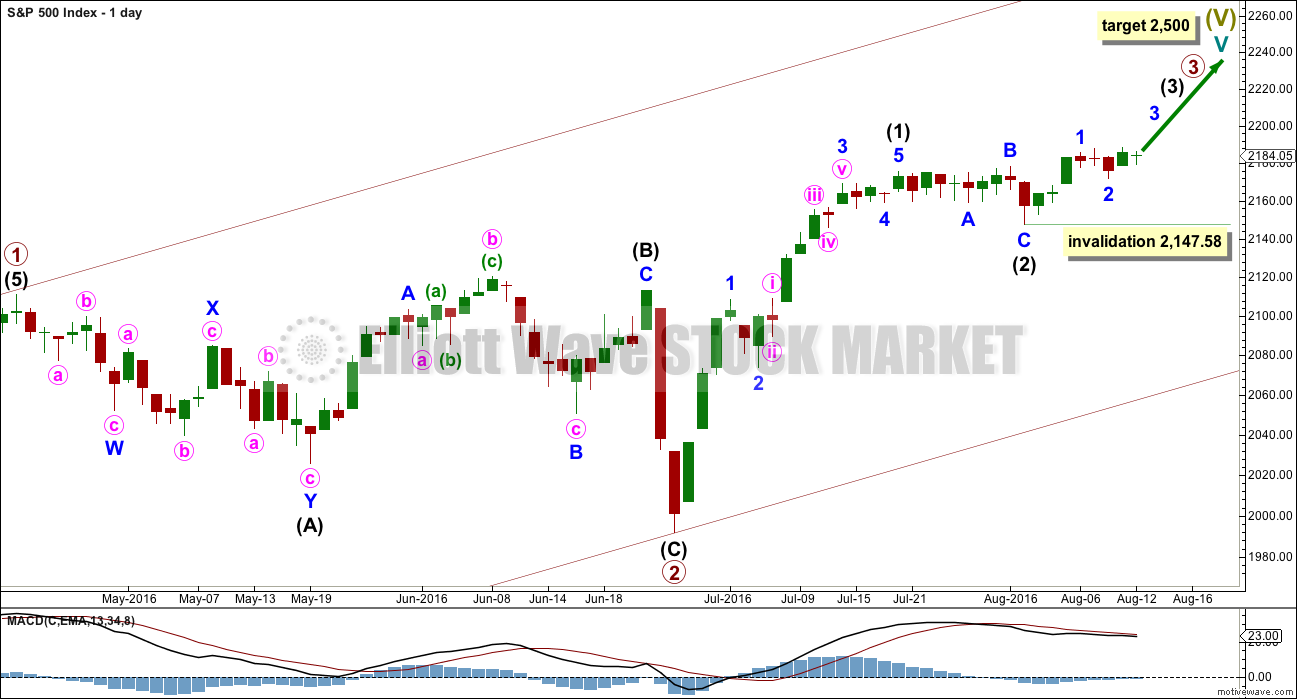
Primary wave 2 is complete as a shallow regular flat correction. Primary wave 3 is underway.
Within primary wave 3, intermediate wave (1) is a complete impulse. Intermediate wave (2) may now be a complete flat correction.
If the degree of labelling within intermediate wave (2) is moved down one degree (alternate labelling), then it is still possible that only minor wave A is complete as a flat correction. It is possible that intermediate wave (2) may complete further sideways as a longer lasting flat correction, or a double flat or double combination. All options would expect sideways movement though, not a deep pullback.
Within a possible continuation of intermediate wave (2), there is no upper invalidation point for the idea because there is no rule stating a limit for a B wave within a flat. There is a convention within Elliott wave that states once the possible B wave is longer than twice the length of the A wave the probability that a flat is unfolding is so low the idea should be discarded. Here that price point would be at 2,203.68.
Above 2,203.68 more confidence in this wave count and the targets may be had.
Intermediate wave (2) may not move beyond the start of intermediate wave (1) below 1,991.68.
At this stage, it looks most likely that intermediate wave (3) has begun. It should be expected to show the subdivisions of minor waves 2 and 4 clearly on the daily chart with one to a few red daily candlesticks or doji. With minor wave 2 now showing as two red candlesticks and one doji, this wave count so far has a typical look.
HOURLY CHART
Click chart to enlarge.
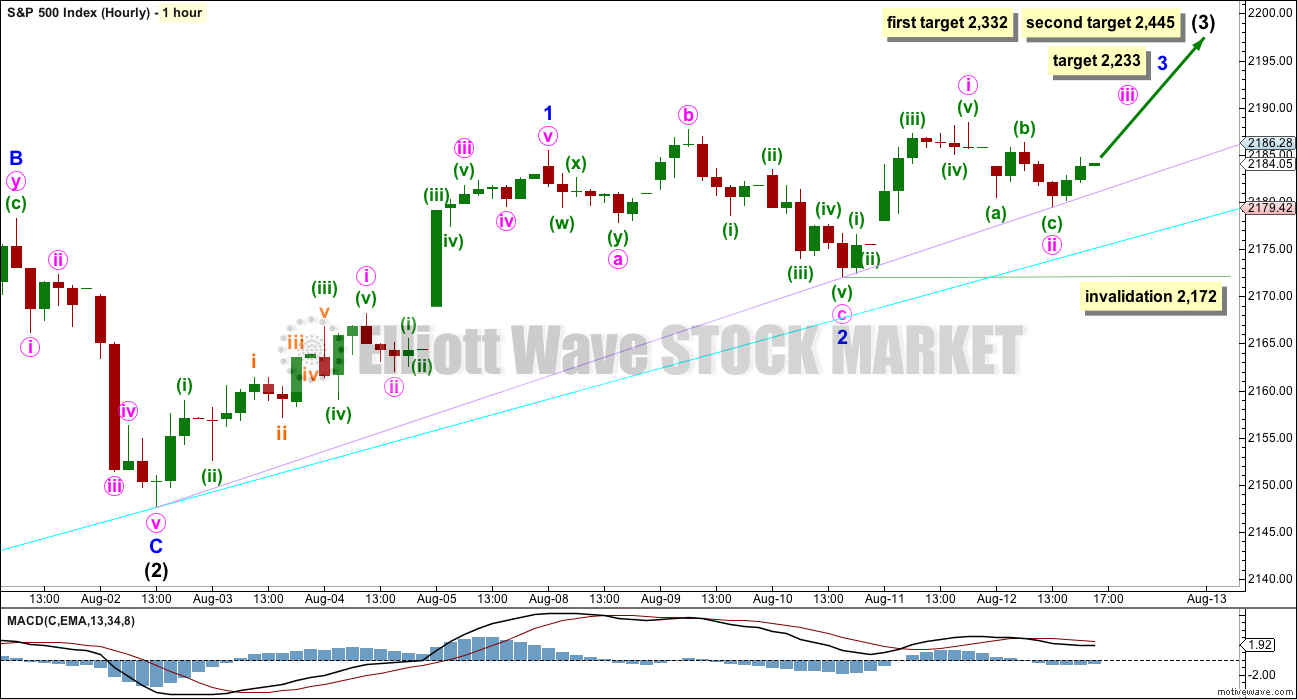
Minor waves 1 and 2 now look very likely to be complete. Minor wave 3 may have begun on Thursday’s session.
At 2,233 minor wave 3 would reach 1.618 the length of minor wave 1.
Mid term targets for intermediate wave (3) remain the same. At 2,332 intermediate wave (3) would reach equality in length with intermediate wave (1). If price keeps rising through this first target, or if when it gets there the structure is incomplete, then the second target would be used. At 2,445 intermediate wave (3) would reach 1.618 the length of intermediate wave (1).
The cyan support line is drawn from the start of intermediate wave (1) to the end of intermediate wave (2). The lilac support line is drawn from the end of intermediate wave (2) to the end of minor wave 2. The lilac line provided good support on Friday. This line is slightly strengthened now and should continue to provide support.
Minute wave ii moved lower on Friday and now fits as a zigzag. Minute wave i still fits reasonably well as an impulse, and looks like an impulse on the hourly chart.
If minute wave ii continues, it may not move beyond the start of minute wave i below 2,172.
ALTERNATE WAVE COUNT
WEEKLY CHART
Click chart to enlarge.
This alternate may again diverge from the main wave count, so it will again be published.
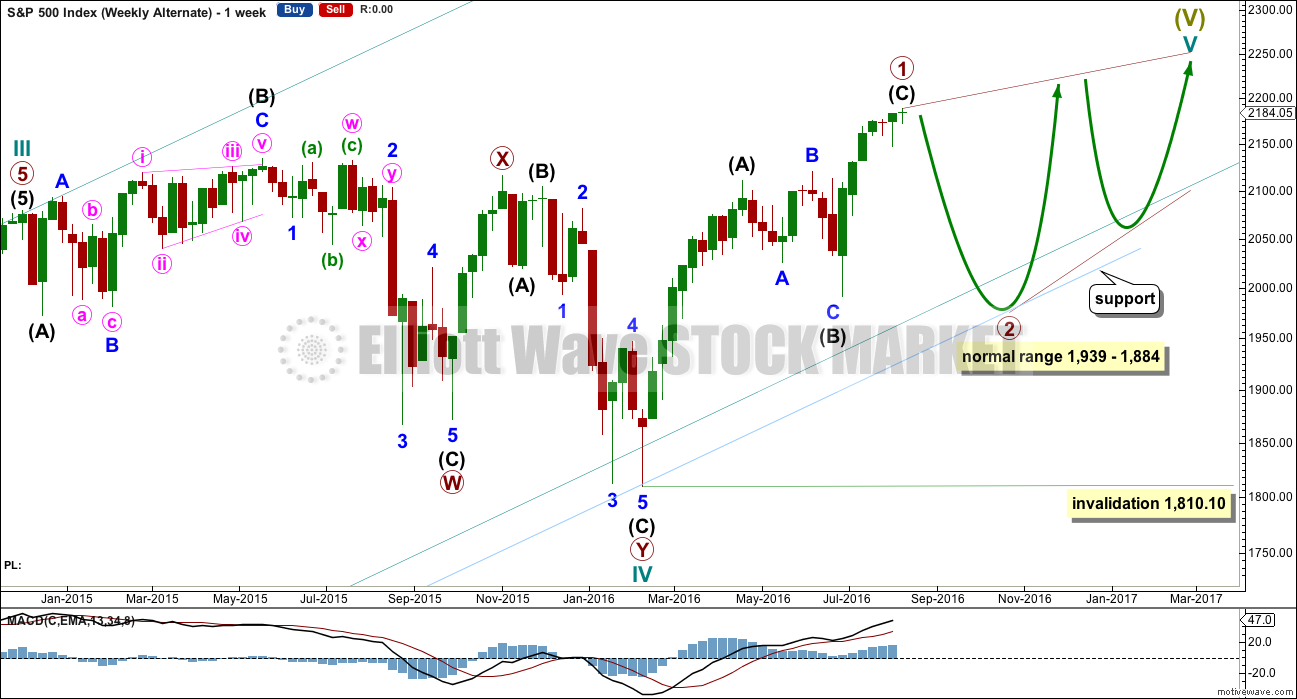
The other structural possibility for cycle wave V is an ending diagonal. Ending diagonals are more often contracting than expanding, so that is what this alternate will expect.
Ending diagonals require all sub-waves to subdivide as zigzags. Zigzags subdivide 5-3-5. Thus primary wave 1 may now be a complete (or almost complete) zigzag, labelled intermediate waves (A)-(B)-(C) which subdivides 5-3-5.
The normal depth for second and fourth waves of diagonals is from 0.66 to 0.81 the prior actionary wave. Primary wave 2 may end within this range, from 1,938 to 1,881.
Primary wave 2 may not move beyond the start of primary wave 1 below 1,810.10.
When primary wave 2 is a complete zigzag, then another zigzag upwards for primary wave 3 must make a new high above the end of primary wave 1. It would most likely be shorter than primary wave 1 as diagonals are more commonly contracting. If primary wave 3 is longer than primary wave 1, then an expanding diagonal would be indicated.
The psychology of diagonals is quite different to impulses. Diagonals contain corrective characteristics and subdivide as a series of zigzags. When diagonals turn up in fifth wave positions, they take on some of the properties of the correction which inevitably follows them. The deterioration in fundamentals and underlying technicals is more extreme and more evident. There is some support for this idea at this time.
The final target of 2,500 would not be able to be reached by an ending contracting diagonal. The final target for this alternate would be calculated only when primary wave 4 is complete.
The classic pattern equivalent is a rising wedge.
DAILY CHART
Click chart to enlarge.
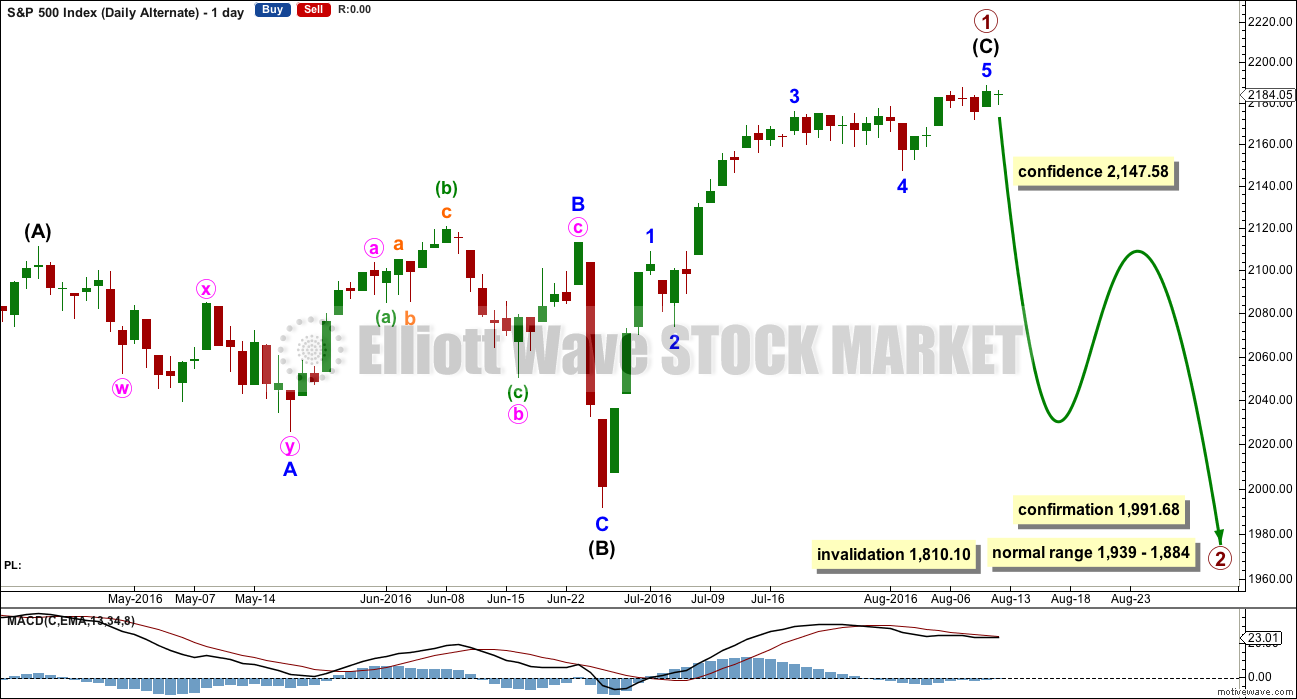
It is possible now that intermediate wave (C) is a complete five wave impulse. However, this wave count suffers from disproportion between minor waves 2 and 4 which gives this possible impulse an odd look. It looks like a three where it should look like a five. However, the S&P just does not always have waves which look right at all time frames.
Because this wave count expects to see a substantial trend change here from bull to bear for a multi week deep pullback, it absolutely requires some indication from price before confidence may be had in it. A new low below 2,147.58 would add confidence.
At this stage, there is not enough selling pressure to support this wave count. When the market has fallen recently, it has fallen of its own weight. For a deep pullback sellers would have to enter the market and be active enough to push price lower. That is not happening at this time.
TECHNICAL ANALYSIS
WEEKLY CHART
Click chart to enlarge. Chart courtesy of StockCharts.com.
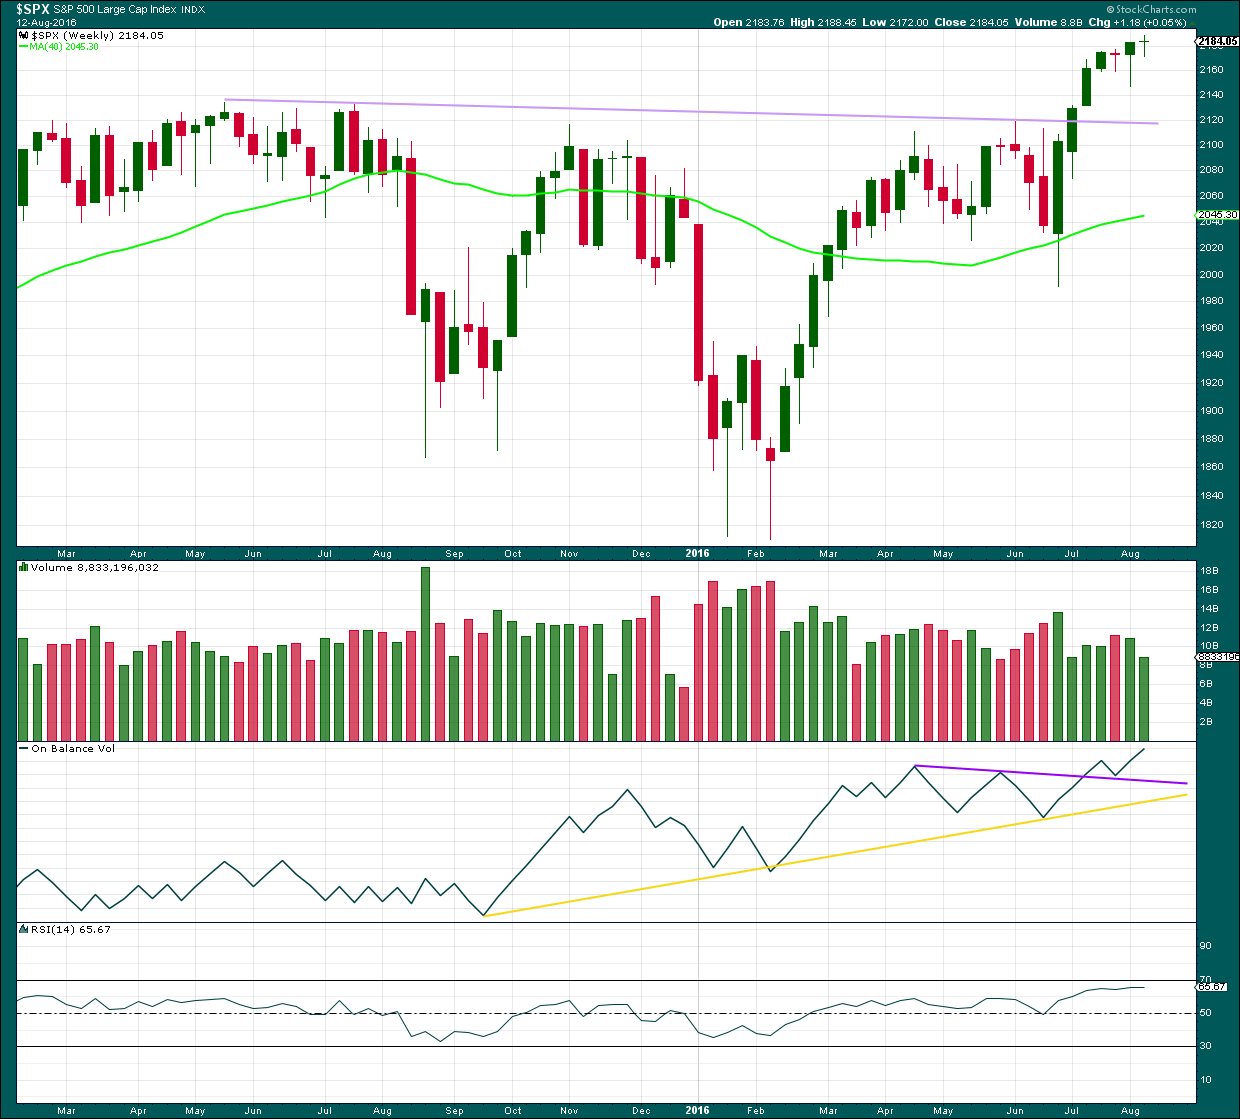
This week ends with a small green doji candlestick. Last week completed a possible hanging man, but the green real body and the long lower wick (bullish) require bearish confirmation from the next candlestick before the pattern can be read as a bearish reversal pattern. That has not happened, so both weekly candlesticks should now be read as bullish.
This weekly candlestick comes with lighter volume. A decline in volume along with a doji candlestick indicates that price movement for the week may have been more consolidation than trend.
On Balance Volume is bullish while it remains above both trend lines. There is no divergence between price and OBV this week to indicate any weakness in price, both made new highs.
RSI is flat and not extreme. There is room for price to rise further.
DAILY CHART
Click chart to enlarge. Chart courtesy of StockCharts.com.
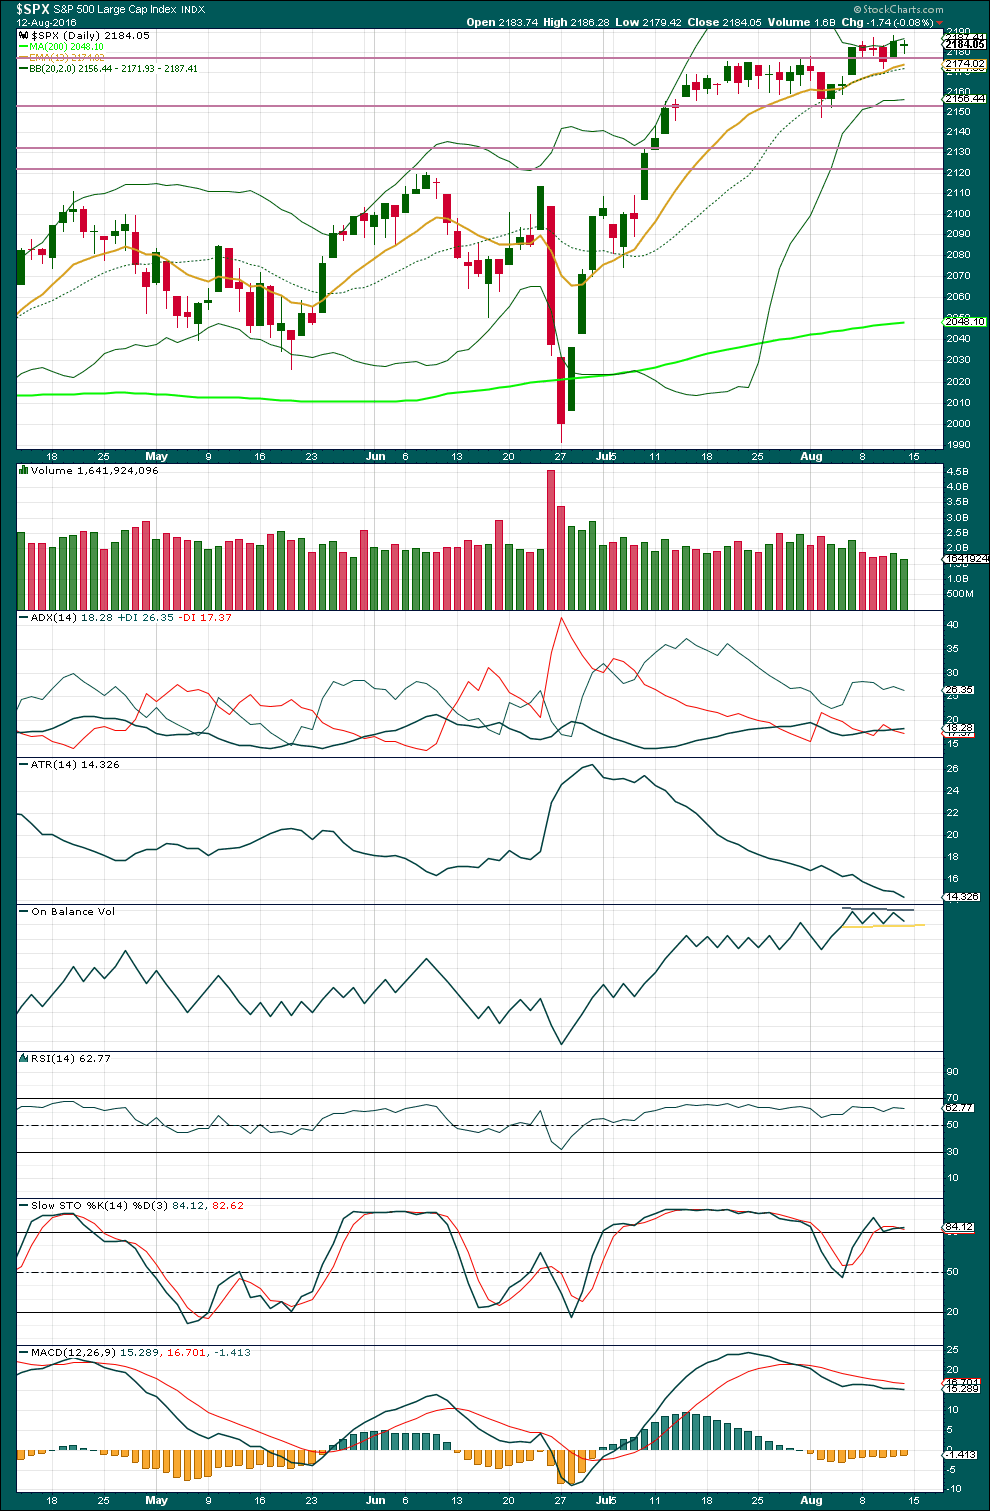
A small inside day completes a small green doji candlestick for Friday’s session. With lighter volume, this session looks to be a small consolidation, a balance between bulls and bears. It is my judgement that this small daily candlestick cannot be read as either bullish or bearish and is neutral.
There is another small increase in ADX for Friday. ADX is indicating there is an upwards trend in place; for three days, it has been increasing albeit very slightly. The trend may be weak but price is trending upwards.
ATR is still declining, but it has been declining since 30th of June while price has been clearly trending. At this time, ATR is indicating that there is something wrong with this trend; it is weak. Normal healthy trends come with increasing ATR, not decreasing.
ATR should be expected to begin to increase again after a long period of decreasing. This tells us nothing of expected direction for price though.
On Balance Volume is still range bound below the grey line and above the yellow line. A breakout from OBV may precede a new direction for price.
RSI is flat and not extreme. There is room for price to rise or fall.
Stochastics is slightly overbought, but this oscillator may remain extreme for reasonable periods of time during a trending market. At this time, divergence between price and Stochastics is not working and will be given no weight.
While price is slowly trending upwards, it is finding support about the 13 day moving average and about the mid line of the Bollinger Bands. With the Bollinger Bands contracting severely, it should be expected that they will again expand as price begins to move more strongly.
There is persistent weakness to this upwards trend, but price is trending. There appears to still be not enough selling pressure to push price lower with strength. Price may yet continue to drift upwards due to a lack of resistance, despite weakness.
VOLATILITY – INVERTED VIX CHART
Click chart to enlarge. Chart courtesy of StockCharts.com.
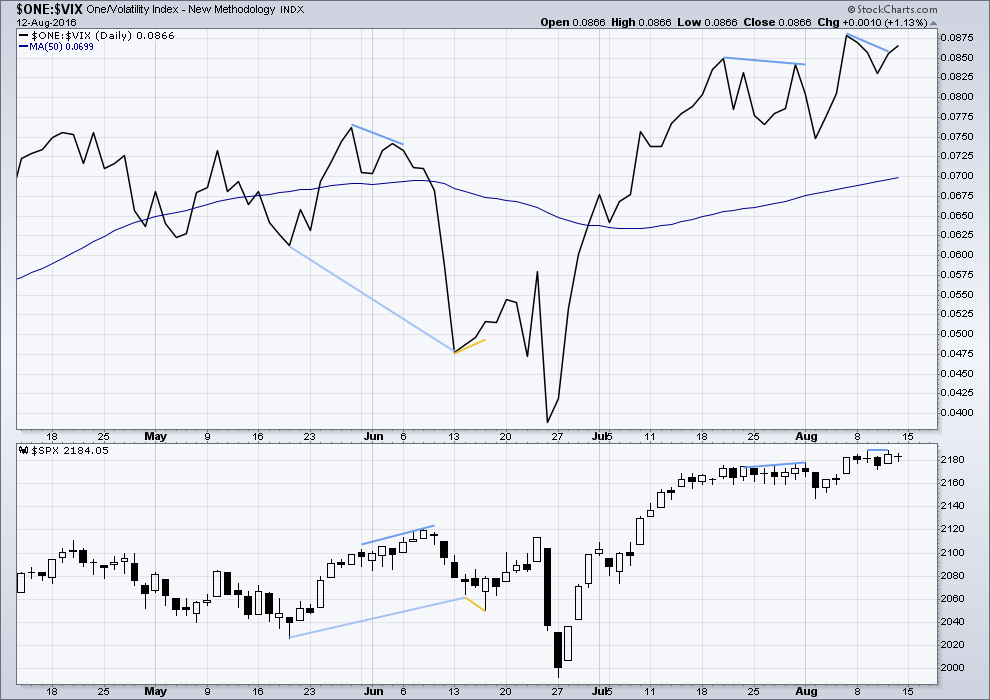
Volatility is declining as price is rising. This is normal for an upwards trend.
There are a few instances of multi day divergence between price and inverted VIX noted here. Bearish divergence is blue. Bullish divergence is yellow. Each of these instances was followed by expected price movement if only for two days. Divergence with VIX and price is not always working, but it is still sometimes working. So it will be noted.
Price on Thursday made a new high, but inverted VIX has failed to make a corresponding high. This divergence used to work to show a movement for the following day, but that has not worked here. It may yet be an indicator of some downwards movement early next week because so far the divergence has not yet disappeared. It will be followed and noted if it works this time.
BREADTH – AD LINE
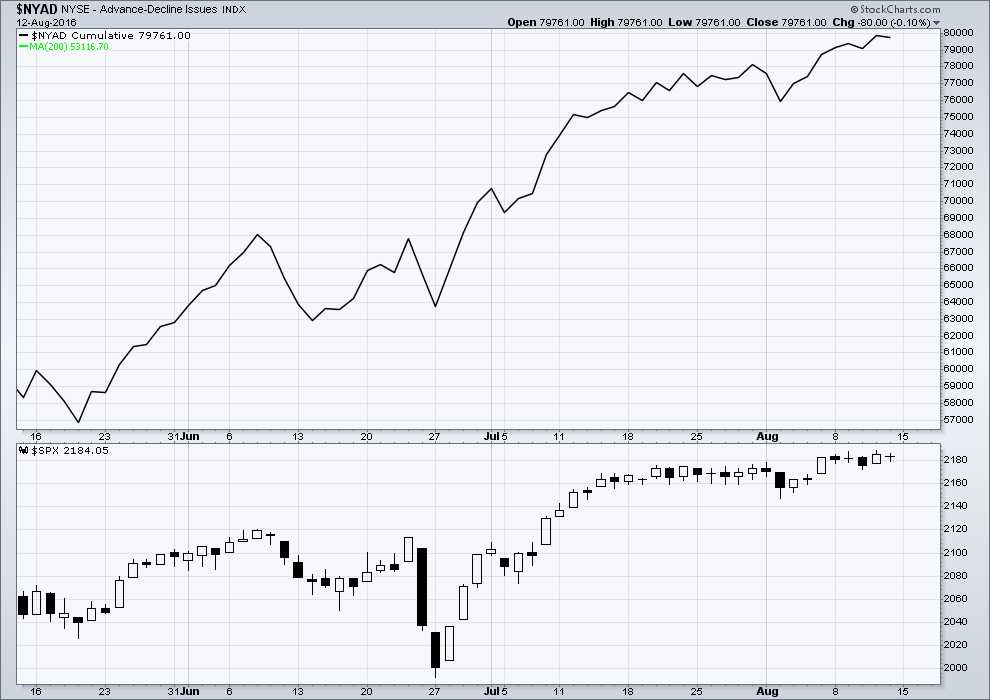
Click chart to enlarge. Chart courtesy of StockCharts.com.
There is support from market breadth as price is rising. The AD line shows no divergence with price; it is making new highs with price.
DOW THEORY
Major lows within the prior bull market:
DJIA: 15,855.12 (15th October, 2014) – closed below on 25th August, 2015.
DJT: 7,700.49 (12th October, 2014) – closed below on 24th August, 2015.
S&P500: 1,821.61 (15th October, 2014) – has not closed below this point yet.
Nasdaq: 4,117.84 (15th October, 2014) – has not closed below this point yet.
Major highs within the new bear market:
DJIA: 17,977.85 (4th November, 2015) – closed above on 18th April, 2016.
DJT: 8,358.20 (20th November, 2015) – has not closed above this point yet.
S&P500: 2,116.48 (3rd November, 2015) – has now closed above this point on 8th June, 2016.
Nasdaq: 5,176.77 (2nd December, 2015) – has now closed above this point on 1st August, 2016.
Dow Theory Conclusion: Original Dow Theory still sees price in a bear market because the transportations have failed to confirm an end to that bear market. Modified Dow Theory (adding S&P and Nasdaq) has failed still to confirm an end to the old bull market, modified Dow Theory sees price still in a bull market.
This analysis is published @ 07:11 a.m. EST on 13th August, 2016.
Vern,
Could it be that large institutions and hedge funds are quite hedged and neutral to slightly bullish, thereby compressing the VIX?
Unless they are hedging in some way other than buying puts against their long positions, that is exactly the problem. VIX is suggesting there is very little hedging going on, at least so far as could be determined by the put/call ratio. This is in fact the very essence of a bullish extreme- not just that equities are rising, but that they are doing so in an atmosphere of very little fear, such presence of a reasonable lever of fear also commonly referred to as “climbing a wall of worry”. The current BB compression in VIX is unlike anything ever seen in any measure of volatility for as long as anyone I know can recall. It is unprecedented, all the new highs notwithstanding. I continue to accumulate VIX shares by the truckload. When compared to the levels we are seeing in equities markets, volatility has never ever been this cheap.
Nice to wake up to a small profit today for this market.
Now, it is possible that minute wave iii is over, but that’s less likely than seeing it continue further. If it’s over at todays high then it’s shorter than minute i and weaker.
With this pathetic weak rise that is possible. I’ll cover that possibility in todays analysis and keep it in mind. I’ll be holding onto my small long position though until intermediate (3) is complete… I’ll back myself and proceed with the assumption the main wave count is correct.
The structure is incomplete. I’ll label todays rise as minuette (i). Minuette (ii) can’t move beyond the start of minuette (i) below 2,182.15.
If price comes back down to the lilac trend line I may consider adding to my long position. Buy the dips. That depends on the EW count at that time though.
My bad… the invalidation point on this chart is wrong. It should be 2,179.42.
Kimble Charting: Super bullish patterns in Crude and broad market formed?
https://www.kimblechartingsolutions.com/2016/08/super-bullish-patterns-crude-broad-market-formed/?utm_source=ActiveCampaign&utm_medium=email&utm_content=Super+bullish+patterns+in+Crude+and+broad+market+formed%3F&utm_campaign=Daily+Kimble+Blog+Posts+RSS
We now have extreme bullishness across the board:
http://www.zerohedge.com/news/2016-08-13/most-hated-rally-options-traders-have-never-ever-been-more-bullish-stocks
Guess the market will just keep going up 😉
I am curious why neither VIX nor SVXY have already exceeded extremes seen last August…the former with a new 52 week low, and the latter with a new 52 week high…
First.
Hi Alan:
Any additional thoughts on the question of “massaged” data? 🙂
I have been taking another look at the remarkable BB compression evident in so many charts. The compression is occurring after a trend of fairly reasonable duration and the more I think about it, the more it seems to me that any huge move this compression may be signaling would be in the form of a reversal of the current trend, not its continuation. Just thinking out loud….
Starting to nibble on some shares of SRTY, as well as adding to volatility…
Hi verne.
The way I see it, public domain data cannot be fabricated. It is only those that are proprietary that can be “massaged” to fit the analysis of whichever personnel it is in that organisation who so desire. Sometimes data that can have many variations such as some commodities that are traded in global markets can be “changed” if expedient.
My experience with BB is that they usually lead to a trend reversal. But there are also many cases in which prices continue in the same path after the bands become squeezed. That could mean some entity deigned to disrupt the trend.
I always have the nasty suspicion that devious individuals who have the intention of moving the market to their advantage would have at their disposal analysts and computer programmes that churn out reversal points using the same tools that we use, such as Elliott Wave, Gann and so on. They can then easily manipulate the market at those points so as to garner the greatest profit from hardworking people like you and I.
Funny you should say that, I have the same nasty suspicion, and have for some time now….if we only knew…! 🙂
Yes… especially in election years. Does the SEC or some other entity check into this? Would really be nice to hone in on where all the buy volume comes from at critical juncture. There was talk of a plunge protection team that was set up to protect against market downturns….maybe they ran amuck and now align themselves with party that will best suit them or friends in high places. In the end all of those involved will be uncovered ….
And hung at the city gates
I think the market buys now involve more entities than the PPT. At least Japan is openly admitting they are now responsible for 60% of the ETF buy orders in their market. Rumour has it that in addition to the PPT and FED purchases, cash is also being funneled to select hedge funds in the tens of millions to help prop up the markets. Bloomberg also showed a chart this morning of the number of foreign buyers participating in US markets and it turns out that they far out-strip domestic purchases.
I doubt that the real forces will ever be brought to justice–maybe I’m just pessimistic. Seriously, if you were bribed with 6 figures to ignore what was happening as opposed to being threatened for your life for pursuing a corrupt entity, what would you do? Most would take the money and let someone else put their life on the line if we really want to delve into conspiracies…probably not a smart thing to do if we want to make money in the market. So I’m sure that the SEC has no problem regulating the small players, but larger players are anyone’s guess.
The dotcom bubble of 2000 started while Bill Clinton was in office and ran into Bush II’s years. The financial crisis burst in 2008 while Bush II was leaving office. And now this, we don’t know where it’s going, but I suspect it will be something like the last 2…the question I have as most of us have is when is the likely timeframe? Will it be during Obama’s rule? Or will it somehow be passed on to the next victim?
If the market does collapse, I can’t wait to hear the rhetoric about how it’s the other guy’s fault and somehow not the responsibility of those currently in power.
Based on this brief history, one could argue the probability of the bubble bursting before this year is over, perhaps September or October. I personally think there’s a great probability for the FOMC timeframe in September, but it could just be wishful thinking as well…
To the Next Victim… That means on November 9th, LOOK OUT!!!!!
I have faith that the truth will surface very soon and before the election!
The Lord will NOT allow these criminals to get away with all this stuff! Has a plan for them!
Quite remarkable how many folk are insisting: “This time is different”.
One has to shake one’s head in wonder, considering the state of the economy and the fiscal health of the government relative to 2007, when so many talking heads on the airwaves are giving us all the reasons that this is not 2007. Although they don’t realize why, they are actually quite correct in saying it is not like 2007.
It is worse…far worse!!