
Yesterday’s hourly Elliott wave count expected some upwards movement to end between 2,185.44 to 2,188.32, then downwards movement.
Price began the session with upwards movement and reached 1,287.66 before turning downwards exactly as expected.
Summary: The trend remains the same, until proven otherwise. Assume the trend is up while price is above 2,147.58. In the short term, tomorrow may see lower movement to 2,171 – 2,168 before the upwards trend resumes. The mid term targets are 2,332 or 2,445. If price makes a new low below 2,147.58, then probability will shift to a deep pullback beginning, target zone 1,938 to 1,881.
Last monthly chart for the main wave count is here.
New updates to this analysis are in bold.
MAIN WAVE COUNT
WEEKLY CHART
Click chart to enlarge.
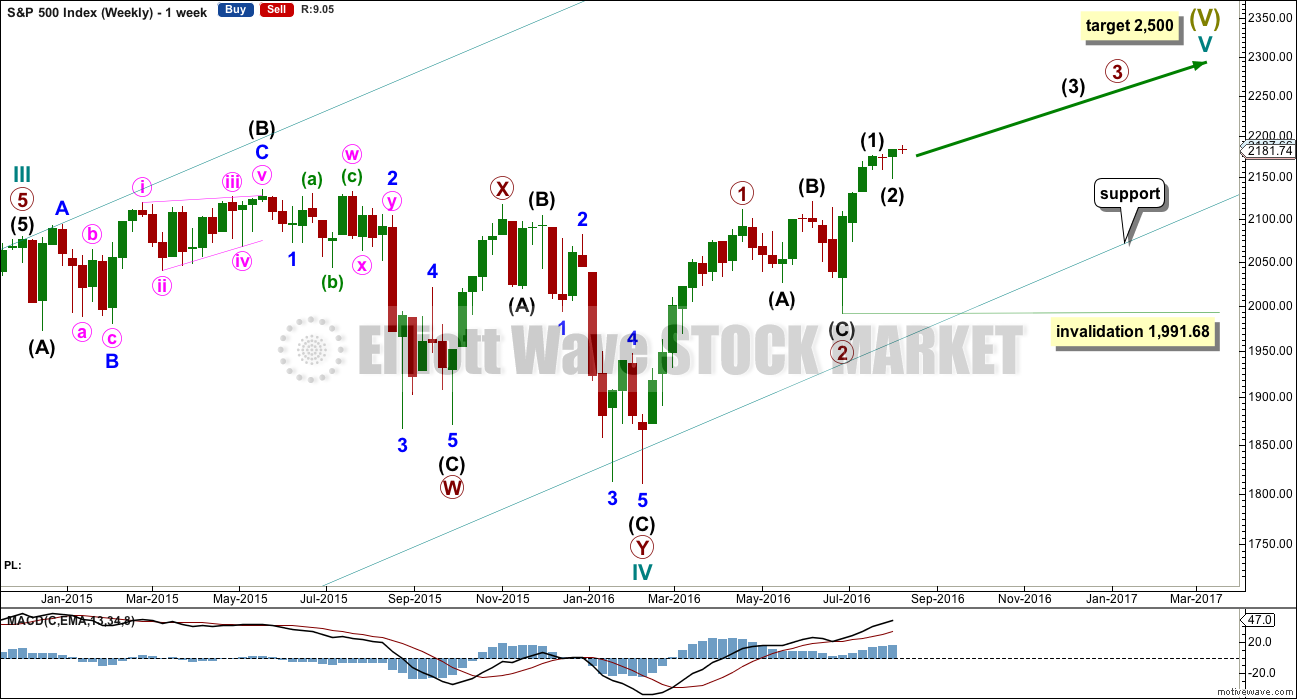
Cycle wave II was a shallow 0.41 zigzag lasting three months. Cycle wave IV is seen as a more shallow 0.28 double combination lasting 15 months. With cycle wave IV five times the duration of cycle wave II, it should be over there.
Cycle wave I lasted 28 months (not a Fibonacci number), cycle wave II lasted a Fibonacci 3 months, cycle wave III lasted 38 months (not a Fibonacci number), and cycle wave IV lasted 15 months (two more than a Fibonacci 13).
If the target for cycle wave V is for it to be equal in length with cycle wave I, then it may also be expected to be about equal in duration. So far cycle wave V is in its sixth month. After this month, a further 22 months to total 28 seems a reasonable expectation, or possibly a further 15 months to total a Fibonacci 21.
This first weekly wave count expects the more common structure of an impulse is unfolding for cycle wave V. Within cycle wave V, primary waves 1 and now 2 should be over. Within primary wave 3, no second wave correction may move beyond its start below 1,991.68.
There is one other possible structure for cycle wave V, an ending diagonal. This is covered in an alternate.
DAILY CHART
Click chart to enlarge.
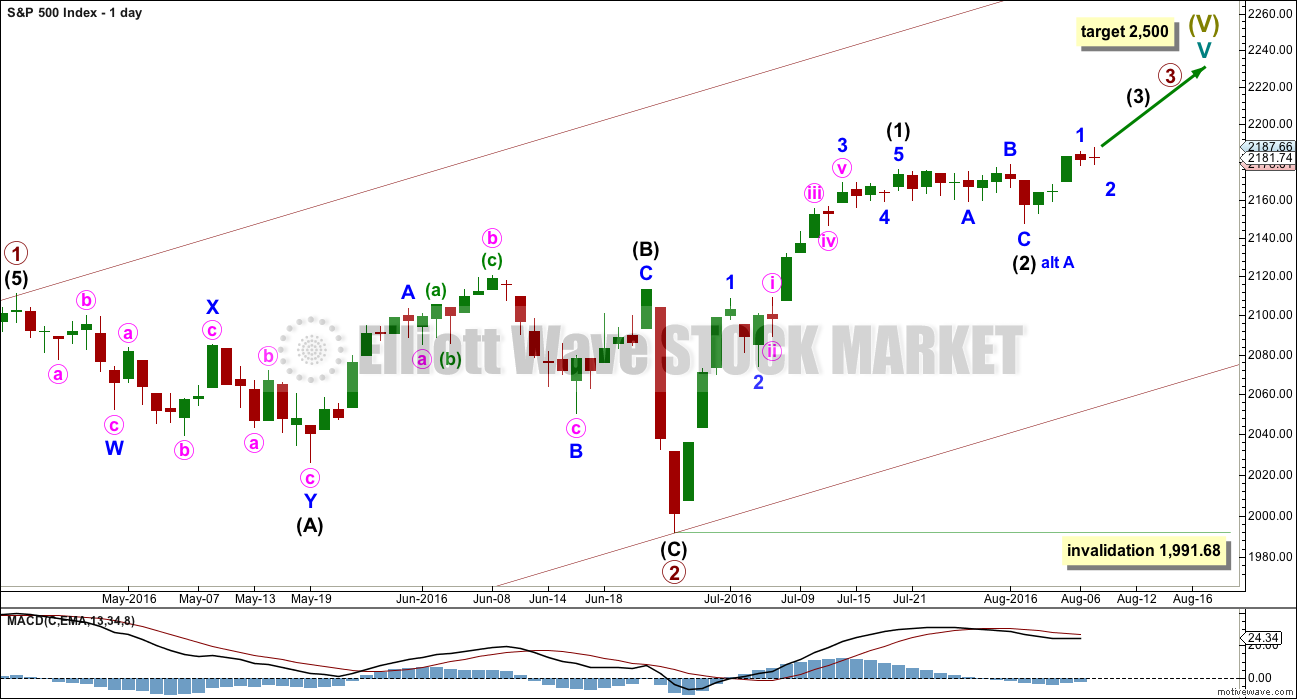
Primary wave 2 is complete as a shallow regular flat correction. Primary wave 3 is underway.
Within primary wave 3, intermediate wave (1) is a complete impulse. Intermediate wave (2) may now be a complete flat correction.
If the degree of labelling within intermediate wave (2) is moved down one degree (alternate labelling), then it is still possible that only minor wave A is complete as a flat correction. It is possible that intermediate wave (2) may complete further sideways as a longer lasting flat correction, or a double flat or double combination. All options would expect sideways movement though, not a deep pullback.
Within a possible continuation of intermediate wave (2), there is no upper invalidation point for the idea because there is no rule stating a limit for a B wave within a flat. There is a convention within Elliott wave that states once the possible B wave is longer than twice the length of the A wave the probability that a flat is unfolding is so low the idea should be discarded. Here that price point would be at 2,203.68.
Above 2,203.68 more confidence in this wave count and the targets may be had.
Intermediate wave (2) may not move beyond the start of intermediate wave (1) below 1,991.68.
At this stage, it looks most likely that intermediate wave (3) has begun. It should be expected to show the subdivisions of minor waves 2 and 4 clearly on the daily chart with one to a few red daily candlesticks or doji. With minor wave 2 now showing as one red candlestick and one doji, this wave count so far has a typical look.
HOURLY CHART
Click chart to enlarge.
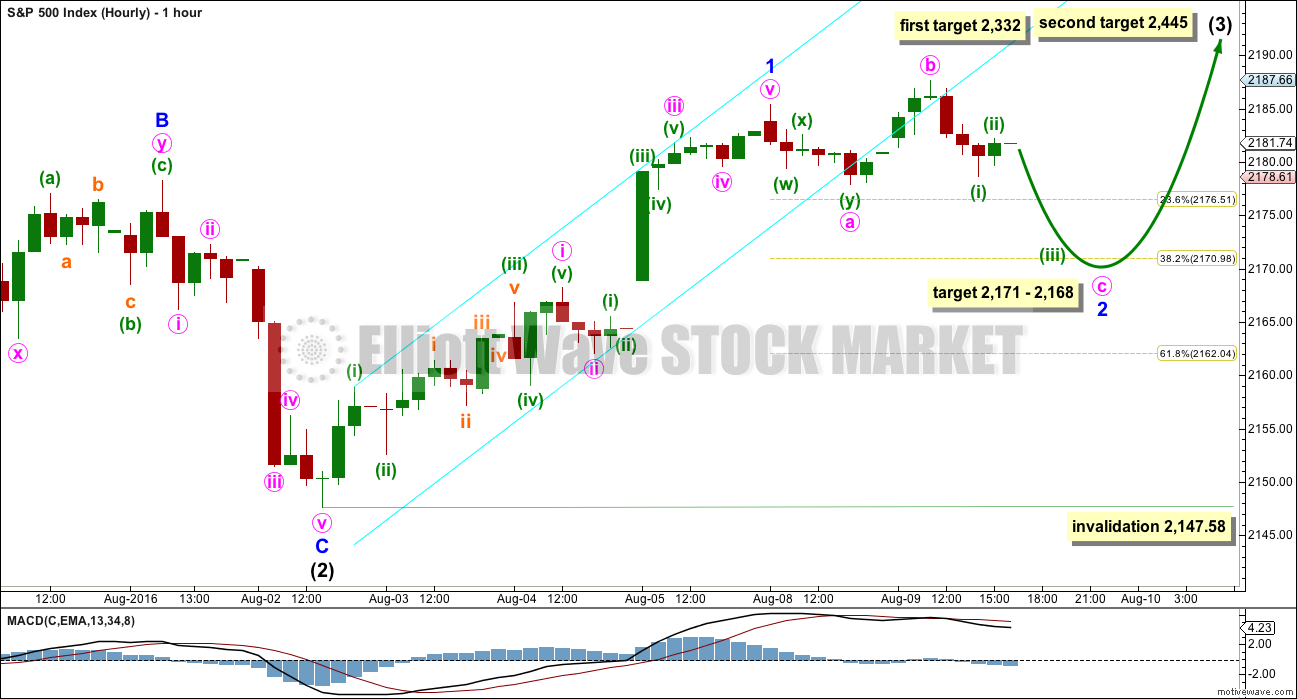
Minor wave 1 now fits as a complete impulse. With downwards movement for Monday’s session showing as a small red daily candlestick, it looks like minor wave 1 was over at Monday’s high.
Ratios within minor wave 1 are: minute wave iii is 0.81 short of equality in length with minute wave i, and minute wave v has no Fibonacci ratio to either of minute waves i or iii.
Minor wave 2 so far fits best as an incomplete expanded flat correction. These are very common structures. So far minute wave a is a three, a double zigzag. Minute wave b may be a single zigzag although this upwards wave looks suspiciously like a five wave impulse on the five minute chart. If this wave count is wrong today, it may be in expecting more downwards movement to end minor wave 2. It is possible that minor wave 2 is already over. Look out for surprises to the upside with a third wave at three degrees up possibly starting.
At 2,168 minute wave c would reach 2.618 the length of minute wave a. This is close to the 0.382 Fibonacci ratio of minor wave 1 at 2,171 giving a 3 point target zone.
Within minute wave c, so far minuette waves (i) and now (ii) may be complete. In the short term, a new high above 2,187.66 could not be a continuation of minuette wave (ii), so short term the structure of minor wave 2 as labelled here would be invalidated above 2,187.66. At that stage, if that happens tomorrow, then expect minor wave 2 was over and upwards momentum should increase.
At 2,332 intermediate wave (3) would reach equality in length with intermediate wave (1). This is a reasonable Fibonacci ratio to use for the target because intermediate wave (2) would be very shallow at only 0.15 of intermediate wave (1).
At 2,445 intermediate wave (3) would reach 1.618 the length of intermediate wave (1).
Intermediate wave (3) may only subdivide as an impulse. Minor wave 1 would still be incomplete within intermediate wave (3). Minor wave 2 may not move beyond the start of minor wave 1 below 2,147.58.
ALTERNATE WAVE COUNT
WEEKLY CHART
Click chart to enlarge.
This alternate may again diverge from the main wave count, so it will again be published.
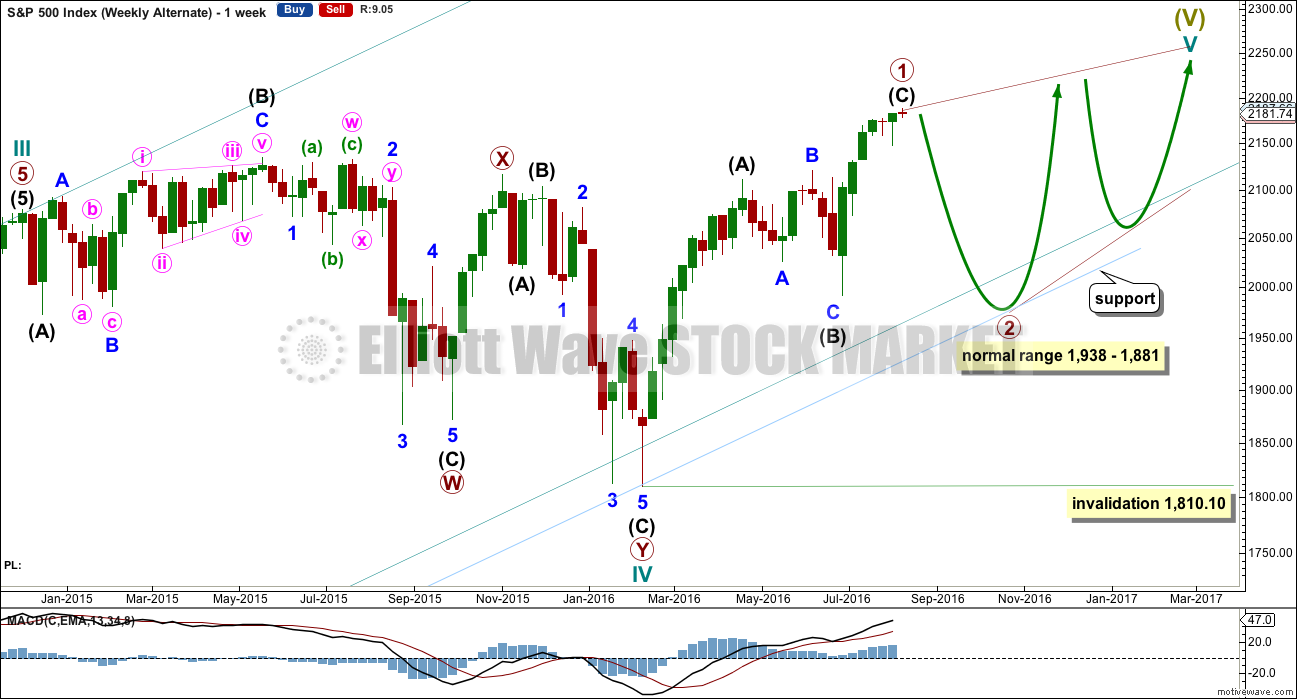
The other structural possibility for cycle wave V is an ending diagonal. Ending diagonals are more often contracting than expanding, so that is what this alternate will expect.
Ending diagonals require all sub-waves to subdivide as zigzags. Zigzags subdivide 5-3-5. Thus primary wave 1 may now be a complete (or almost complete) zigzag, labelled intermediate waves (A)-(B)-(C) which subdivides 5-3-5.
The normal depth for second and fourth waves of diagonals is from 0.66 to 0.81 the prior actionary wave. Primary wave 2 may end within this range, from 1,938 to 1,881.
Primary wave 2 may not move beyond the start of primary wave 1 below 1,810.10.
When primary wave 2 is a complete zigzag, then another zigzag upwards for primary wave 3 must make a new high above the end of primary wave 1. It would most likely be shorter than primary wave 1 as diagonals are more commonly contracting. If primary wave 3 is longer than primary wave 1, then an expanding diagonal would be indicated.
The psychology of diagonals is quite different to impulses. Diagonals contain corrective characteristics and subdivide as a series of zigzags. When diagonals turn up in fifth wave positions, they take on some of the properties of the correction which inevitably follows them. The deterioration in fundamentals and underlying technicals is more extreme and more evident. There is some support for this idea at this time.
The final target of 2,500 would not be able to be reached by an ending contracting diagonal. The final target for this alternate would be calculated only when primary wave 4 is complete.
The classic pattern equivalent is a rising wedge.
DAILY CHART
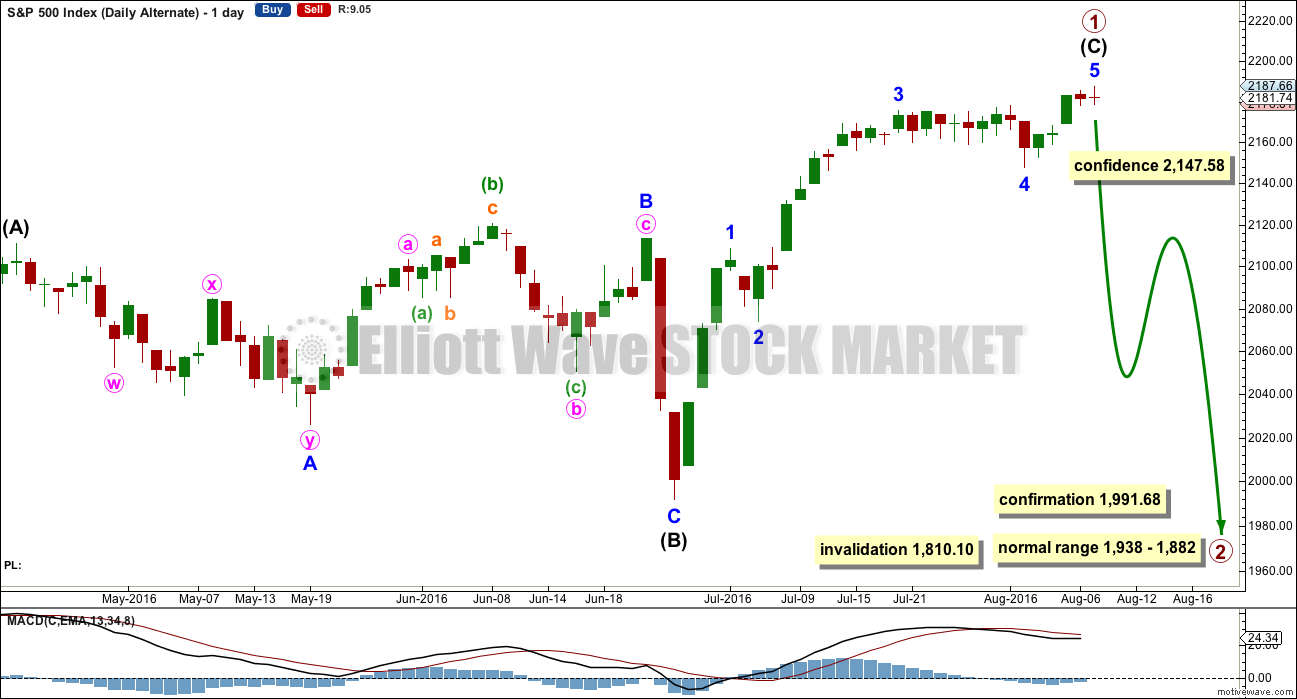
Click chart to enlarge.
It is possible now that intermediate wave (C) is a complete five wave impulse. However, this wave count suffers from disproportion between minor waves 2 and 4 which gives this possible impulse an odd look. It looks like a three where it should look like a five. However, the S&P just does not always have waves which look right at all time frames.
Because this wave count expects to see a substantial trend change here from bull to bear for a multi week deep pullback, it absolutely requires some indication from price before confidence may be had in it. A new low below 2,147.58 this week would add confidence.
At this stage, there is not enough selling pressure to support this wave count. When the market has fallen recently, it has fallen of its own weight. For a deep pullback sellers would have to enter the market and be active enough to push price lower. That is not happening at this time.
TECHNICAL ANALYSIS
WEEKLY CHART
Click chart to enlarge. Chart courtesy of StockCharts.com.
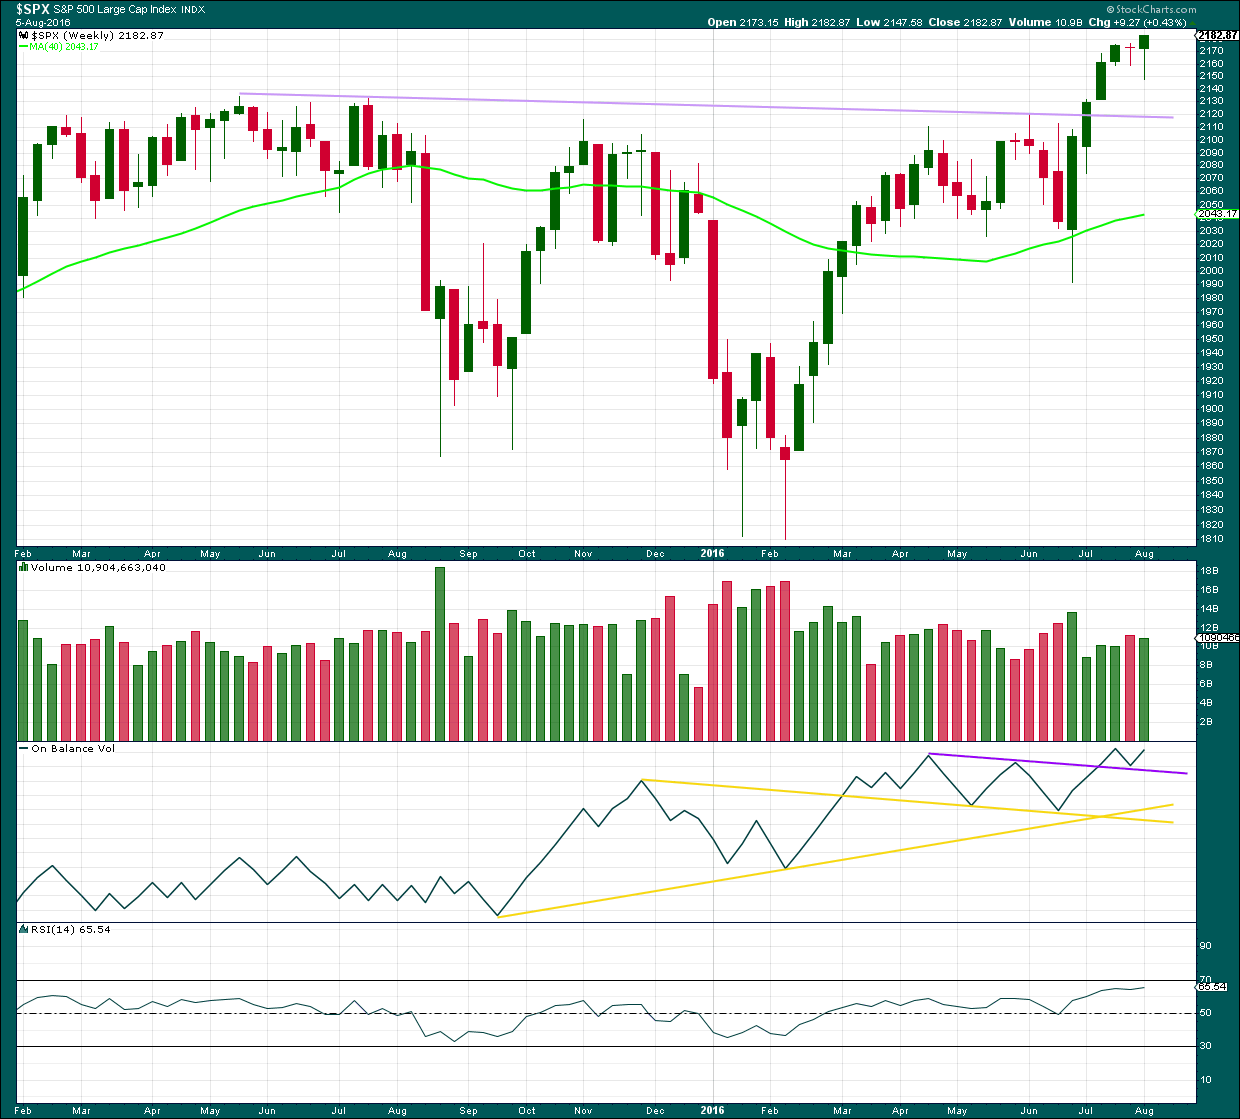
The bearish implications of the stalled candlestick pattern should now be fulfilled with two weeks of a small consolidation.
Last week ended with a new high at the close. The weekly candlestick is a hanging man, but due to the bullish implications of the long lower wick and the green real body this requires confirmation with a downwards week before the bearish implications can be considered seriously.
At this stage, any deeper pullback should find strong support at the lilac trend line. Support at this line should stop any pullback from being very deep.
Last week the bulls were dominant. They rallied to push price out of a consolidation and managed to hold price above prior resistance to close above on Friday. The long lower wick of this weekly candlestick is bullish.
The weekly candlestick comes with slightly lighter volume than last downwards week. The rise in price was not well supported by volume. But that has been a common pattern in recent months, so perhaps not too much bearishness should be read in to this here.
On Balance Volume is still bullish as it remains above the purple trend line.
RSI is not yet overbought. There is room yet for a further rise in price.
DAILY CHART
Click chart to enlarge. Chart courtesy of StockCharts.com.
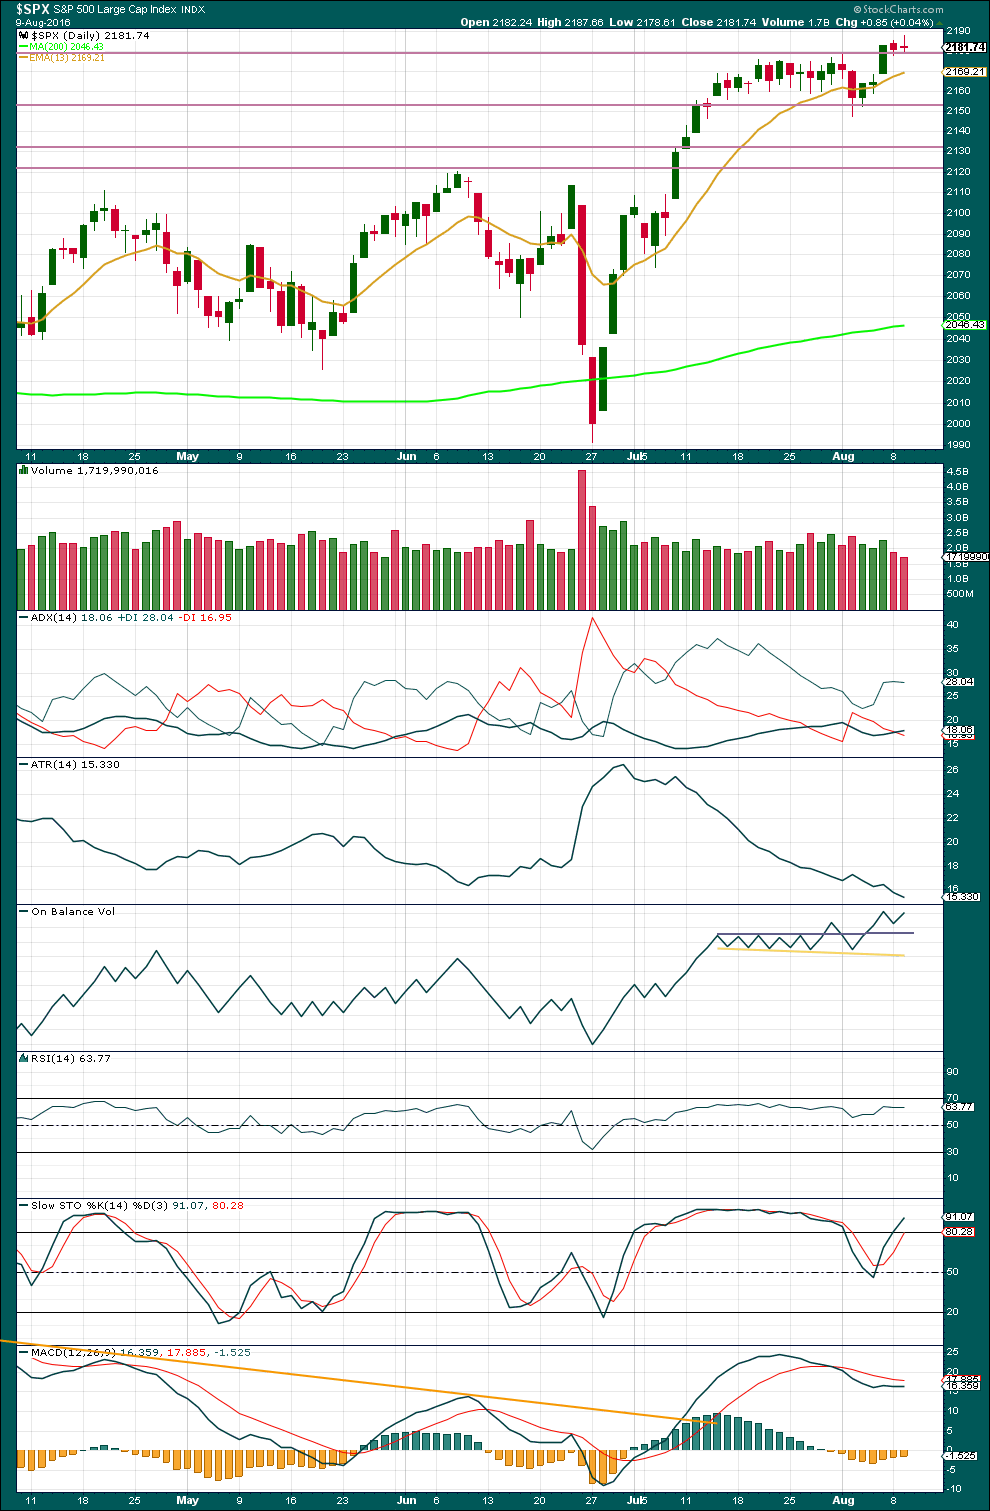
A sideways consolidation has ended. Price has broken above resistance and closed above that point for Friday’s session. The horizontal line about 2,175 should now provide support.
Friday had some support for the rise in price from volume.
Monday and Tuesday have both completed red daily candlesticks on lighter and declining volume. The fall in price is not supported by volume, so it is suspicious. This supports the main Elliott wave count over the alternate. If a deep pullback was just beginning, then downwards volume should be stronger than this. The market is again falling of its own weight; there is little selling pressure.
ADX is increasing, indicating the market is trending upwards.
ATR continues to disagree though, as it has for the entire trend from the low of 27th June to the last high. There is still something wrong with this trend. It is not normal nor healthy so far. It looks like price is rising on weak buying power due to a lack of resistance, and when price falls it is not falling far or fast due to a lack of selling pressure. This pattern may yet continue through the next wave up.
On Balance Volume is bullish while it remains above both trend lines.
RSI is not yet extreme. There is still room for price to rise further.
Stochastics is only now entering overbought, but this oscillator may remain extreme for reasonable periods of time during a trending market. When and if it shows divergence, it would be indicating some weakness in price. But at this time divergence is proving to be fairly unreliable, so it will be given little weight.
Lowry Research shows this rise comes with increasing market breadth. There is not enough selling pressure for price to fall; the consolidation looks like a period of accumulation. With a breakout on slightly higher volume for Friday, this accumulation phase looks to be over and the sideways range was a pause in an upwards trend and not the start of a new downwards trend. With broad agreement between Lowry’s analysis and this analysis presented here, I have more confidence in the upwards trend continuing.
VOLATILITY – INVERTED VIX CHART
Click chart to enlarge. Chart courtesy of StockCharts.com.
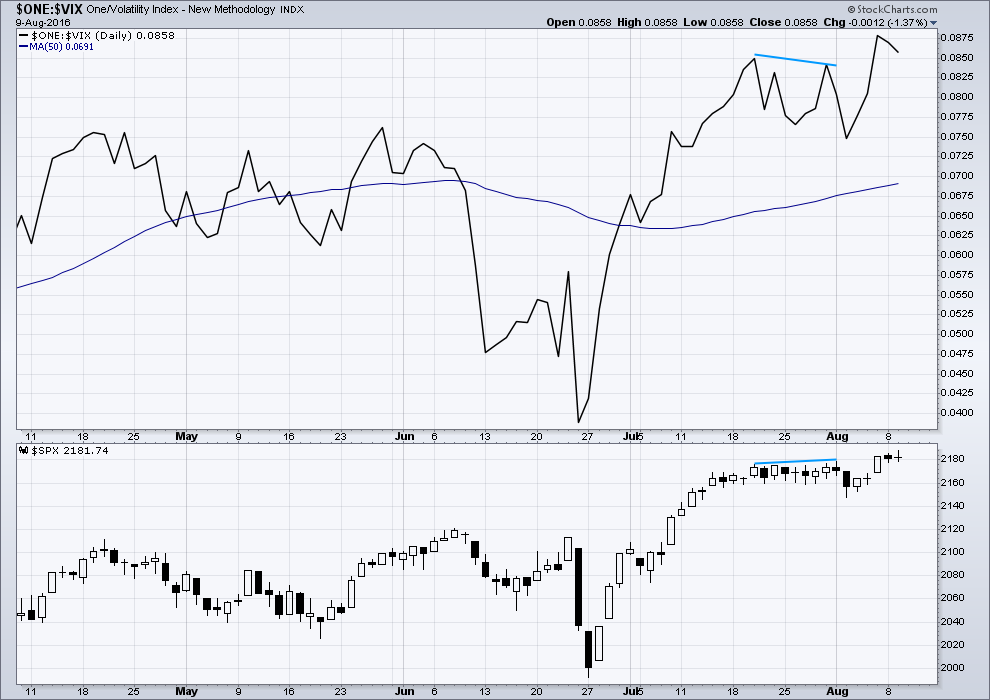
Volatility is declining as price is rising. This is normal for an upwards trend.
There is an example of multi day divergence with price and VIX (blue lines) which did lead to some downwards movement. The downwards movement that resulted from this divergence lasted only for two days, but it did make a new low.
BREADTH – AD LINE
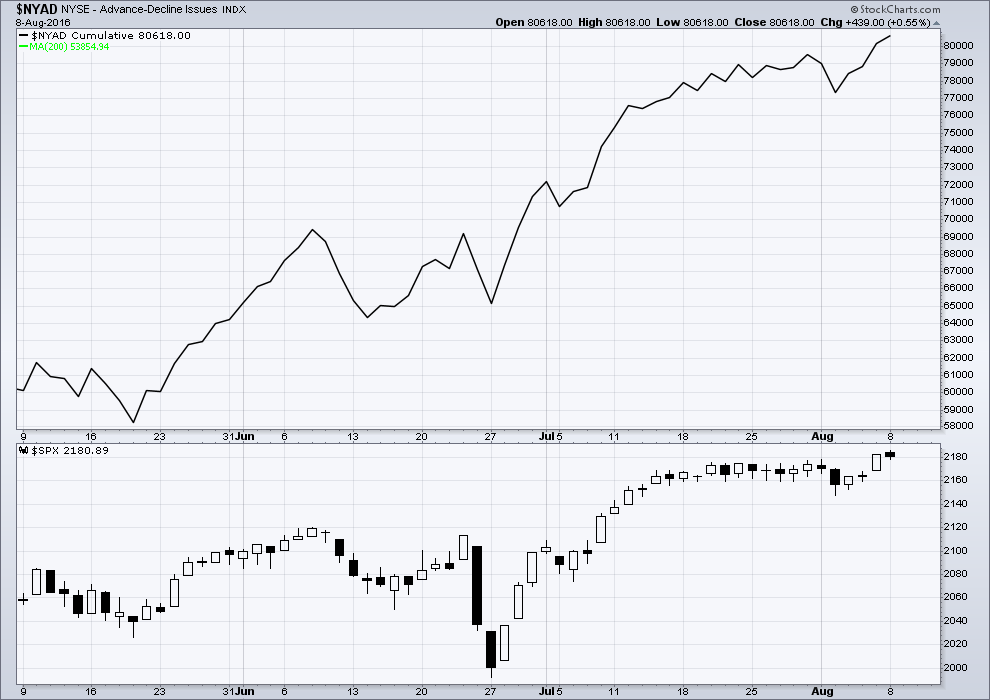
Click chart to enlarge. Chart courtesy of StockCharts.com.
There is support from market breadth as price is rising. The AD line shows no divergence with price; it is making new highs with price.
DOW THEORY
Major lows within the prior bull market:
DJIA: 15,855.12 (15th October, 2014) – closed below on 25th August, 2015.
DJT: 7,700.49 (12th October, 2014) – closed below on 24th August, 2015.
S&P500: 1,821.61 (15th October, 2014) – has not closed below this point yet.
Nasdaq: 4,117.84 (15th October, 2014) – has not closed below this point yet.
Major highs within the new bear market:
DJIA: 17,977.85 (4th November, 2015) – closed above on 18th April, 2016.
DJT: 8,358.20 (20th November, 2015) – has not closed above this point yet.
S&P500: 2,116.48 (3rd Nobember, 2015) – has now closed above this point on 8th June, 2016.
Nasdaq: 5,176.77 (2nd December, 2015) – has now closed above this point on 1st August, 2016.
Dow Theory Conclusion: Original Dow Theory still sees price in a bear market because the transportations have failed to confirm an end to that bear market. Modified Dow Theory (adding S&P and Nasdaq) has failed still to confirm an end to the old bull market, modified Dow Theory sees price still in a bull market.
This analysis is published @ 11:16 p.m. EST.
It looks like minute wave c is an almost complete impulse.
Today a perfect five down unfolded for minuette (iii). Now one final new low… to the target? Would complete the structure of minute c, and so the expanded flat for minor 2.
And then the main wave count would expect upwards movement to begin to show some increase in momentum, and have support from volume. For a third wave up.
Yep! Impulse down now complete. If we are about to see a third up we should see a big move up from here.
After one more low…
Maybe that’ll give tomorrows candlestick a long lower wick = bullish
I guess you are seeing an extended wave three… 🙂
No, I mean minuette wave (v) down to complete the impulse of minute c.
These ubiquitous expanded flats have been throwing traders off for months now and I suspect that there could be another one developing in this wave down. Selling pressure was quite mild today and the fact that the open gap from August 4 remained open suggests to me that Lara’s count is the right one despite the jump in volatility. We really should have a much clearer picture of the near term market direction at the end of tomorrow’s session, up or down. ‘Bye all!
Sheez…can anyone make heads or tails of this current price action? Caught a small short this am for some lunch money. Now I’m flat. Looking like there’s some support here?
Verne, you still think the top is in? Any sense of direction from the VIX?
So far volatility upper BB penetration trigger seems to have correctly predicted some downward movement. Market at a critical juncture and now we need to see how much downside follow through we get. As I indicated, I have never ever seen this kind of extreme in volatility NOT lead to at least several days of corrective price action. Next important level that will signal a more serious move down underway is gap from August 4 close at 2164.25…we need to fill it to cement the immediate bearish case imo…
Lara’s target for minor two to end still in play so we have to respect that possibility….
Looks like the market has found a little support from the top of the multi decade long consolidation pattern from July. At least so far….
TICK… TICK… TICK…TICK… TICK… TICK…
POP…POP…POP…POP…POP…POP…POP…POP…
“When you run in debt; you give to another the power over your liberty.” Benjamin Franklin
$1 Trillion per year of new debt being added in the USA since 2009… to visualize that… 1 trillion seconds was 31,000 years ago
$210 Trillion is the Real US National Debt – Current Outstanding US Government Debt + all Unfunded Liabilities
The Collapse has already started!
They don’t want you to know the truth!
A Curse warned about by James Madison is here now! The Curse on the American public.
Curse – Prosperity through productivity is the foundation envisioned for the USA and what we were built on – but now it’s Prosperity through debt issuance!
I go on the principle that a public debt is a public curse.
A healthy nation grows through productivity NOT through Issuance of Debt!
“I go on the principle that a public debt is a public curse, and in a Republican Government a greater curse than any other”
– James Madison
“A departure from principle becomes a precedent for a second; that second for a third; and so on, till the bulk of society is reduced to mere automatons of misery, to have no sensibilities left but for sinning and suffering… And the fore horse of this frightful team is public debt. Taxation follows that, and in its train wretchedness and oppression.”
-Thomas Jefferson
“We must not let our rulers load us with perpetual debt.”
– Thomas Jefferson
“Allow a government to decline paying its debts and you overthrow all public morality — you unhinge all the principles that preserve the limits of free constitutions. Nothing can more affect national prosperity than a constant and systematic attention to extinguish the present debt and to avoid as much as possibly the incurring of any new debt.”
-Alexander Hamilton
“The consequences arising from the continual accumulation of public debts in other countries ought to admonish us to be careful to prevent their growth in our own.”
– John Adams
“The burden of the national debt consists not in its being so many millions, or so many hundred millions, but in the quantity of taxes collected every year to pay the interest. If this quantity continue the same, the burden of the national debt is the same to all intents and purposes, be the capital more or less.”
-Thomas Paine {Now Today Trillions} $210 Trillion with unfunded liabilities (Promisses)}
Lara,
I trust your counts as they have been very accurate, however, with al the other major markets trending down and definitely put in tops, how can the lone survivor S&P and our indices still in BULL market? The dollar is in a bull move also. This is very perplexing. How can this be as we are all global traders now? Does Elliott Wave have any allowance for this?
It is not unusual to see inter-market divergences at historic tops such as we are now seeing. I think the ED count also allows for some dissipation of the current sentiment extreme before a potential final blow-off top.
?? DJI has just very recently made new highs. It’s not trending down, it’s trending up.
Nasdaq is very close indeed to it’s highs of July 2015, it may very well make new highs.
DJT is the most bearish of all, but that doesn’t mean the others must therefore turn bearish.
I’m not expecting S&P to be a lone market, I expect they’ll all move together.
As for the other international markets… FTSE is trending up, not down. That’s really clear.
There is nothing in this analysis which expects only S&P to move into a bull market for another year or so. There is nothing to stop the other markets doing so too.
They don’t have to though. They (the US markets and European markets this is) don’t have to be all aligned.
Just another quick note on the situation with the SPX BB compresssion. I was not aware of this when I posted on the subject yesterday but apparently the situation we are now seeing is historic. Last August the BB width indicator fell below 2.5 (for only the third time in several decades). Yesterday it fell below 1.5, apparently for the first time ever.
I am not in the habit of telling anyone what to do with their trading decisions, but if you are trading the markets on margin of any kind whatsoever……PLEASE….be very careful…..
It’s important to note that this contraction of BB’s makes no comment on the direction expected next, it’s only warning of a big move next.
I’ll echo Verne’s warning. It’s important, so vital, to always use stops.
Never invest more than 3-5% of equity on any one trade.
I know I keep repeating this. But I do think it’s necessary, because I know this advice is ignored.
If new members (and old) learn nothing else from me then let it be these two risk management rules.
TICK… TICK… TICK…
Deutsche Bank Unexpectedly Found To Have Massive Capital Gap, Larger Than Its Entire Market Cap
After the ECB concluded its latest annual stress test, which as expected found no problems with Europe’s largest banks, yesterday in an unexpected outcome, German economic research institute ZEW found that Deutsche Bank had the highest potential capital shortfall, as much as €19 billion in a study of 51 European banks using U.S. Federal Reserve stress test methods. The capital gap is greater than DB’s entire market cap.
http://www.zerohedge.com/news/2016-08-10/deutsche-bank-unexpectedly-found-have-massive-capital-gap-larger-its-entire-market-c
This will also mean absolutely nothing as well (More New Highs)… because…
The Market is a DUMB A_ s F _ _ K!
Whatta ya mean “unexpectedly” dude??!! 🙂
I guess they can just tender a few more hundred billion DB shares and that oughta take care o’ things…you think?
Now I understand why the DAX was up by more than 2.5% in the futures market! “Nothing to see here folks…move along!!” 🙂
Hello,
just a few words to say thank’s to all of you. Your comments, your analysis, your psychological views are of great value to understand (or try to) what is happening in this market. I am new to the site, and new to trading. Trading is a mix between art and science, and what we are experiencing right now is the proof that human behaviour is not something that can be put into an equation…and therefore simply solved. Great job done by Lara by the way. Again thank’s and good trading ahead to all of you!
Eric
A quick query Lara:
Does moving the end of minor three to the point indicated by the arrow pose an EW problem?
(Other than the odd dis-proportion of the 4th waves)
A bit, yeah.
Minor 4 would be a zigzag as would minor 2 so no alternation. And minor 4 fits best as a five on the hourly chart. That’s the wave down I have labelled minor C on the hourly chart published in todays analysis, as you can see it looks quite like a five (you could fit a three in there though).
Seeing minor 4 as a flat, and that last wave down wave C fits as a five. Then minor 4 is a flat and minor 2 is a zigzag… so that would have a higher probability.
Thx! 🙂
That’s why you are the analyst and I the acolyte… 🙂
No worries. I see the problem you were trying to resolve there… the curved three look to the whole movement.
But even if you could move the high of minor 3 over to the right, now you have the same problem just in minor 3 itself now, not the whole thing.
That problem’s not going away unfortunately
There’s a big move afoot…!
Thinking of macroeconomics, FOMC may raise the Fed Funds rate this September as there is an increasing chance with all the “good” news with the jobs report and all-time highs. What excuse are they going to come up with this time? There are some Fed presidents that do want to raise sooner than later, one being Kaplan from Dallas.
For those who don’t understand, when the Fed decides to raise interest rates, the money supply contracts causing investment to decrease as money is less desirable to borrow. This has a great effect on interest-sensitive investments as I have mentioned before. The USD will strengthen on account of higher interest rates and US net exports will lessen because foreign money cannot buy as much US goods due to the US valuation.
Of course, the Fed policy is not one of contraction right now. 7 years of monetary expansion has created the US markets what they are today. The longer our markets stay like this, I suspect the harsher the correction. Congress could also prevent the market from being so expansionary by reducing the deficit by not spending so much–I don’t see that happening anytime soon.
Furthermore, our markets are suffering from the wealth effect meaning that people feel richer when the markets are up, and there is an unrealistic belief in the Fed being all-knowing in uncharted financial waters such as these.
Hear me now and believe me later. The next FED move will be to CUT rates, not hike. Bloomberg is trying to jawbone Gold down by talking about its “rich” levels and suggesting that it is going to run into trouble because of possibly THREE rate hikes by the FED….Mmmmpfffffffff!!!!
🙂 🙂 🙂
But seriously folk, just how stupid do these propagandists think the investing crowd is? Oh I know a lot of ’em drink the kool-aid, but not all of ’em! Gadzooks! Meanwhile the gold price calmly takes out 1350.00….
Really enjoying Lara’s analysis on the Gold site. The lady rocks!
We are potentially looking at a multi-year opportunity in the yellow metal, with probably even greater potential in its more volatile white cousin…
BTW Did anybody notice how jacked-up European futures were overnight? The DAX was up over 2%!!
What are they doing printing red today??
Just what exactly were the banksters hiding, hmmnnn…?
Well the Market is a DUMB A_ s F _ _ K… So Very Stupid!
Just like changing the road white lines to point straight off a cliff… and all will drive off that cliff in the night or in a rain storm.
TICK… TICK… TICK… 19_7!
NO way the Fed raises before the election in November… you can bet everything you own and yourself & family into slavery of that!!!
I recently saw a study on how much additional servicing cost each 25 basis point hike would cost the US (as well as other holders of US debt) to service its obligations and it was humongous. Believe me, I don’t care what comes out of the mouth of lying FED propagandists, they a’int raising…not by so much as a single basis point!
Don’t get me wrong; I know they will be forced to eventually, but they will not do so voluntarily as that window is several years’ passed…
First!!!
Thx Lara for analysis
Woo hoo!
You’re welcome.